fbpx

Experimental Probability worksheet

Suitable for Year groups: 9, 10, 11
GCSE Tier:
Foundation/Higher
Targeting grades: 4-5
0.0/5

Total Reviews: (0)

Prerequisite knowledge: Calculate experimental and theoretical probability—plot results from experiments on a graph.
0.0/5

Total Reviews: (0)

Experimental Probability worksheet description

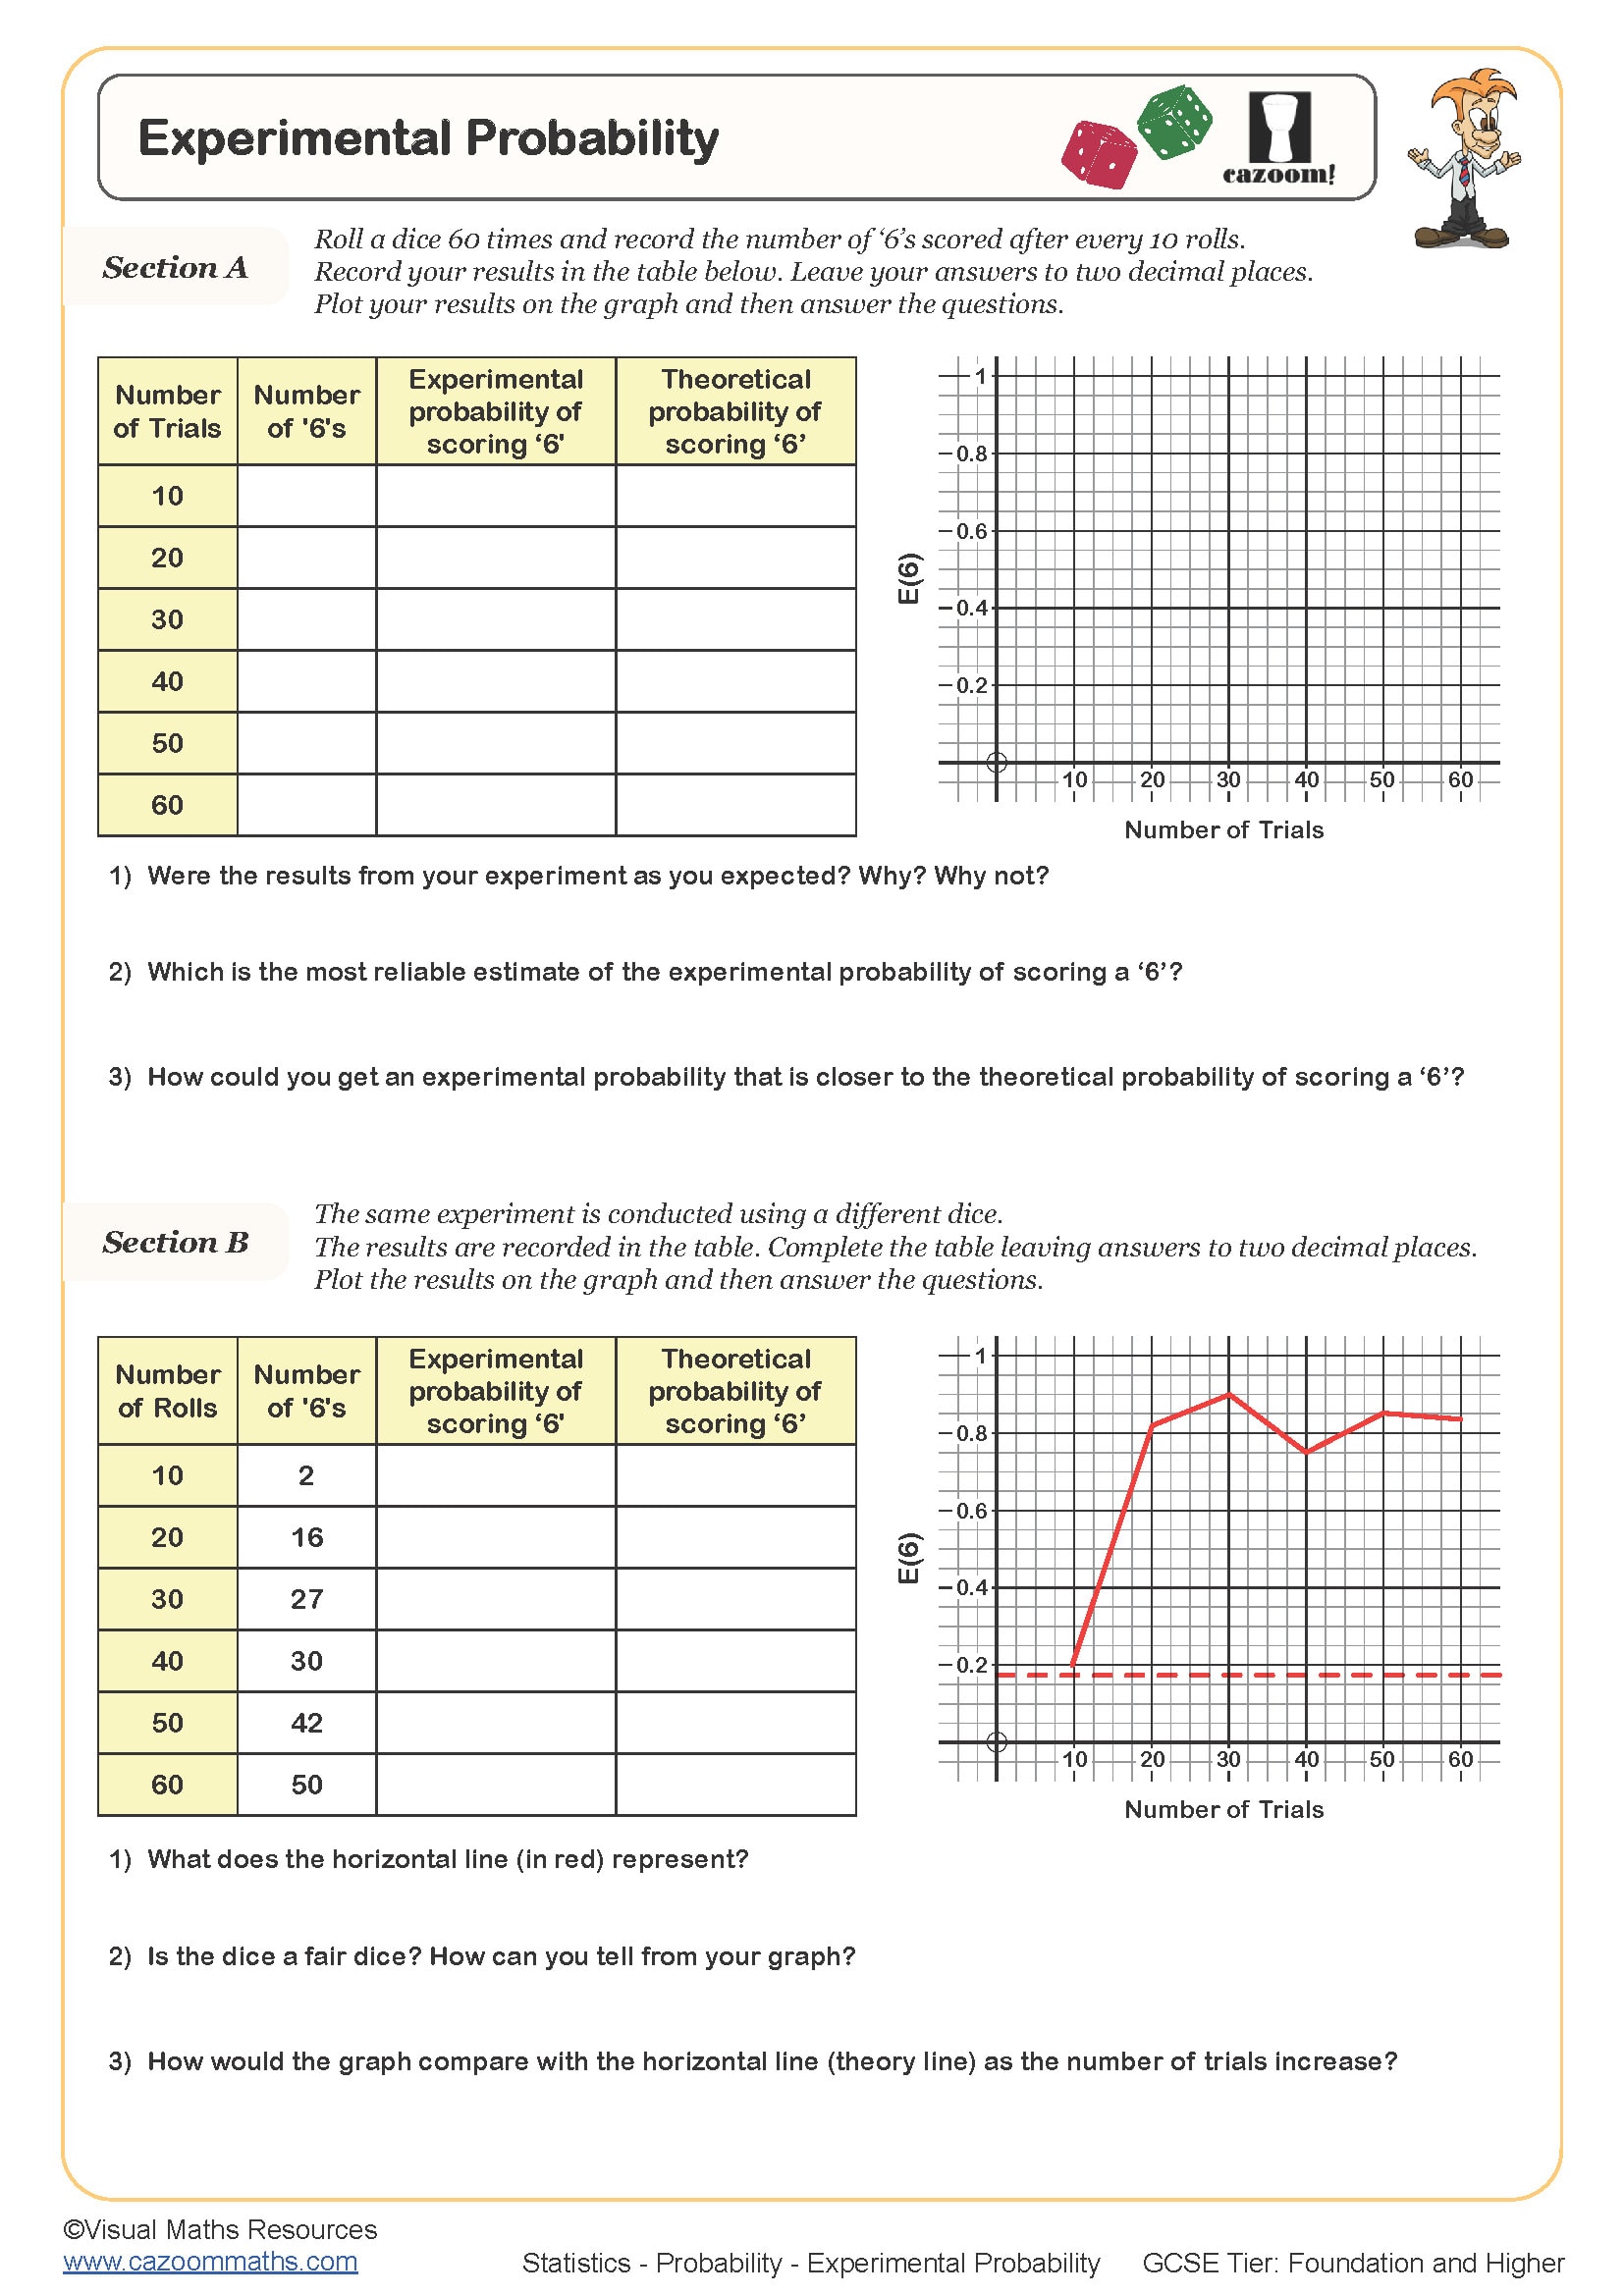
Students will conduct their own dice experiment and compare their results with theoretical probability in section A. In section A, pupils must roll a dice 60 times and record the number of ‘6’s scored after every 10 rolls in the table provided and plot their results on a graph (axes provided). Pupils will compare their results with the theoretical probability of rolling a fair dice and could also compare their results with their peers.

In section B, the same experiment has been carried out, but this time the results have been provided. Students will again work out the experimental probability of these results, plot them on a graph and discuss by answering questions about the data.

Related to Experimental Probability worksheet:

WE LOVE TO GET YOUR FEEDBACK:

{{ reviewsTotal }}{{ options.labels.singularReviewCountLabel }}
{{ reviewsTotal }}{{ options.labels.pluralReviewCountLabel }}
{{ options.labels.newReviewButton }}
{{ userData.canReview.message }}
X

Get 20 FREE MATHS WORKSHEETS

Fill out the form below to get 20 FREE maths worksheets!