Applications of Functions: Interpreting Graphs WORKSHEET
Applications of Functions: Interpreting Graphs WORKSHEET DESCRIPTION
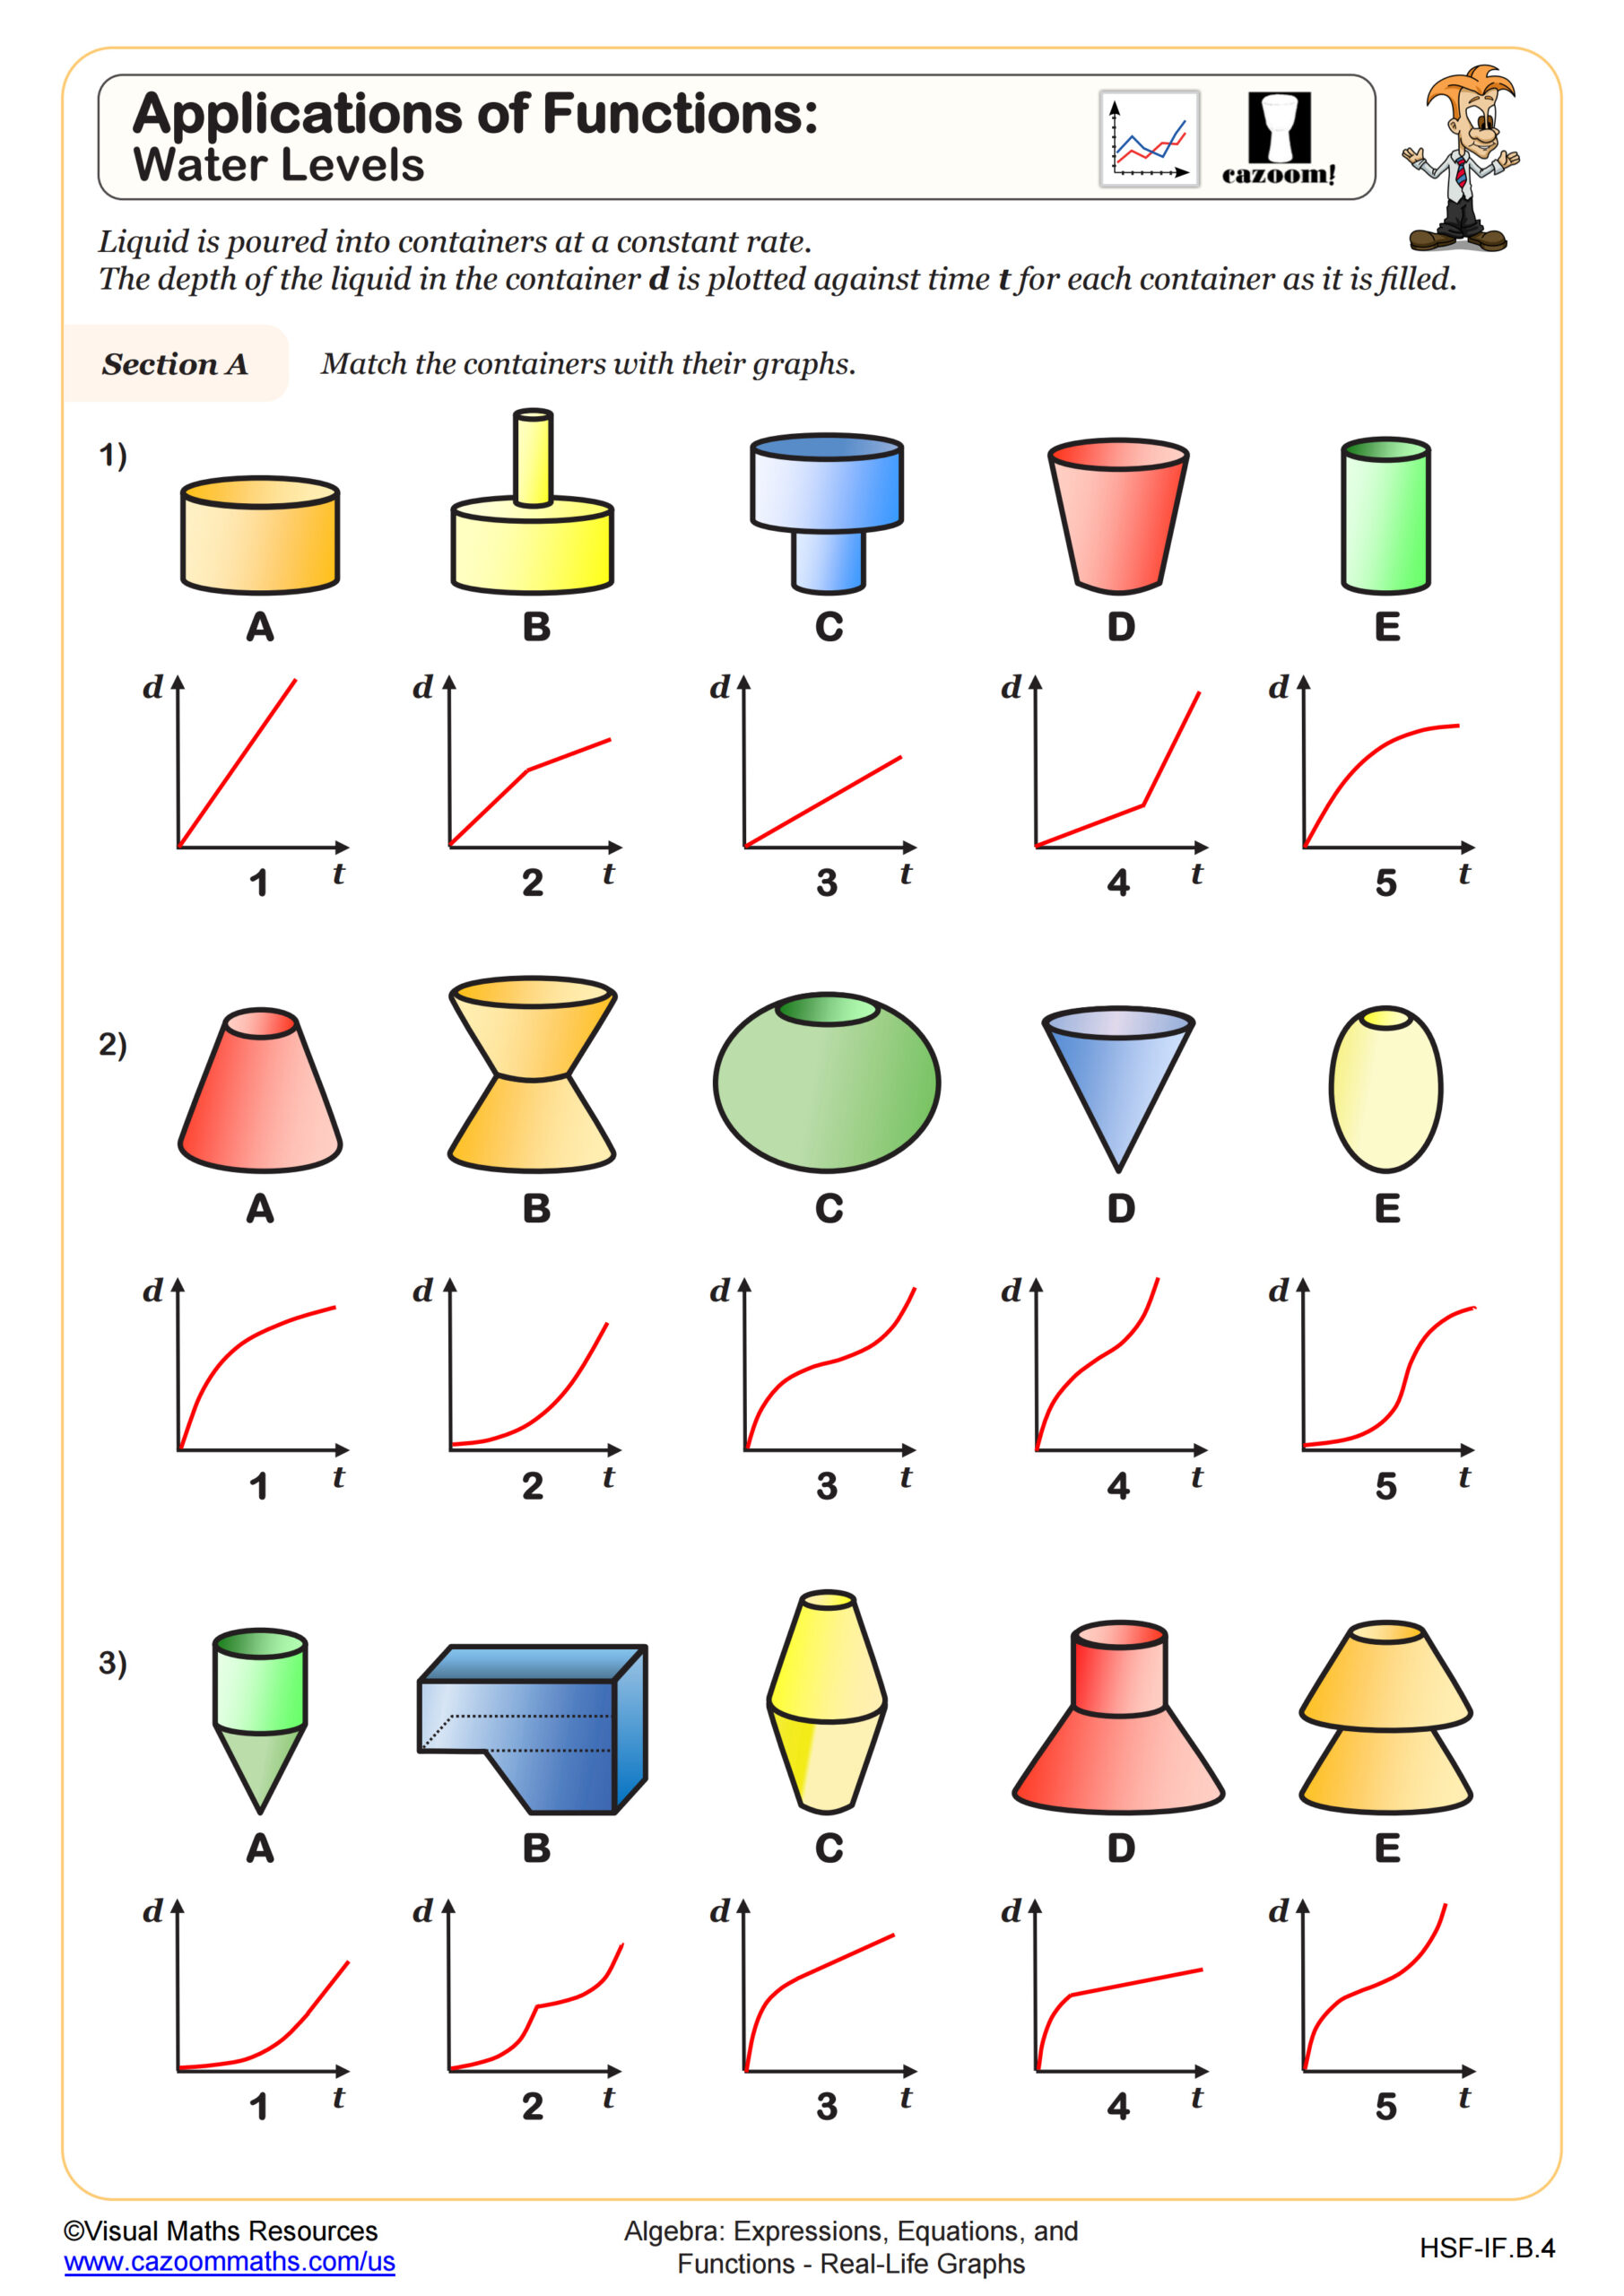
Students will interpret various forms of real life graphs throughout this worksheet. Students will start by matching different graphs to scenarios that they could represent in section A. Graphs include straight lines and increasing and decreasing curves, starting from the origin or otherwise. Scenarios include “Unemployment rose slowly for 5 years, but now it is rising dramatically” and “The temperature during the 24 hours of a summer's day.”
In section B, students have four different depth and time graphs of bathtubs being filled to interpret. Then in section C, learners will sketch graphs to illustrate four different situations. Axes are pre drawn for your students.
All worksheets are created by the team of experienced teachers at Cazoom Math.

RELATED TO Applications of Functions: Interpreting Graphs WORKSHEET
Frequently Asked Questions
This applications of functions: interpreting graphs worksheet is designed for students in Algebra I and IM 1 and aligns with Common Core State Standards.