Back to:
Block Diagrams (B) WORKSHEET
Suitable for Grades: 2nd Grade, 3rd Grade
CCSS: 2.MD.D.10, 3.MD.B.3
CCSS Description: Draw a picture graph and a bar graph (with single-unit scale) to represent a data set with up to four categories; solve simple put-together, take-apart, and compare problems using information presented in a bar graph.
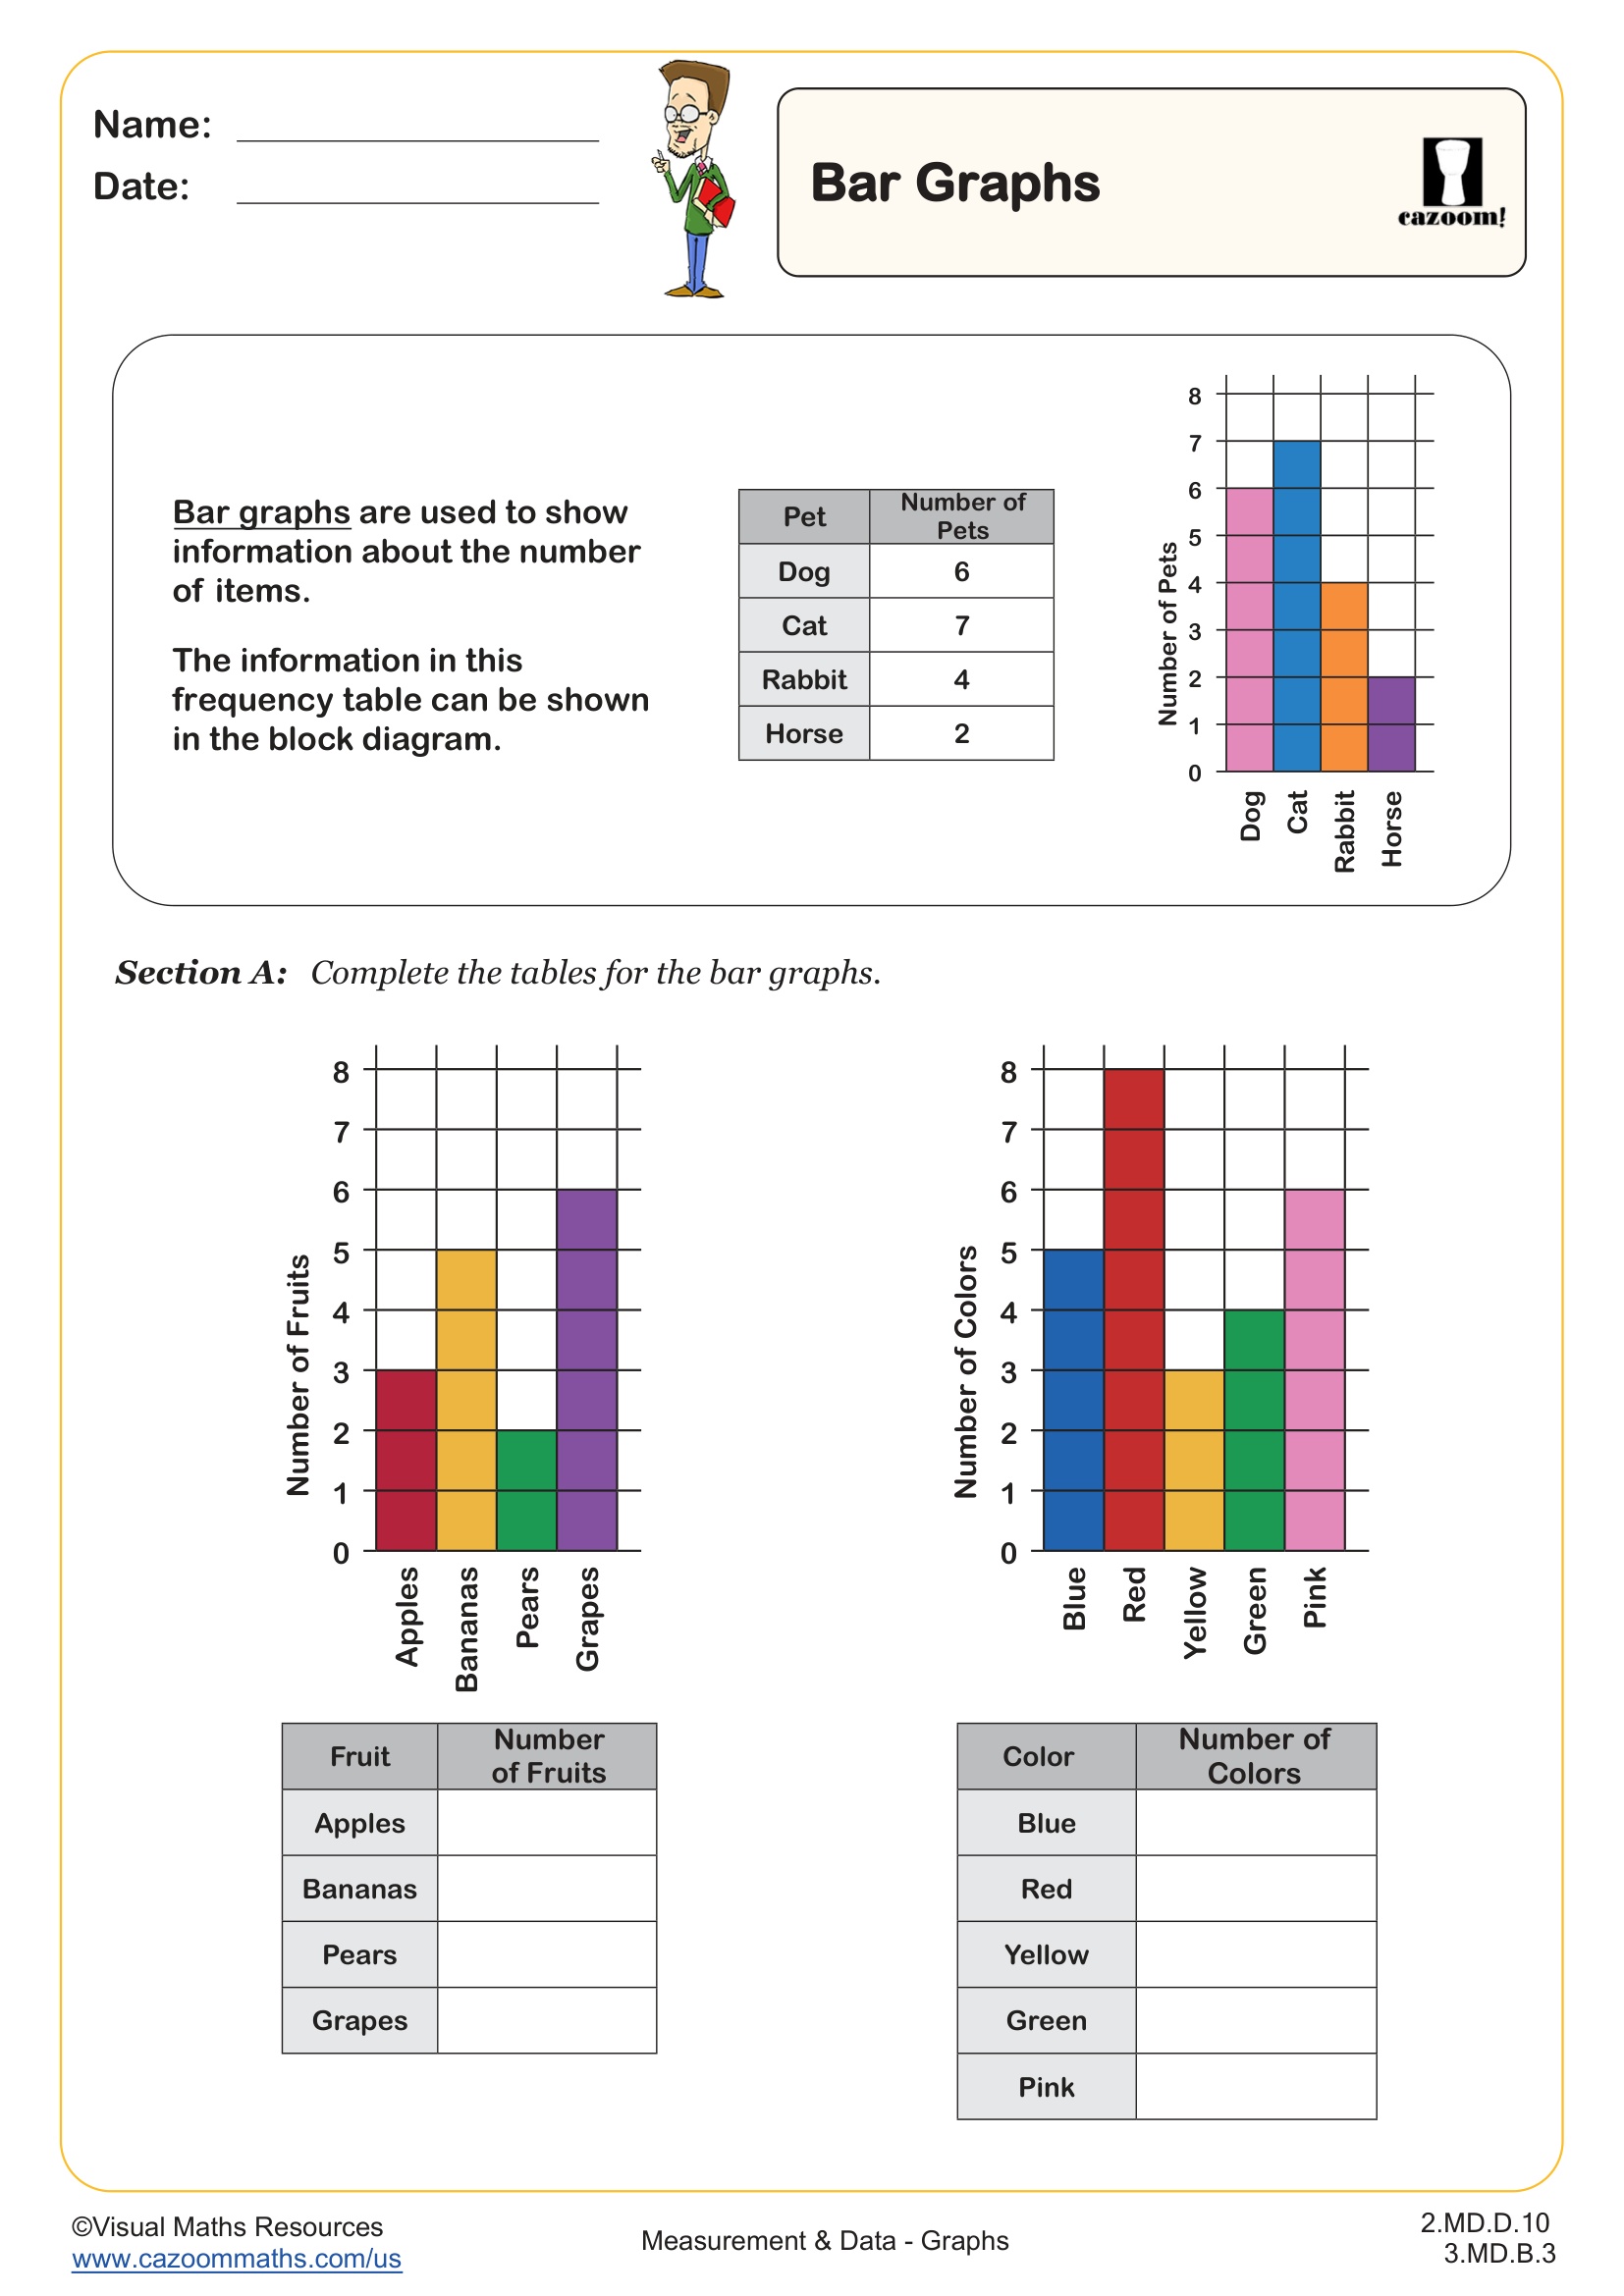
Draw a scaled picture graph and a scaled bar graph to represent a data set with several categories. Solve one- nd two-step “how many more” and “how many less” problems using information presented in scaled bar graphs. For example, draw a bar graph in which each square in the bar graph might represent 5 pets.
Draw a scaled picture graph and a scaled bar graph to represent a data set with several categories. Solve one- nd two-step “how many more” and “how many less” problems using information presented in scaled bar graphs. For example, draw a bar graph in which each square in the bar graph might represent 5 pets.
Block Diagrams (B) WORKSHEET DESCRIPTION
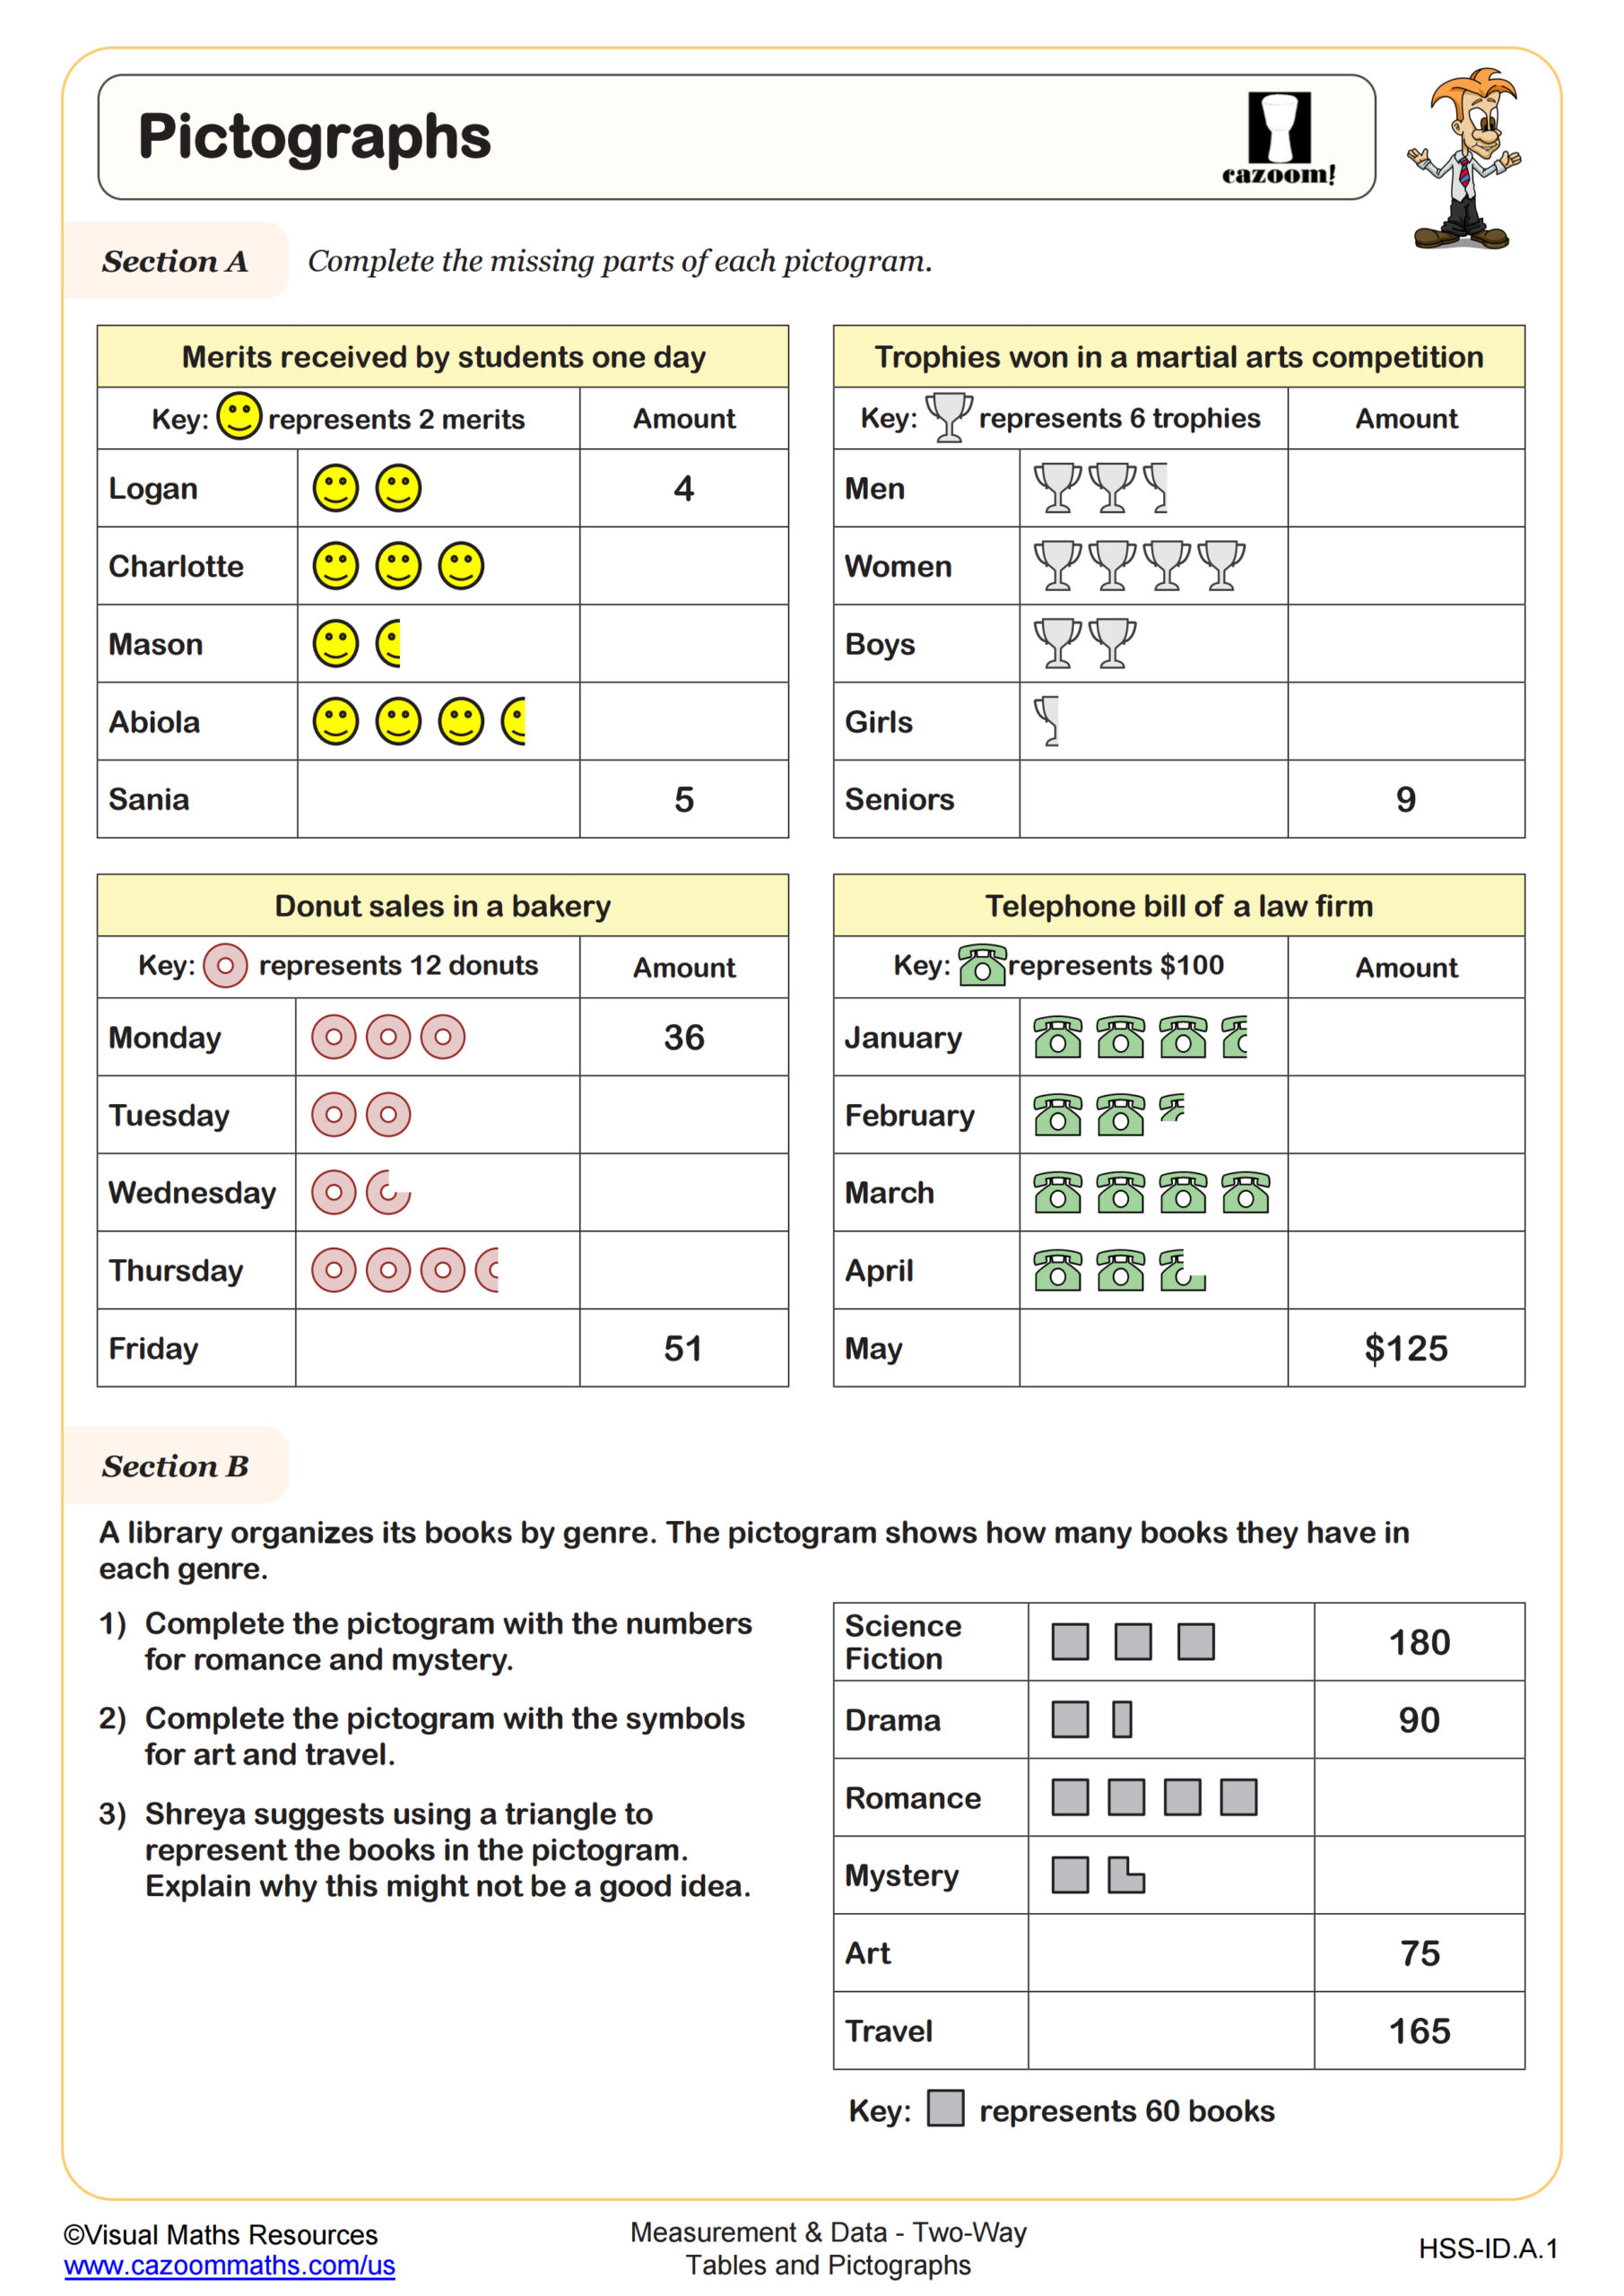
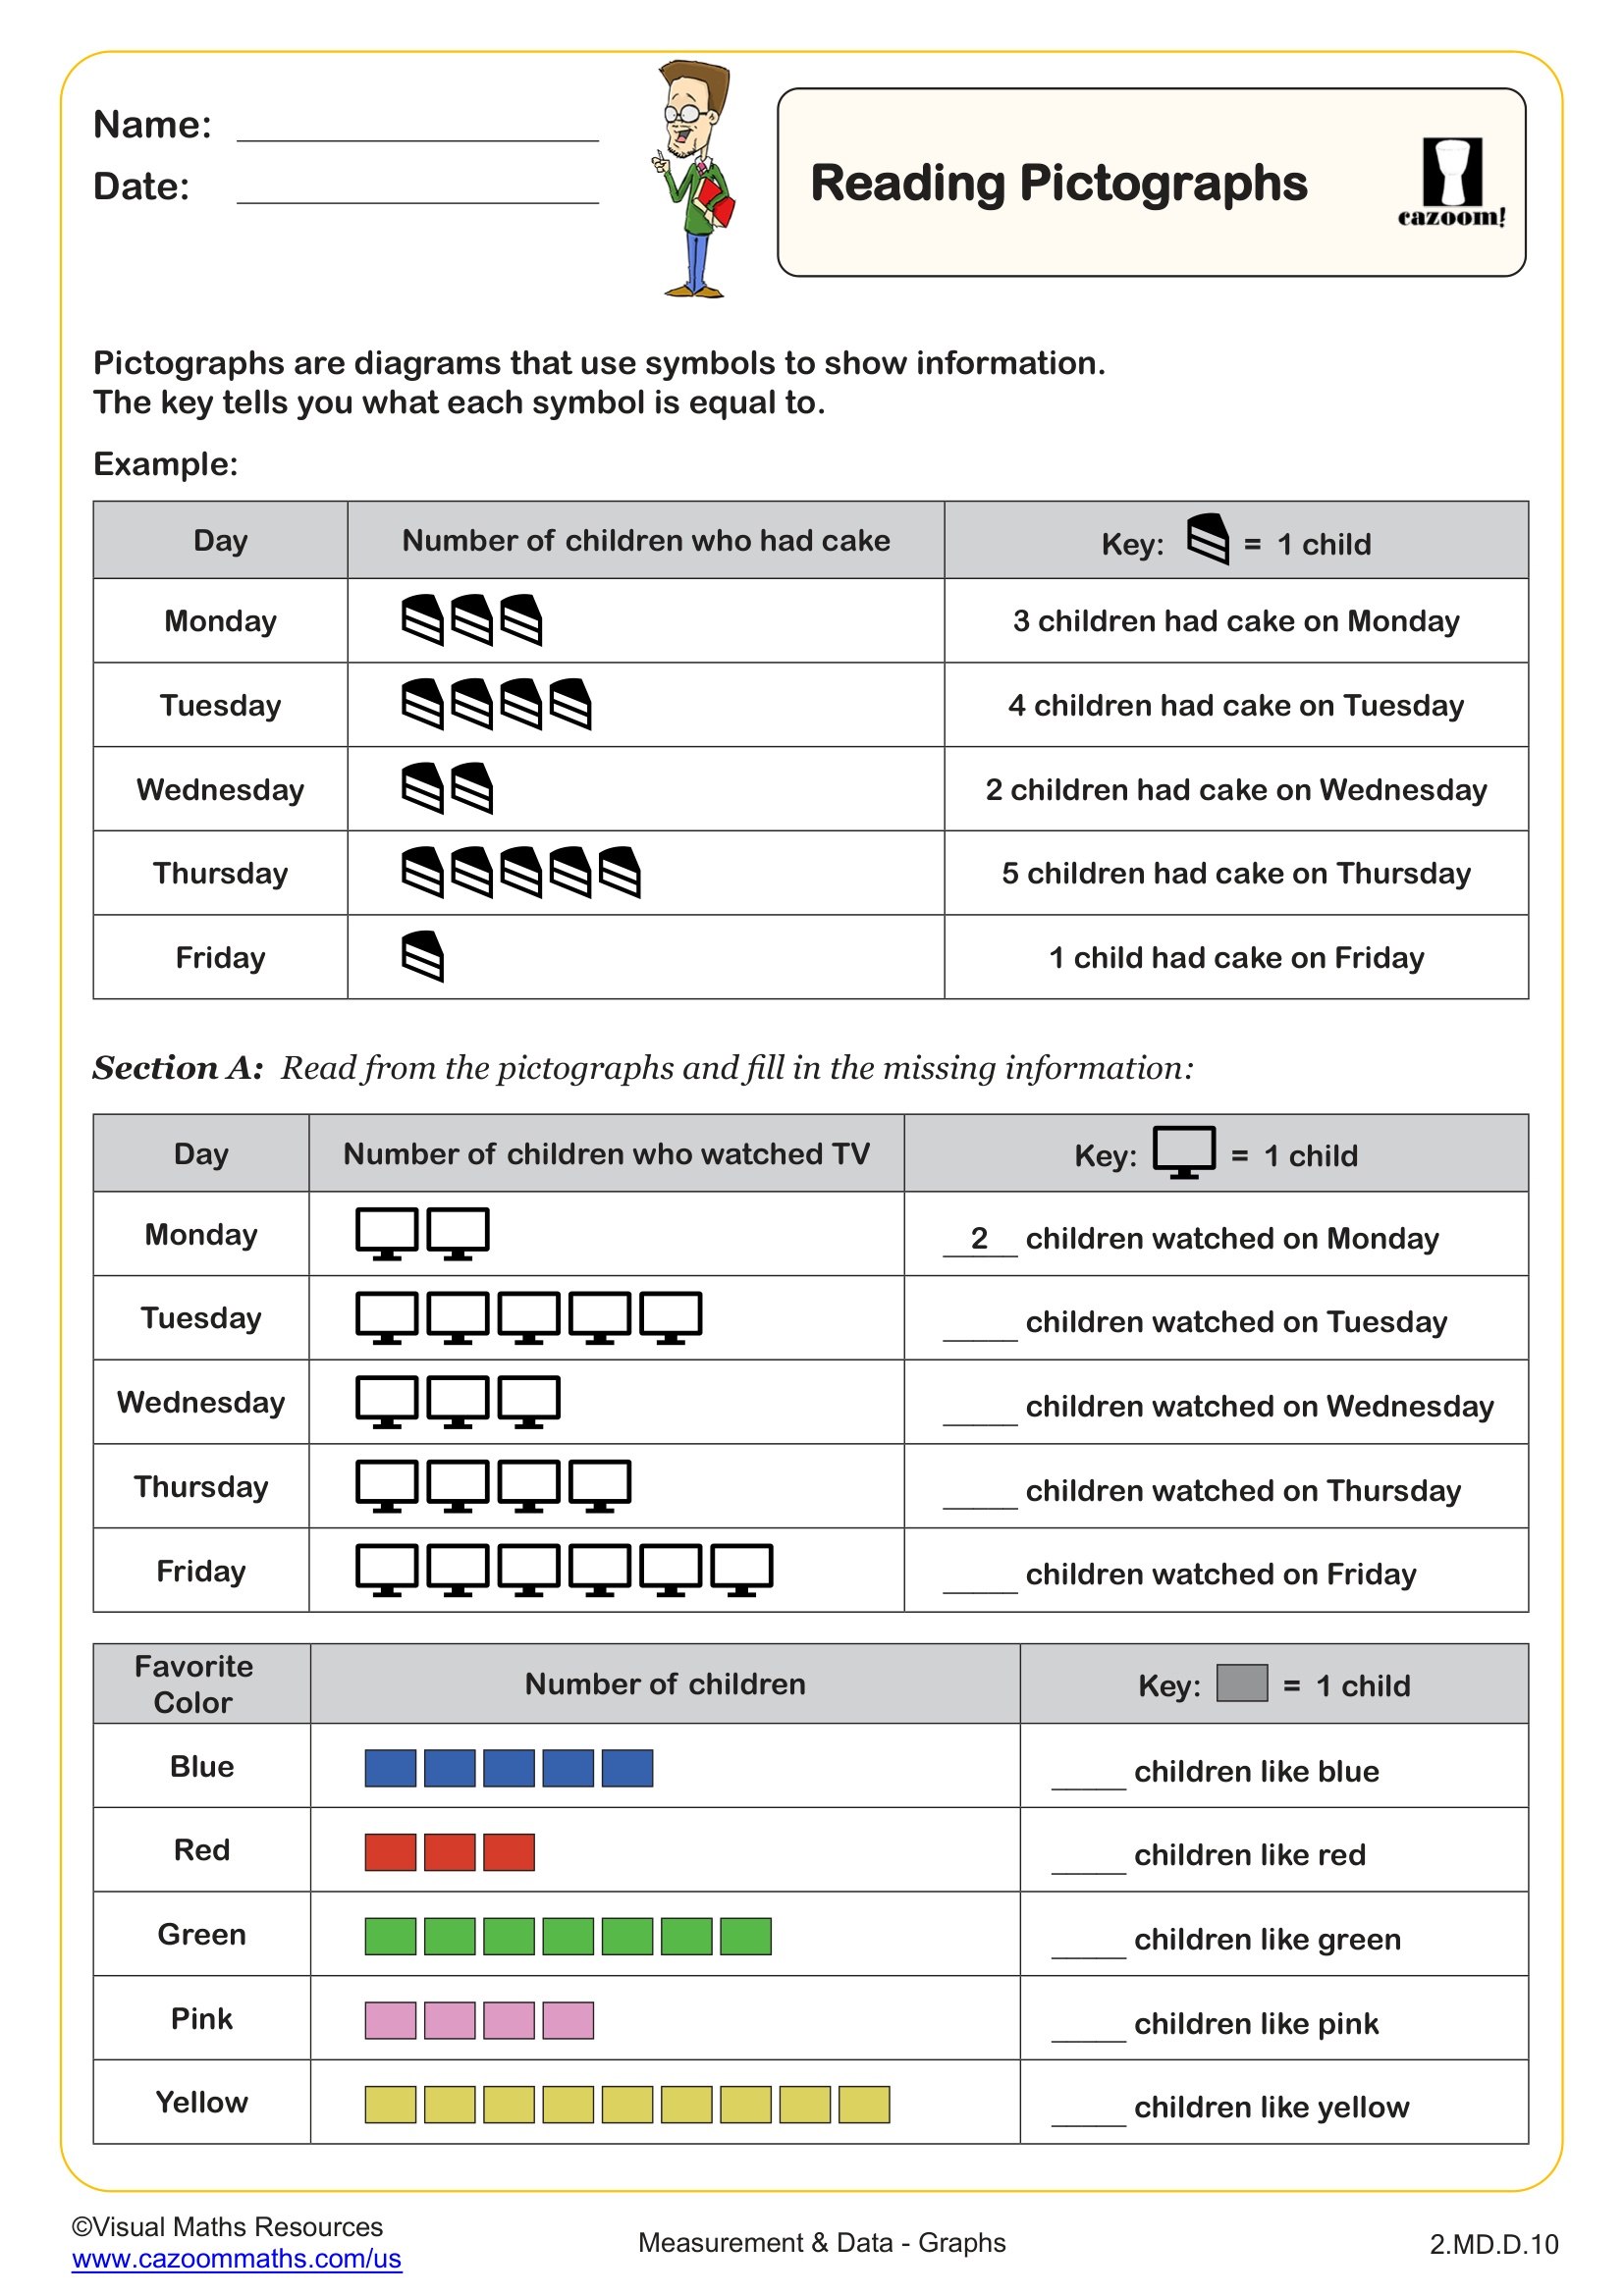
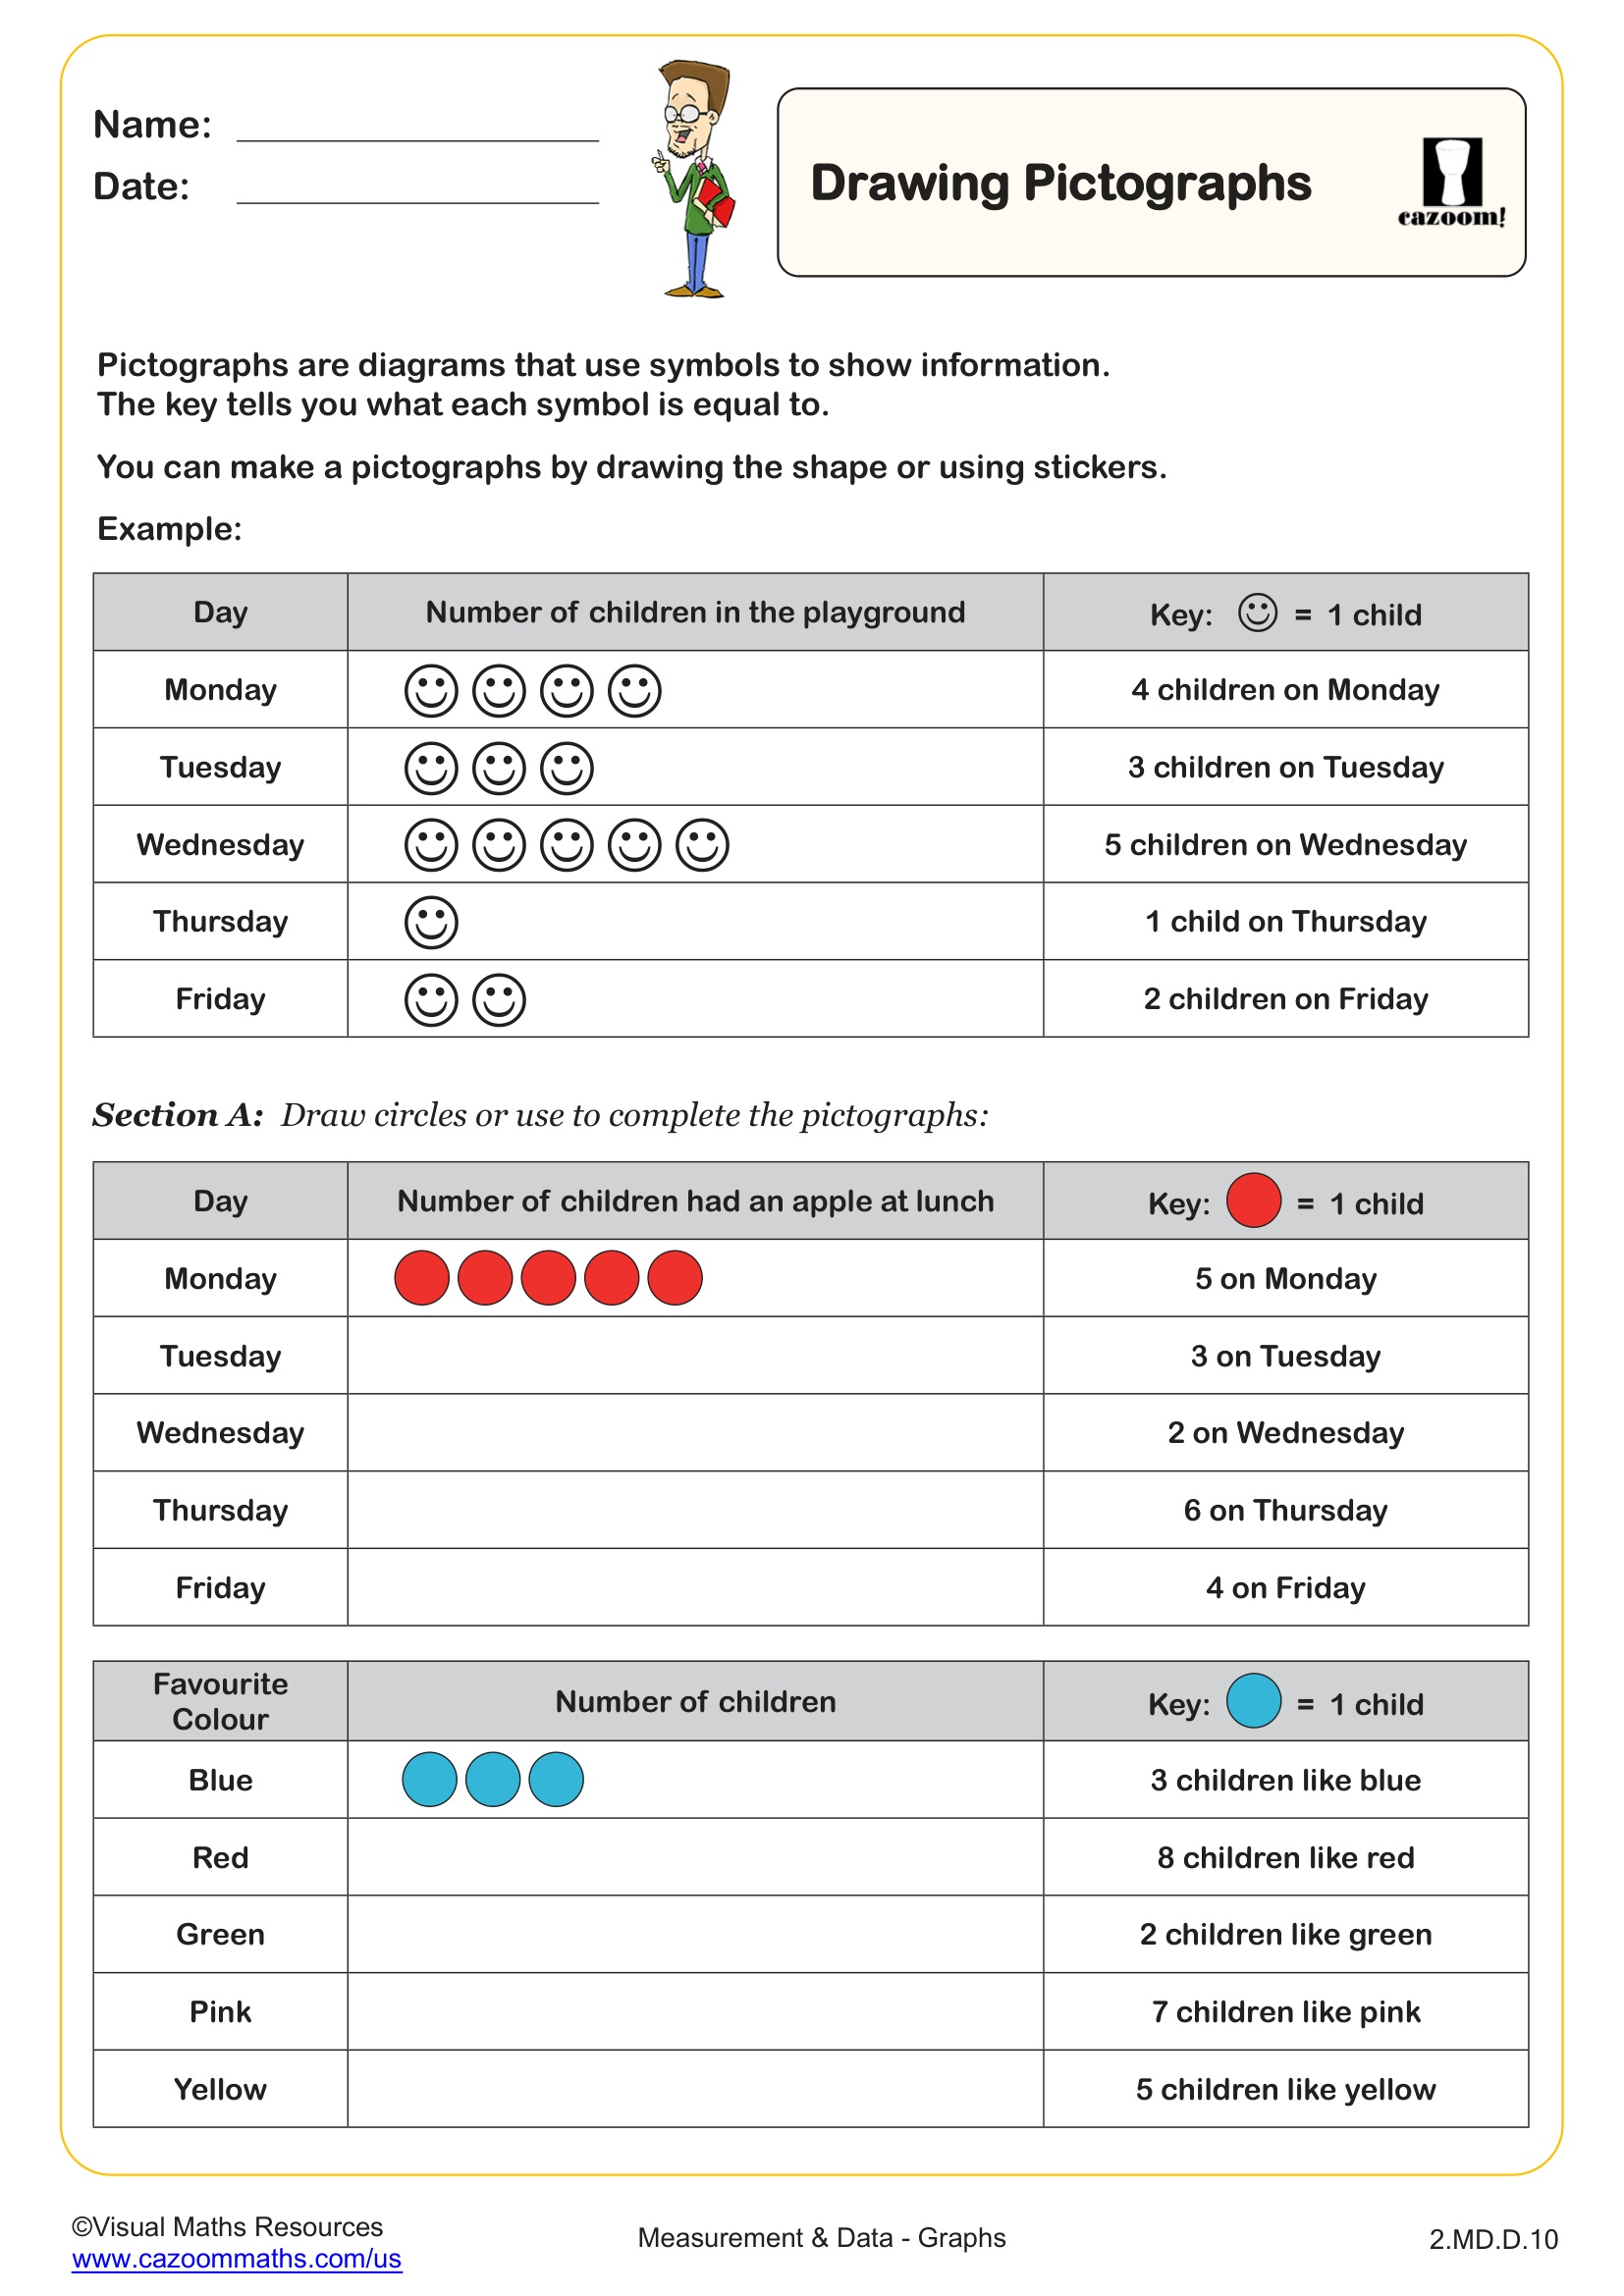
This worksheet will see your students reading information from block diagrams, completing frequency tables from block diagrams and drawing block diagrams from the information given. Learners are required to read from scales that increase in 2s, 5s and 10s throughout inline with the skip counting requirements of the national curriculum for year 2 students.
All worksheets are created by the team of experienced teachers at Cazoom Math.

RELATED TO Block Diagrams (B) WORKSHEET
Frequently Asked Questions
This worksheet is designed for 2nd and 3rd grade students. The focus on skip counting by 2s, 5s, and 10s aligns perfectly with the mathematical skills these grade levels are developing, making it an ideal bridge between basic counting and more complex data interpretation.