Changing Ratios WORKSHEET
Changing Ratios WORKSHEET DESCRIPTION
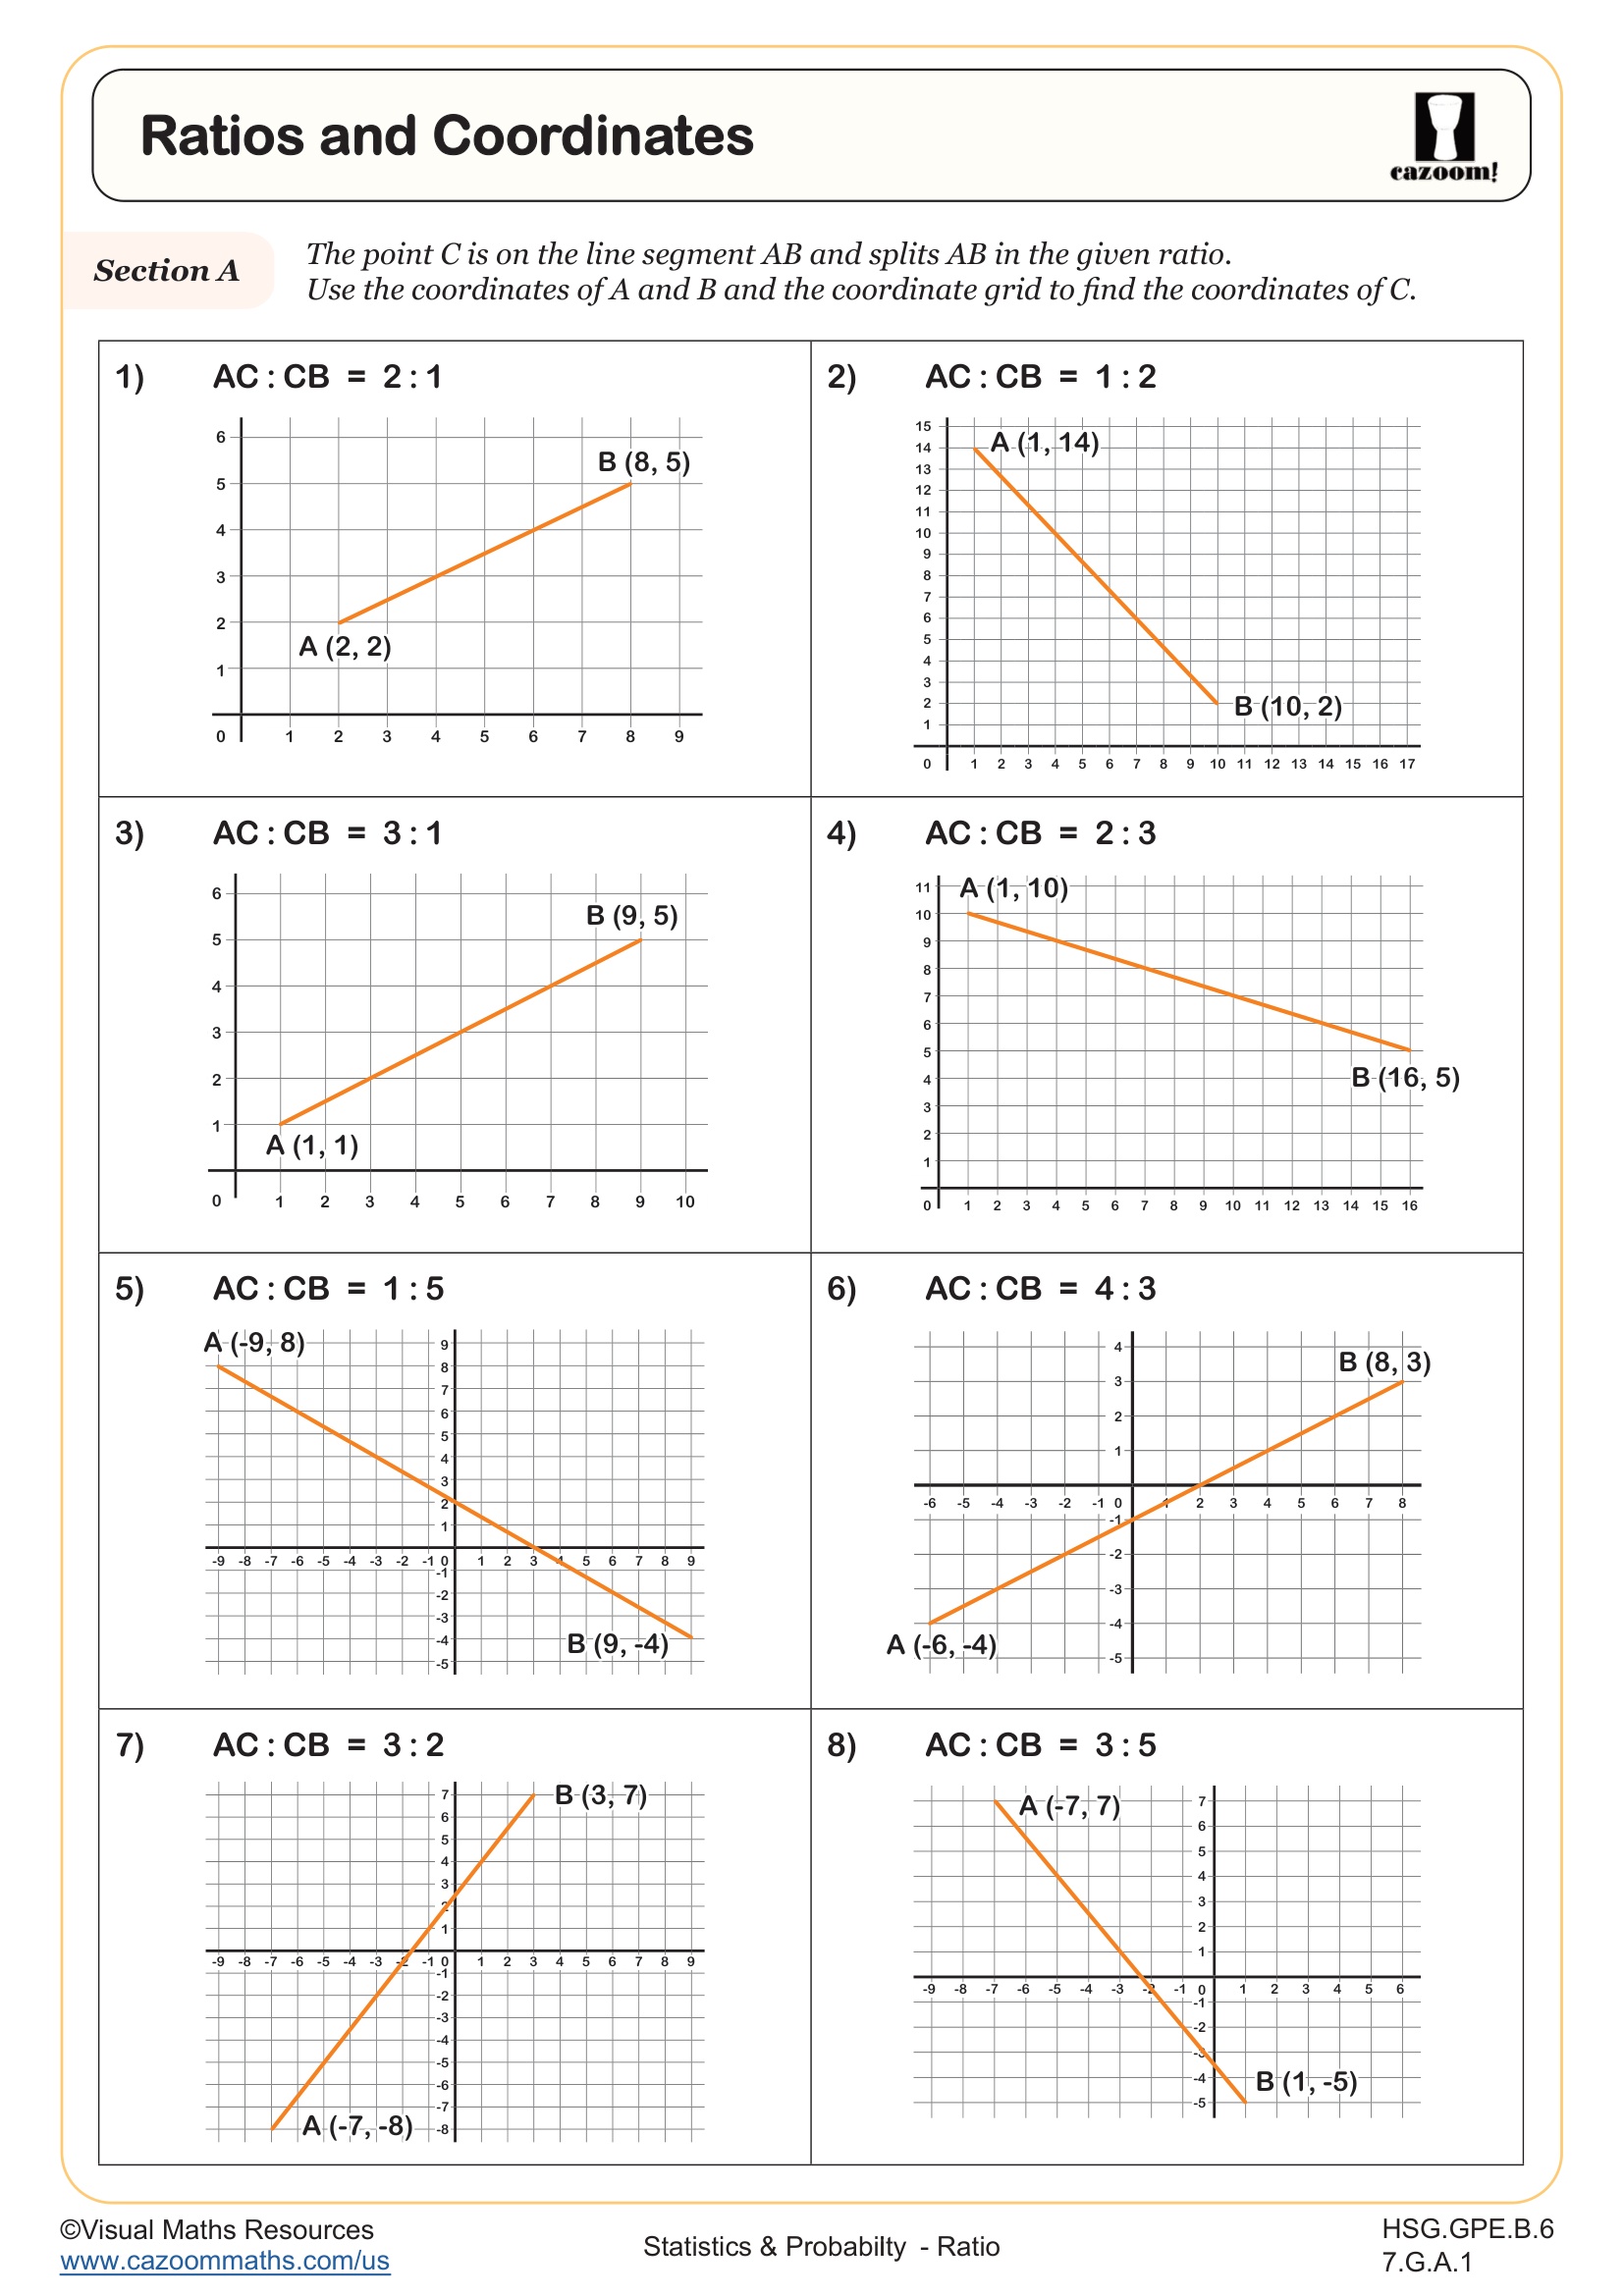
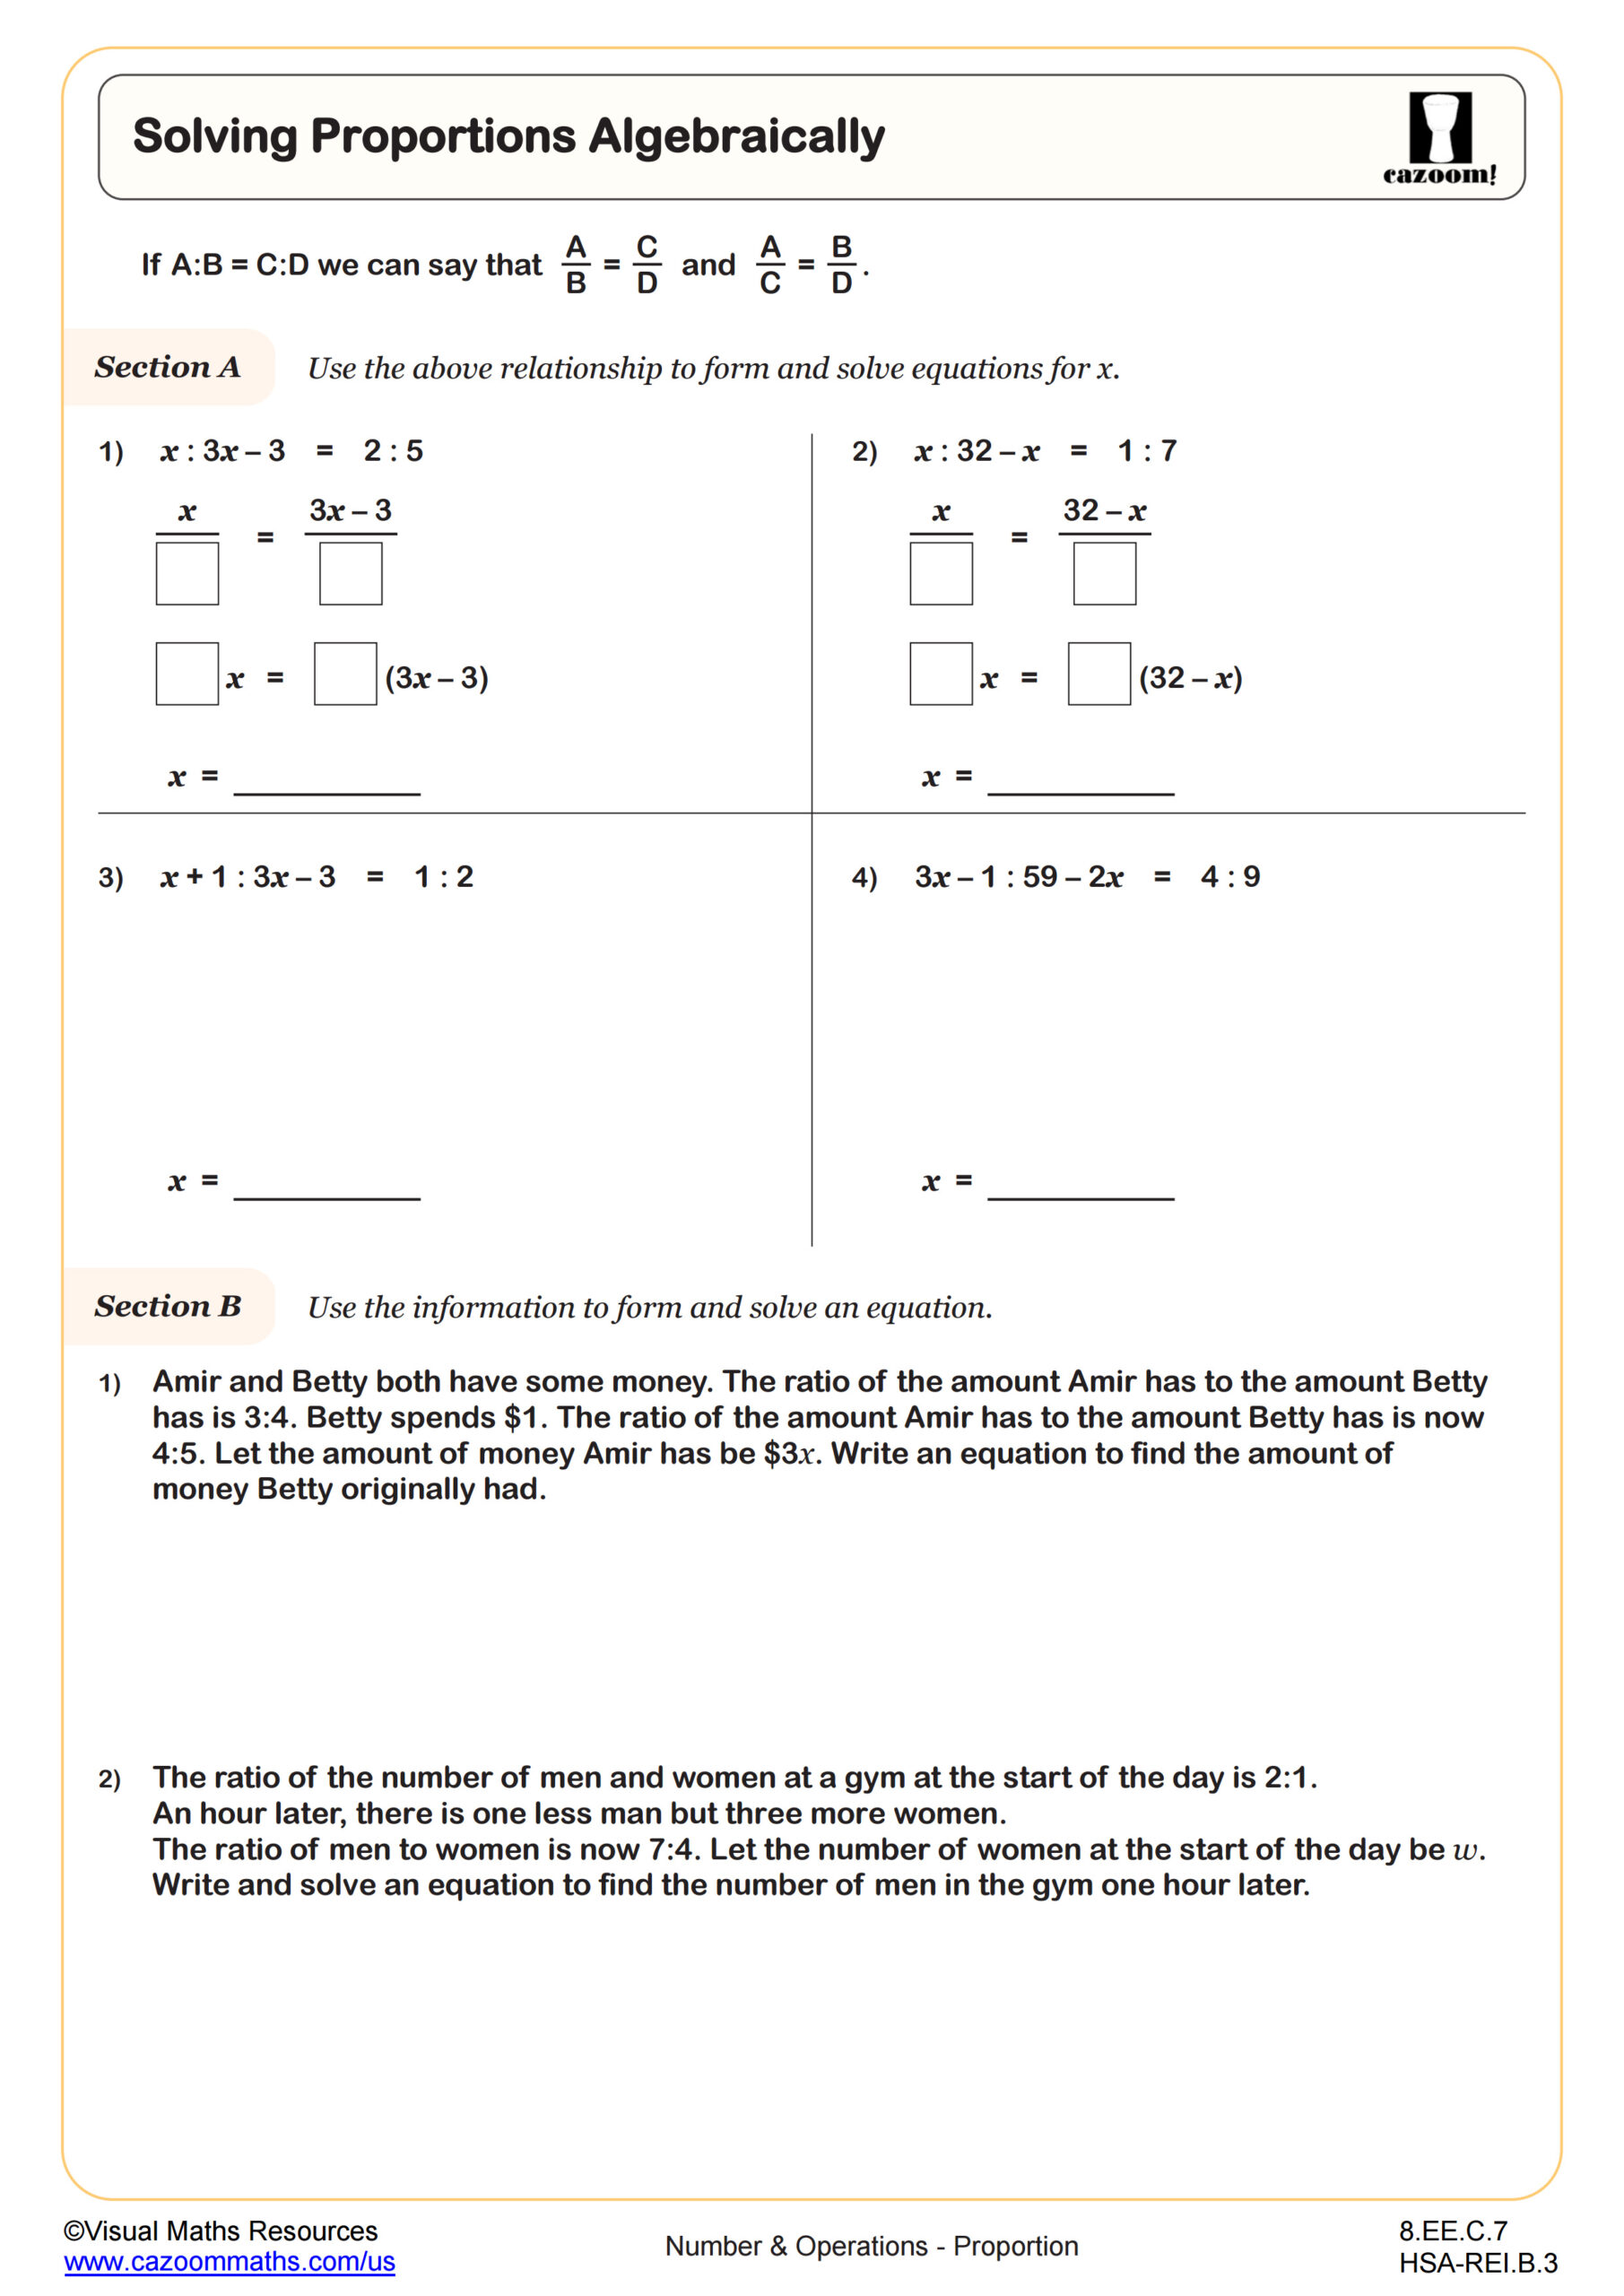
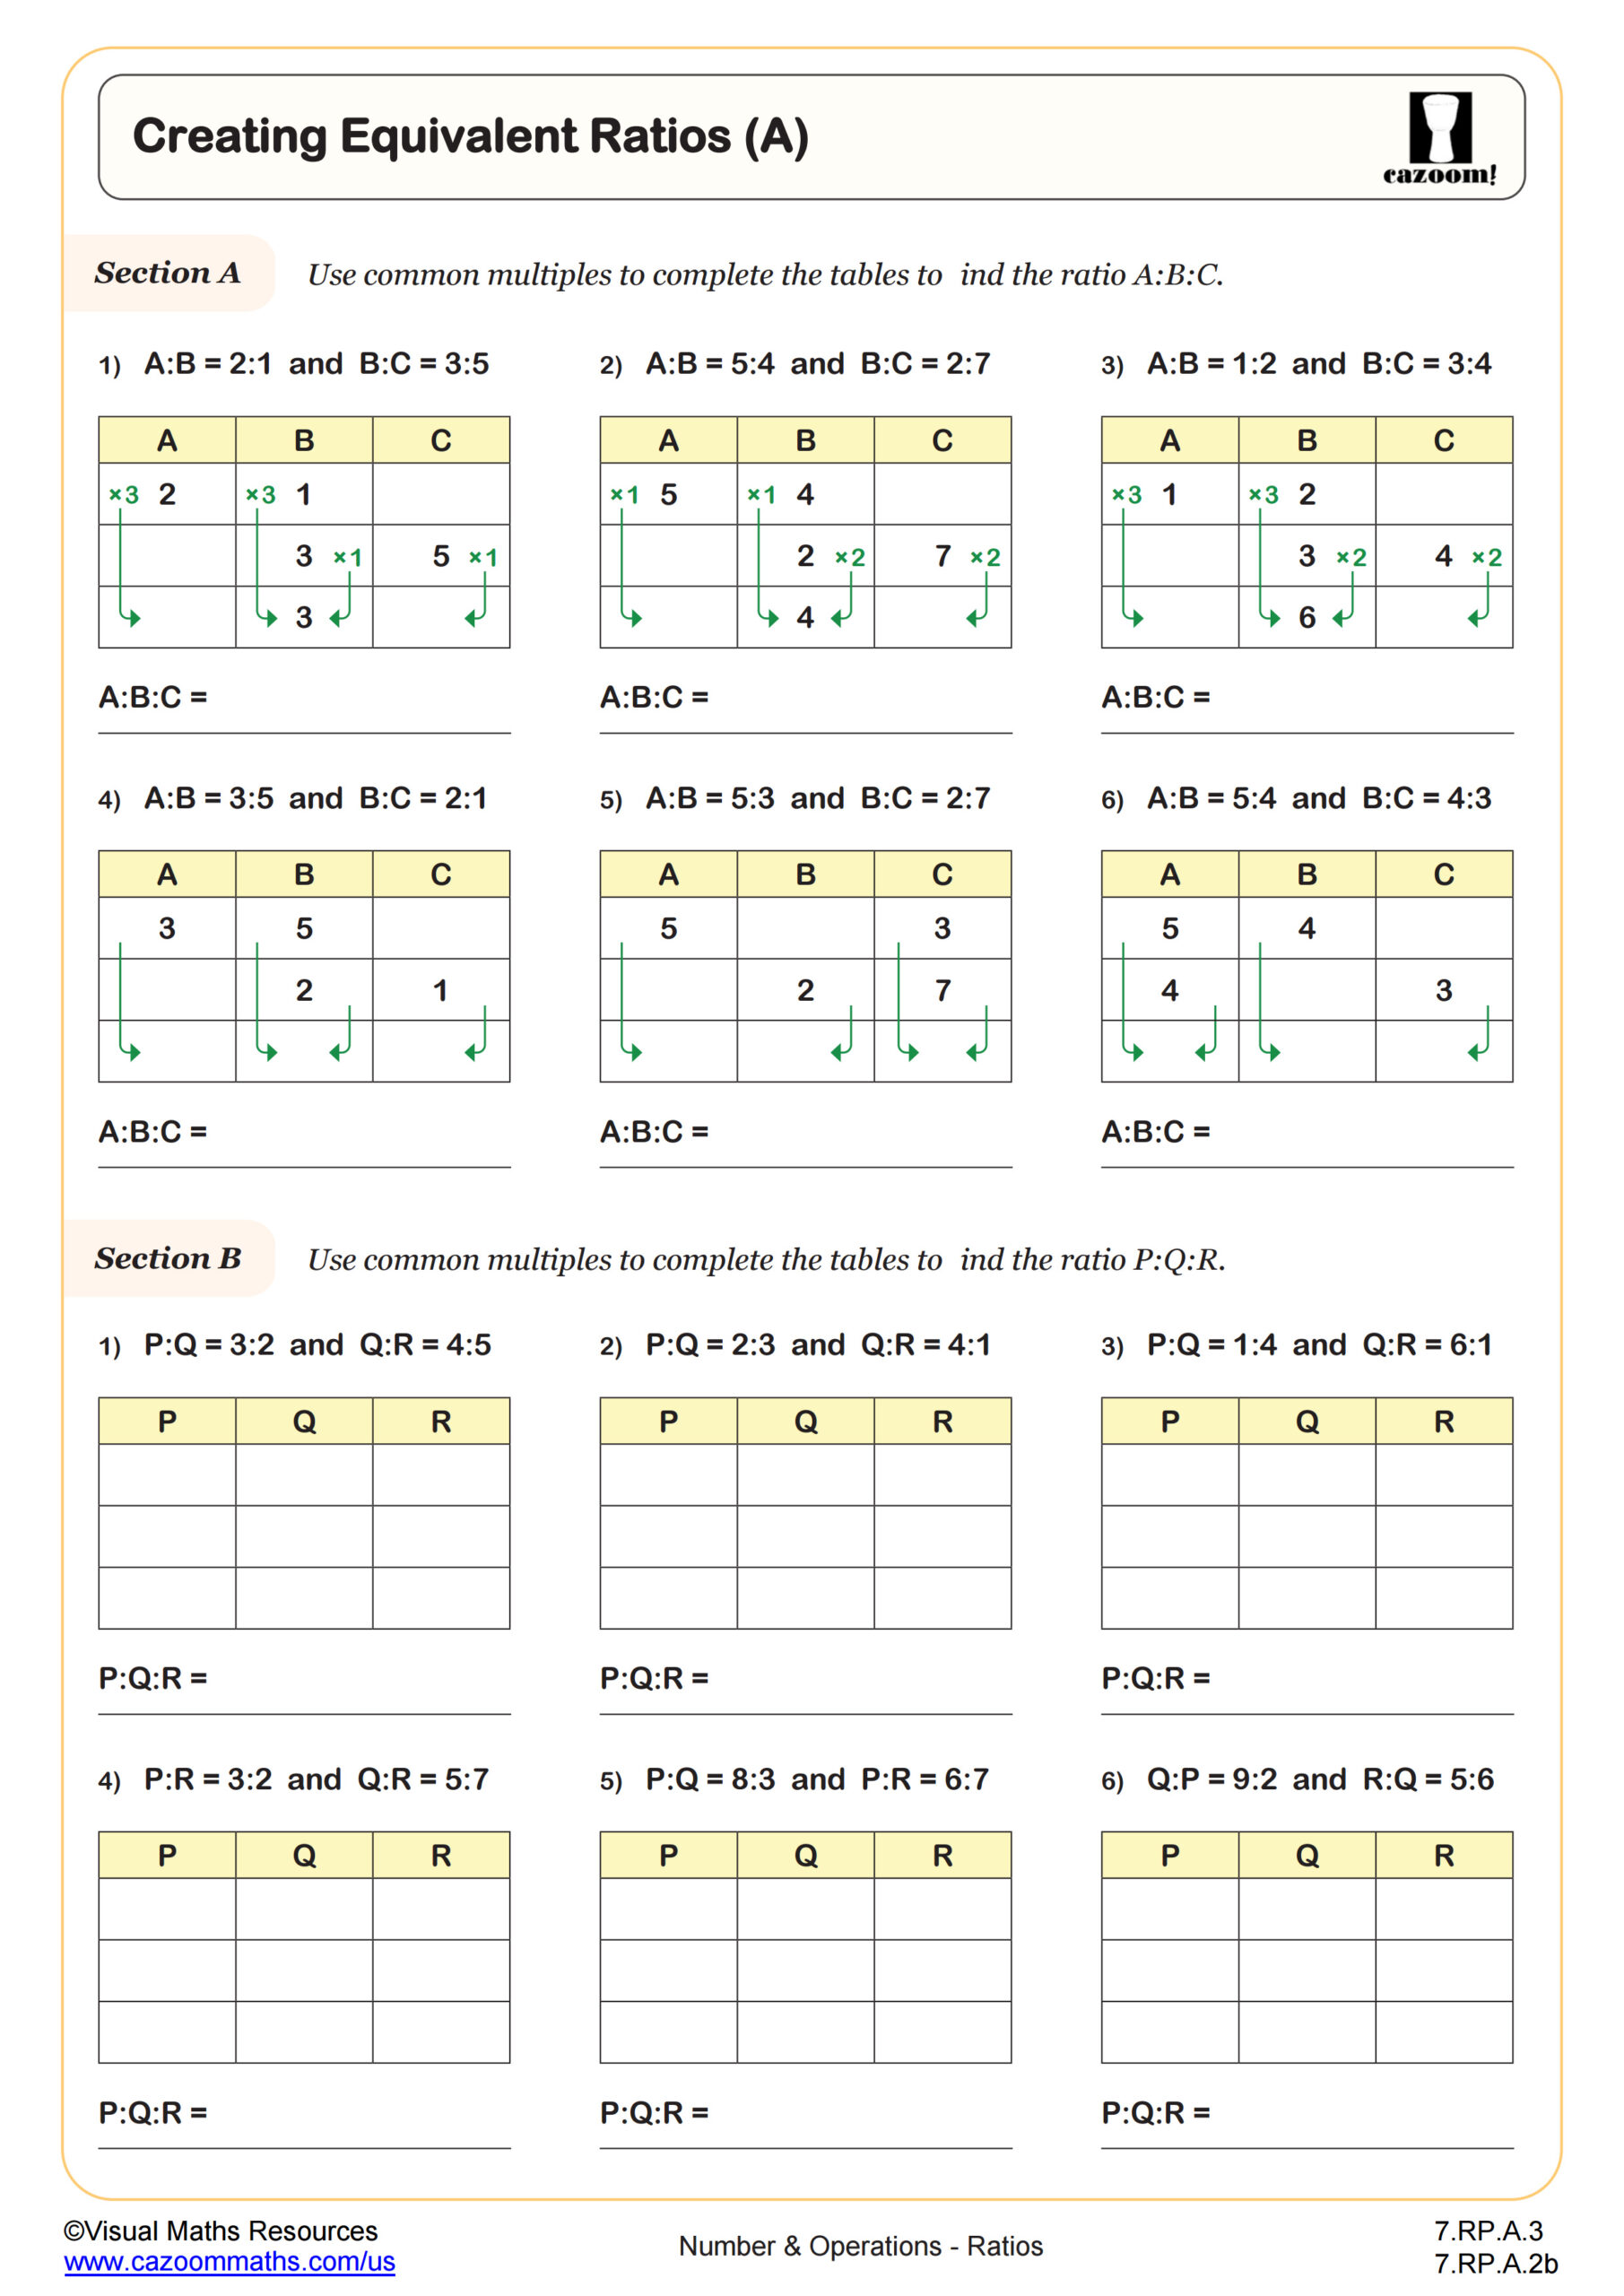
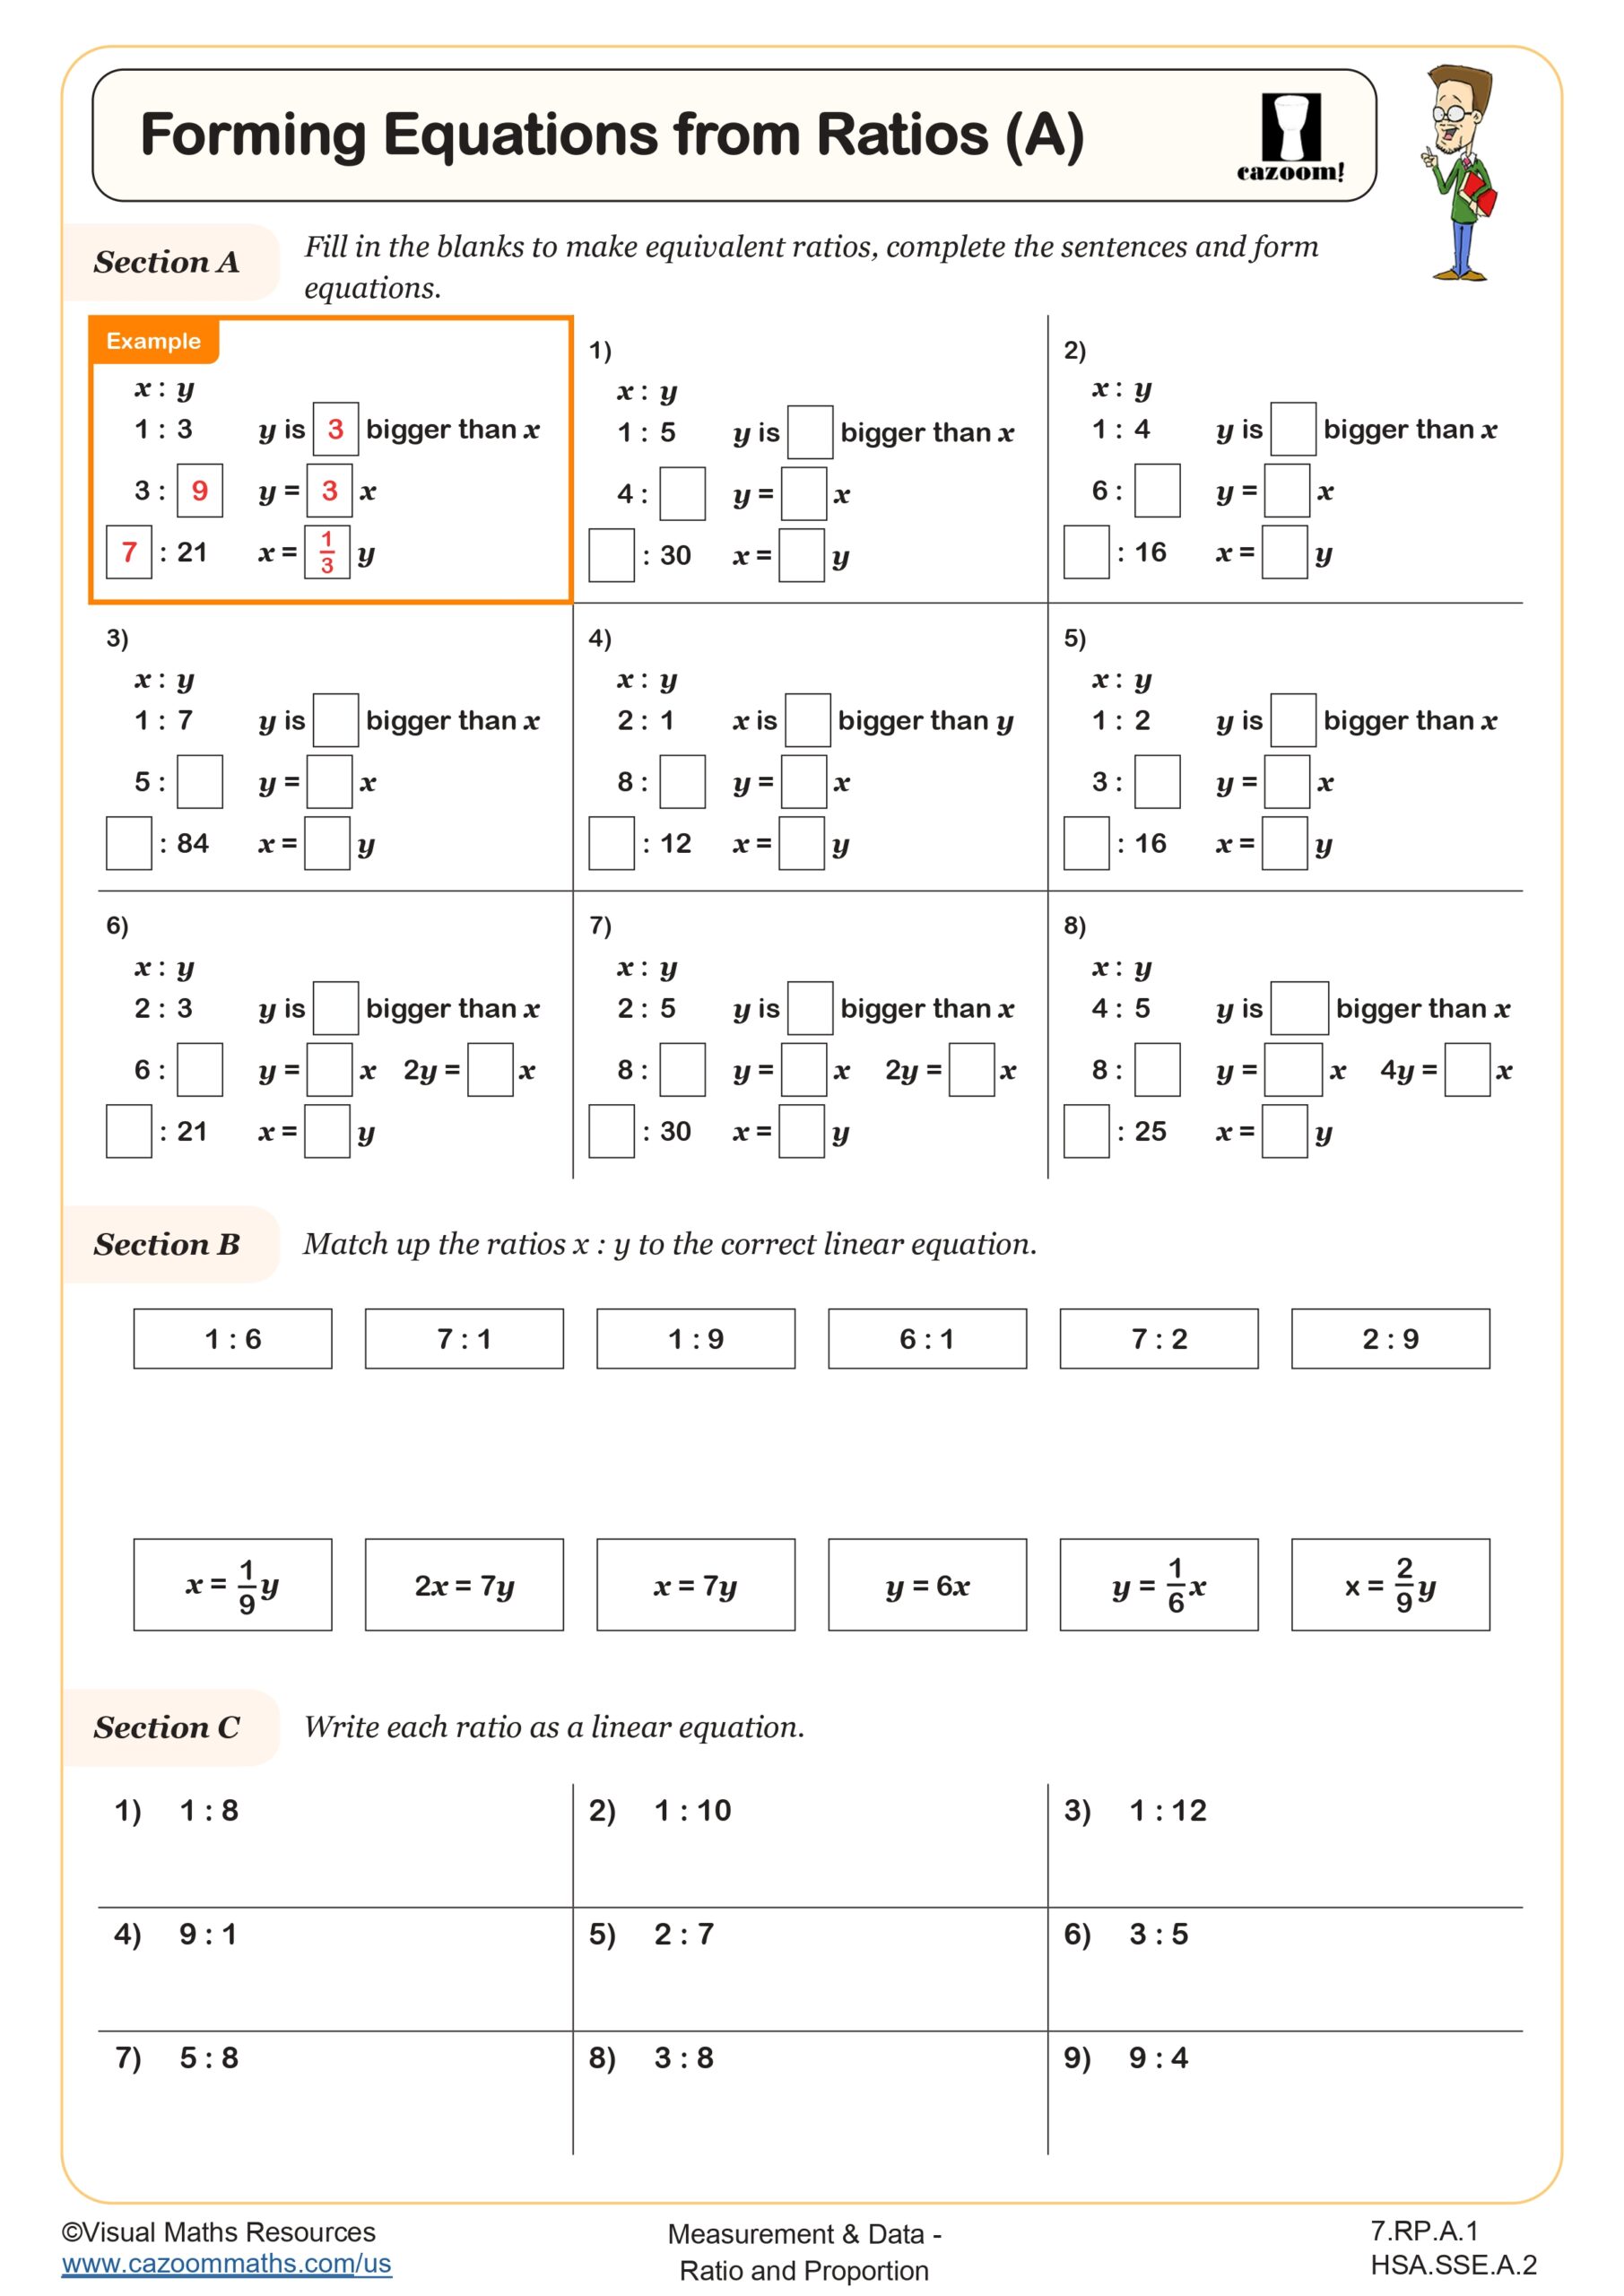
In this worksheet, students will solve ratio problems involving changing ratios. Learners are provided with a two part ratio in the form A:B, told which part of the ratio has changed, by how much, and what the new ratio is after the change. They will then use this information alongside a scaling or an algebraic method in order to find the original and new values of A and B.
Students will demonstrate their ability to: manipulate ratios systematically, apply different problem-solving methods, and understand how changes in individual values affect the overall ratio.
All worksheets are created by the team of experienced teachers at Cazoom Math.

RELATED TO Changing Ratios WORKSHEET
Frequently Asked Questions
This worksheet is specifically designed for 7th grade students who are developing their understanding of ratio relationships. At this level, students are ready to tackle more complex ratio problems that involve analyzing how changes to one part of a ratio affect the entire relationship. The skills practiced here build a strong foundation for advanced proportional reasoning.