Back to:
Choosing the Best Graphical Representation of Data WORKSHEET
Suitable for Grades: Algebra I
CCSS: HSS.ID.A.2
CCSS Description: Use statistics appropriate to the shape of the data distribution to compare center (median, mean) and spread (interquartile range, standard deviation) of two or more different data sets.
Choosing the Best Graphical Representation of Data WORKSHEET DESCRIPTION
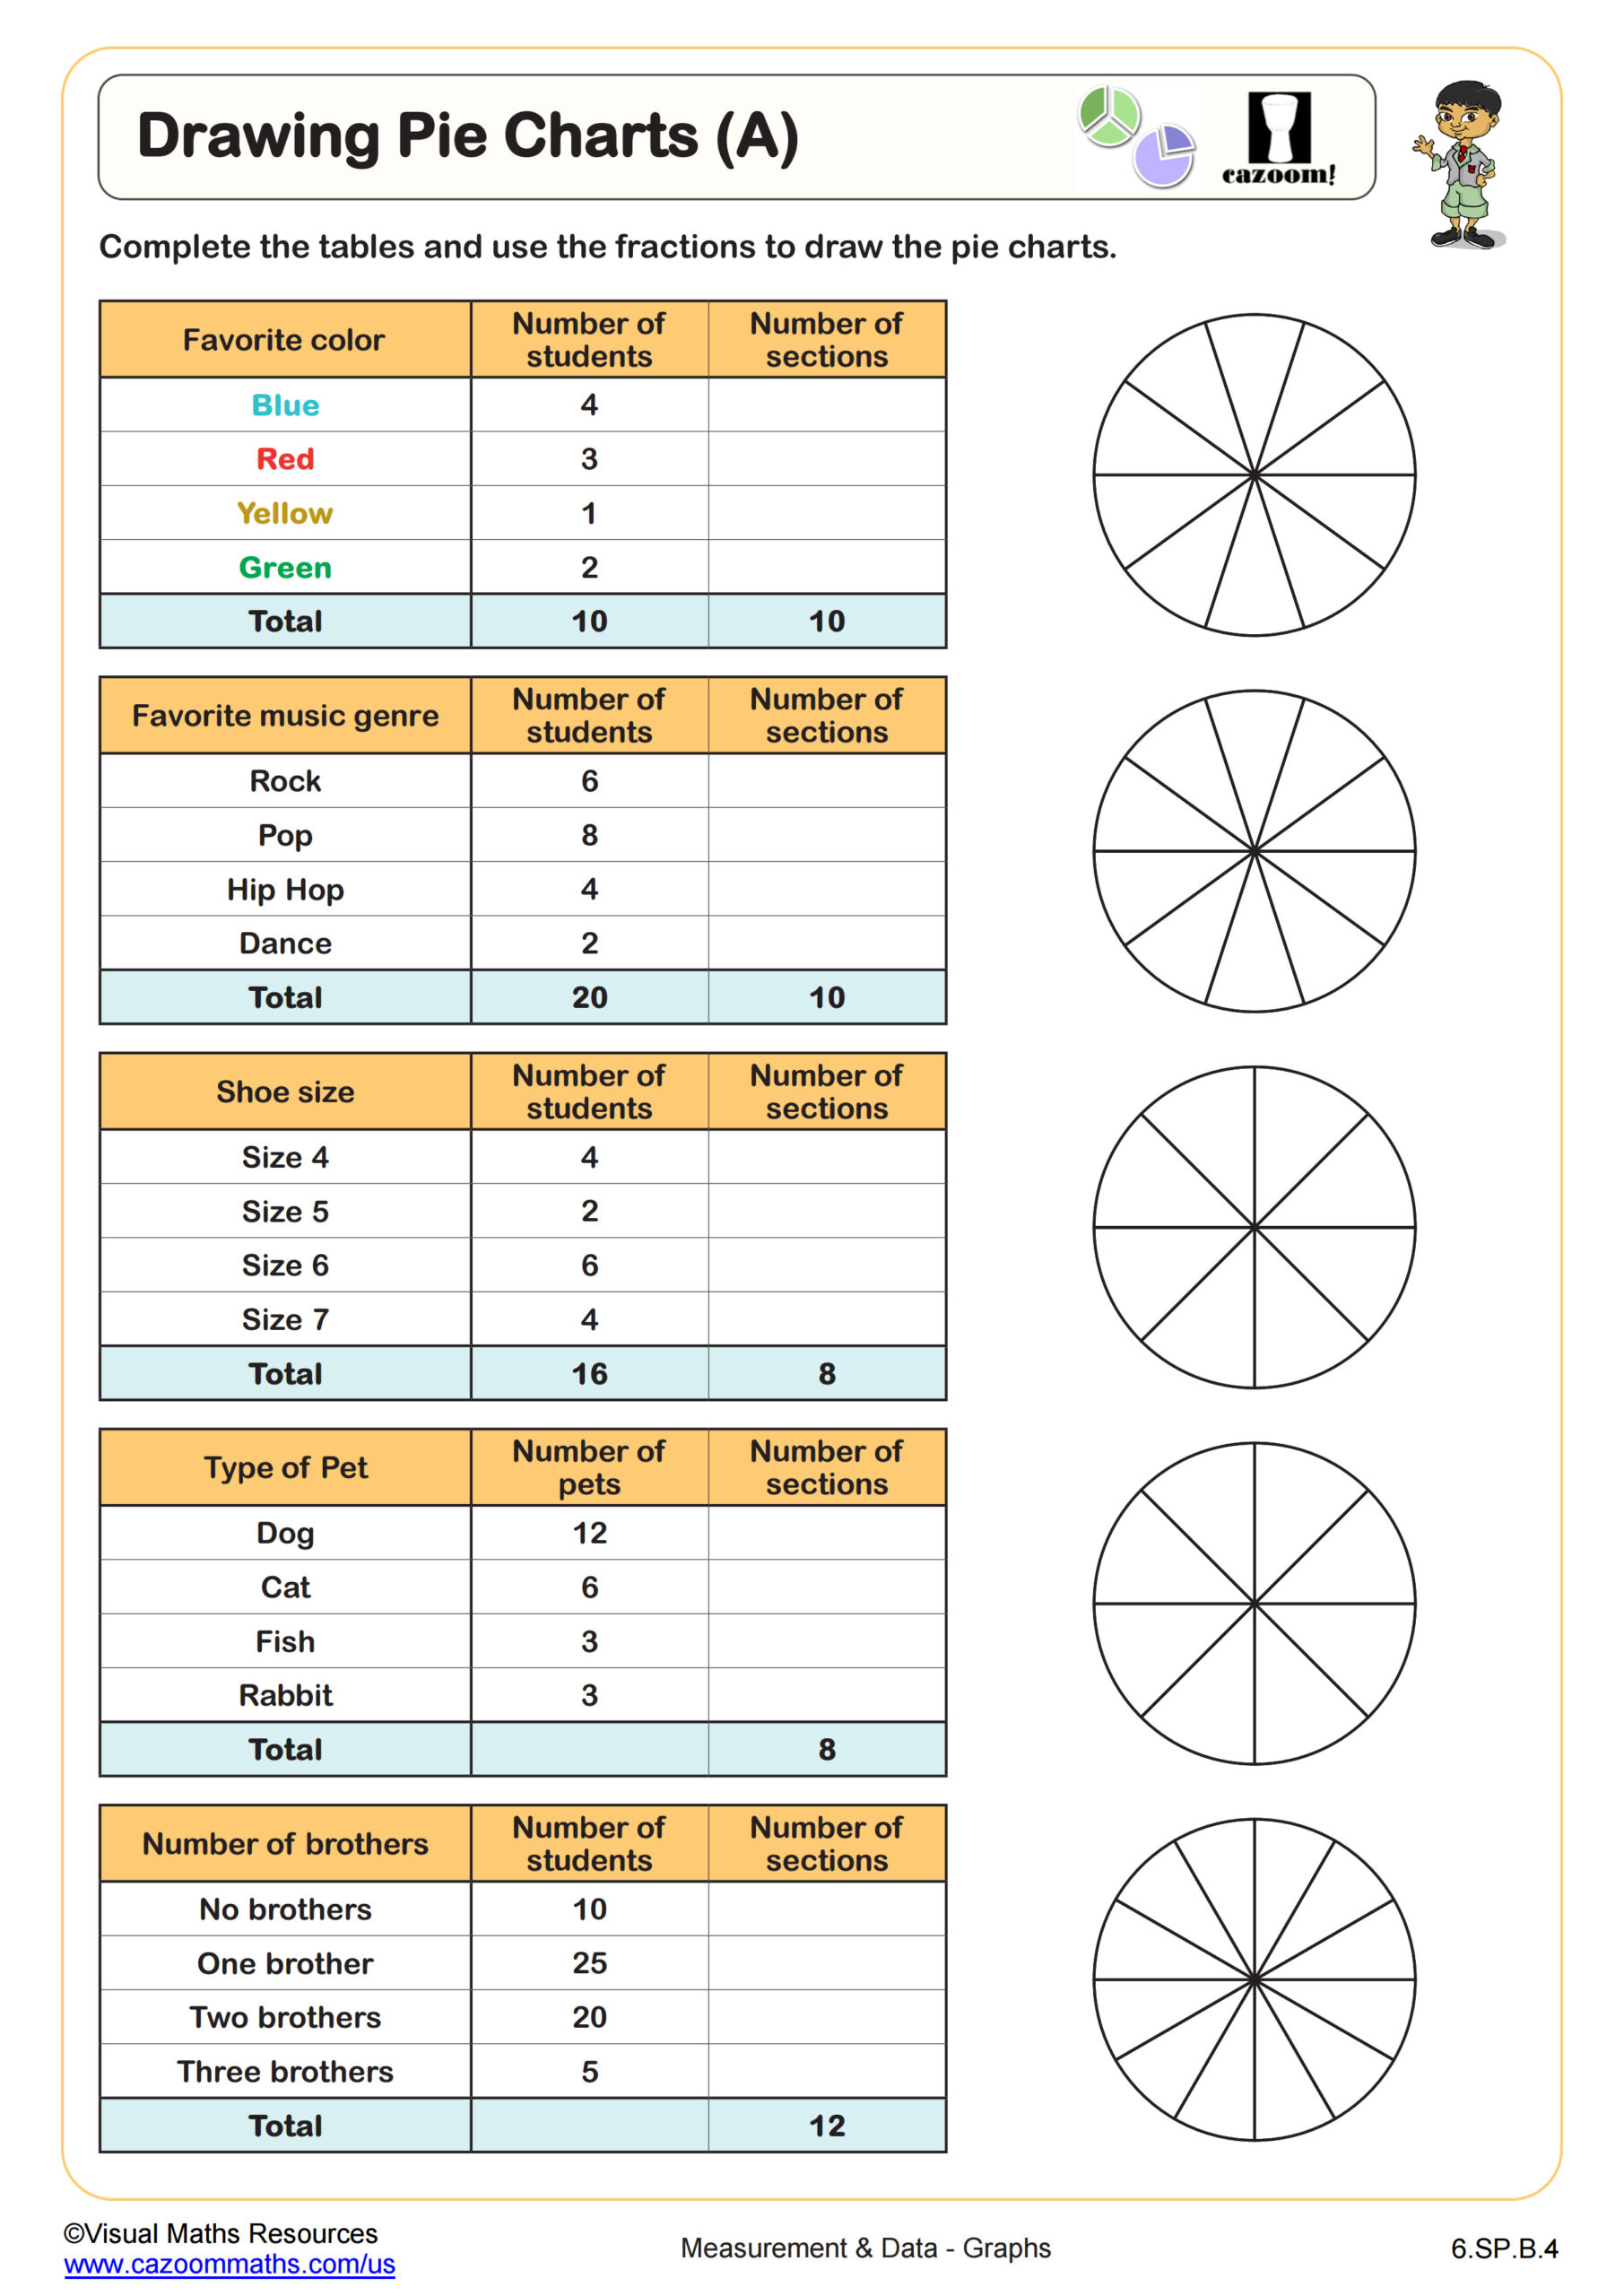
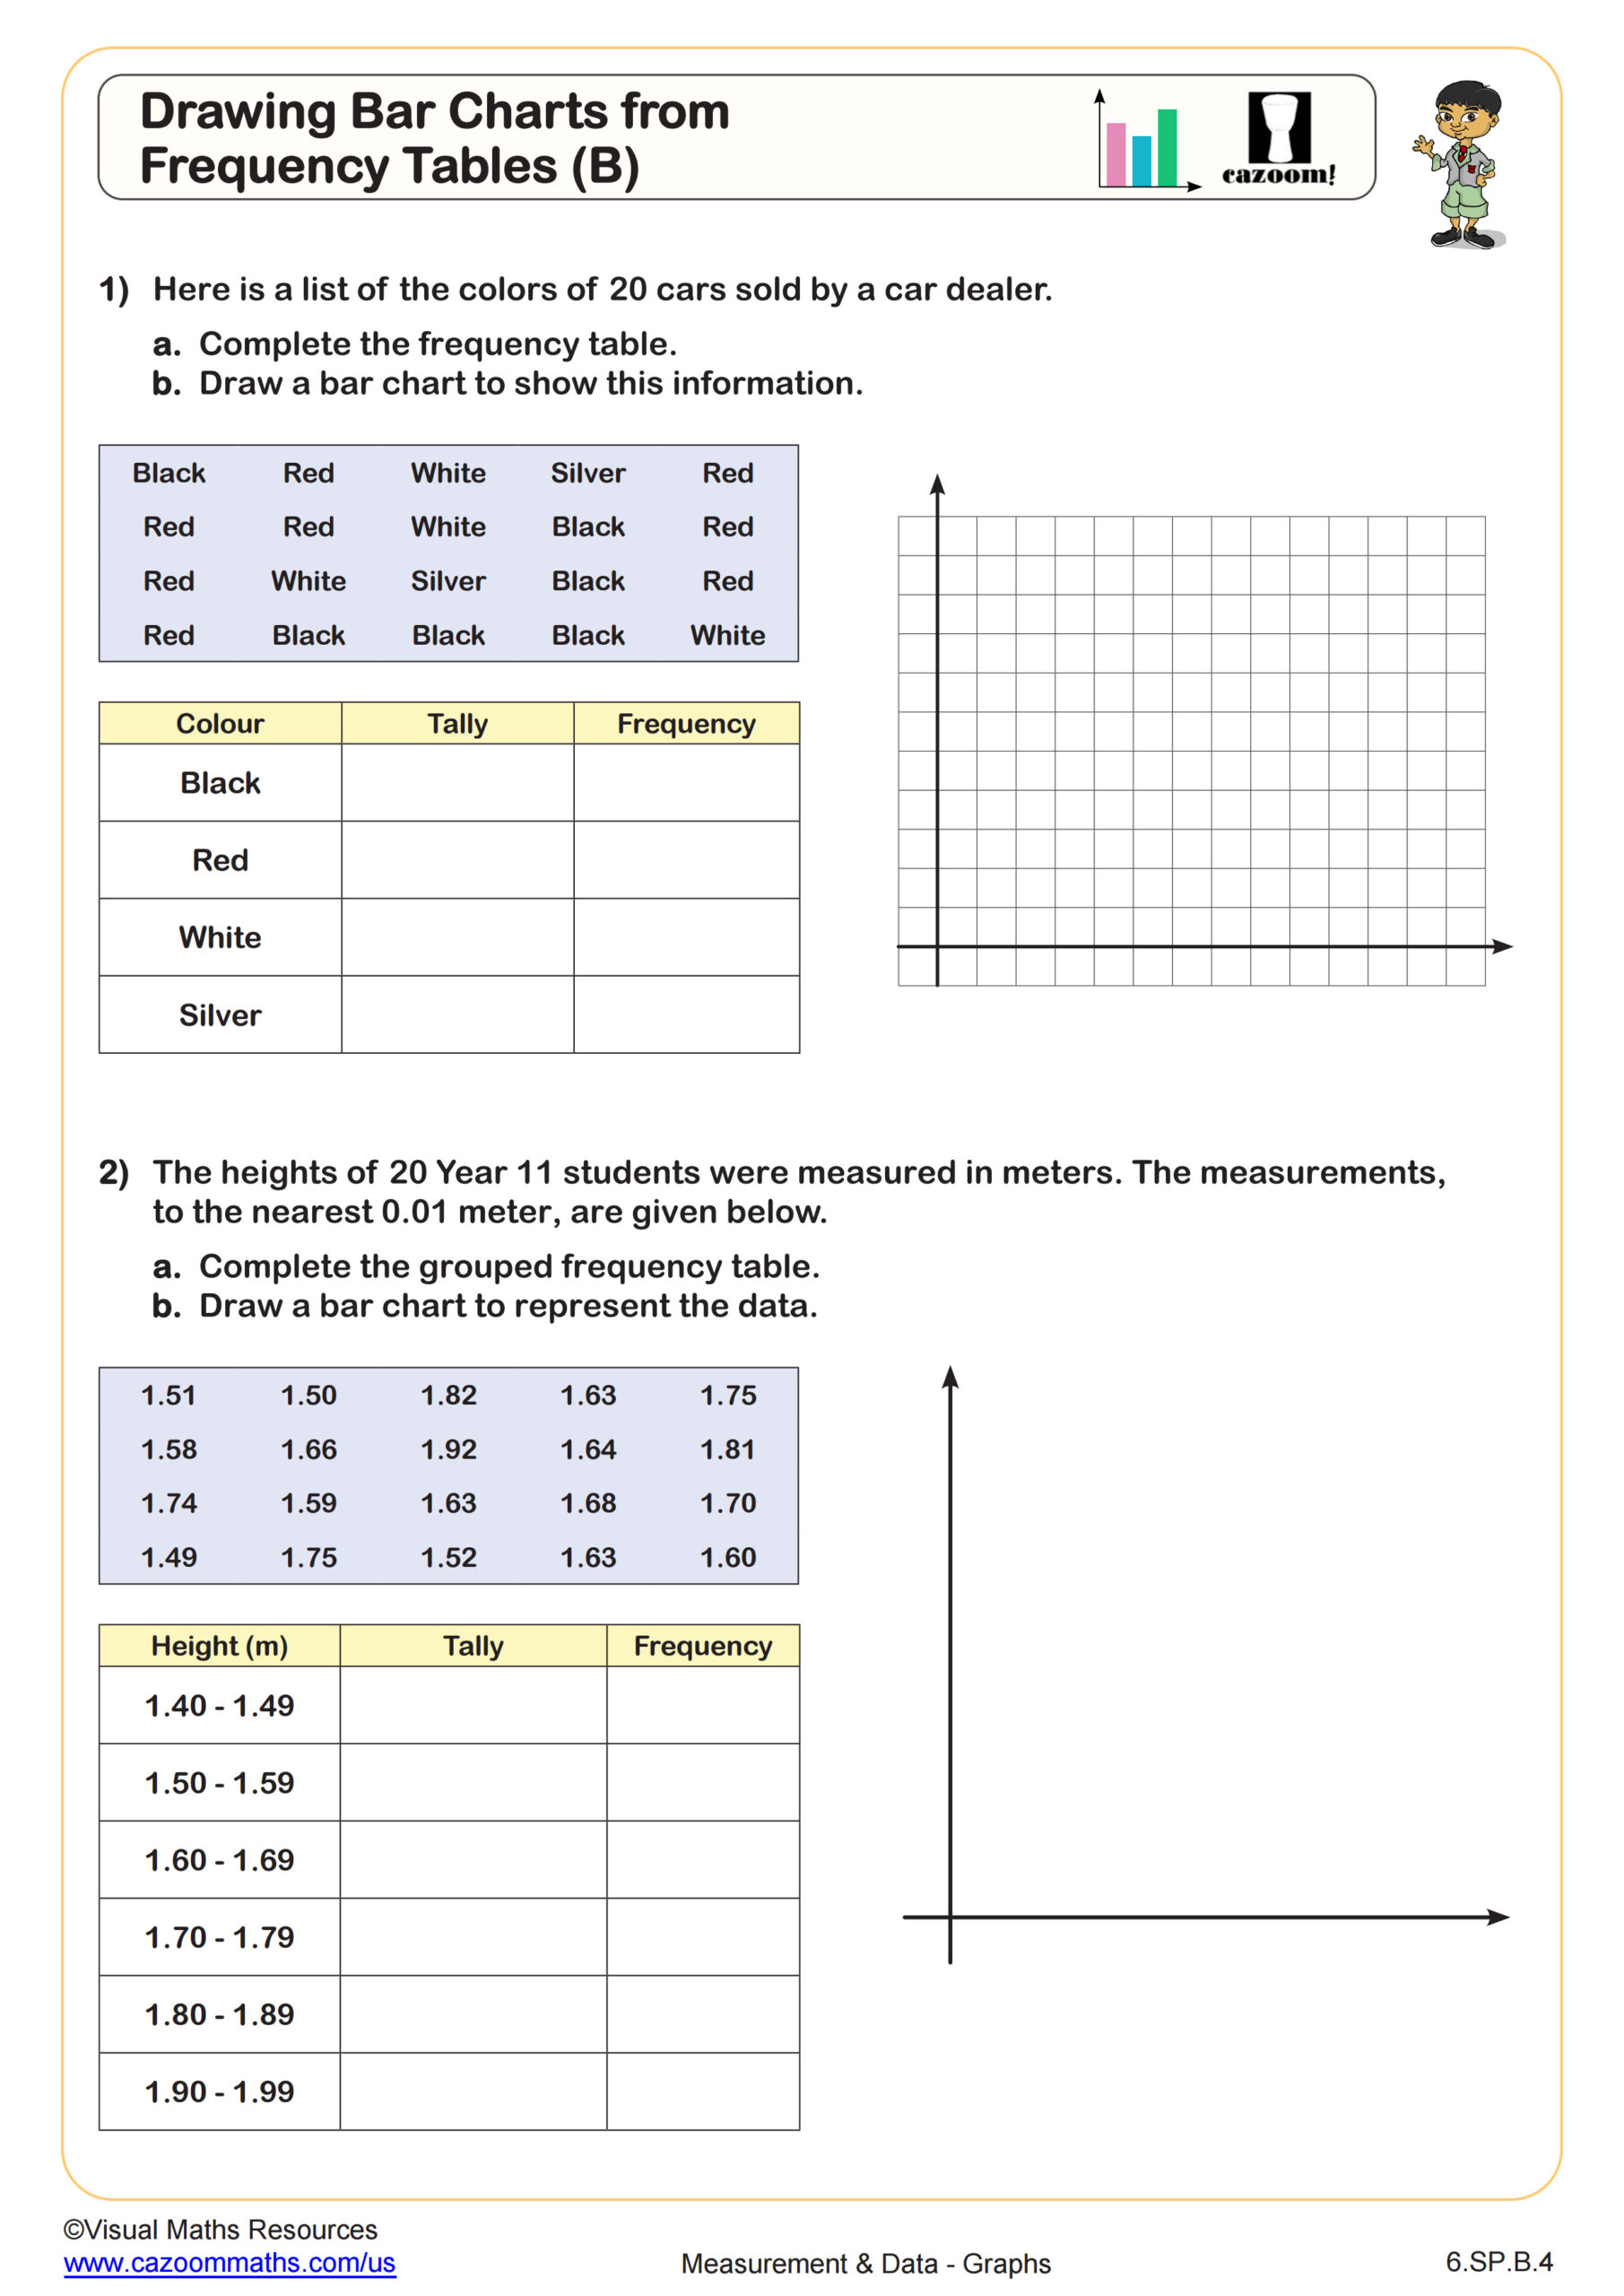
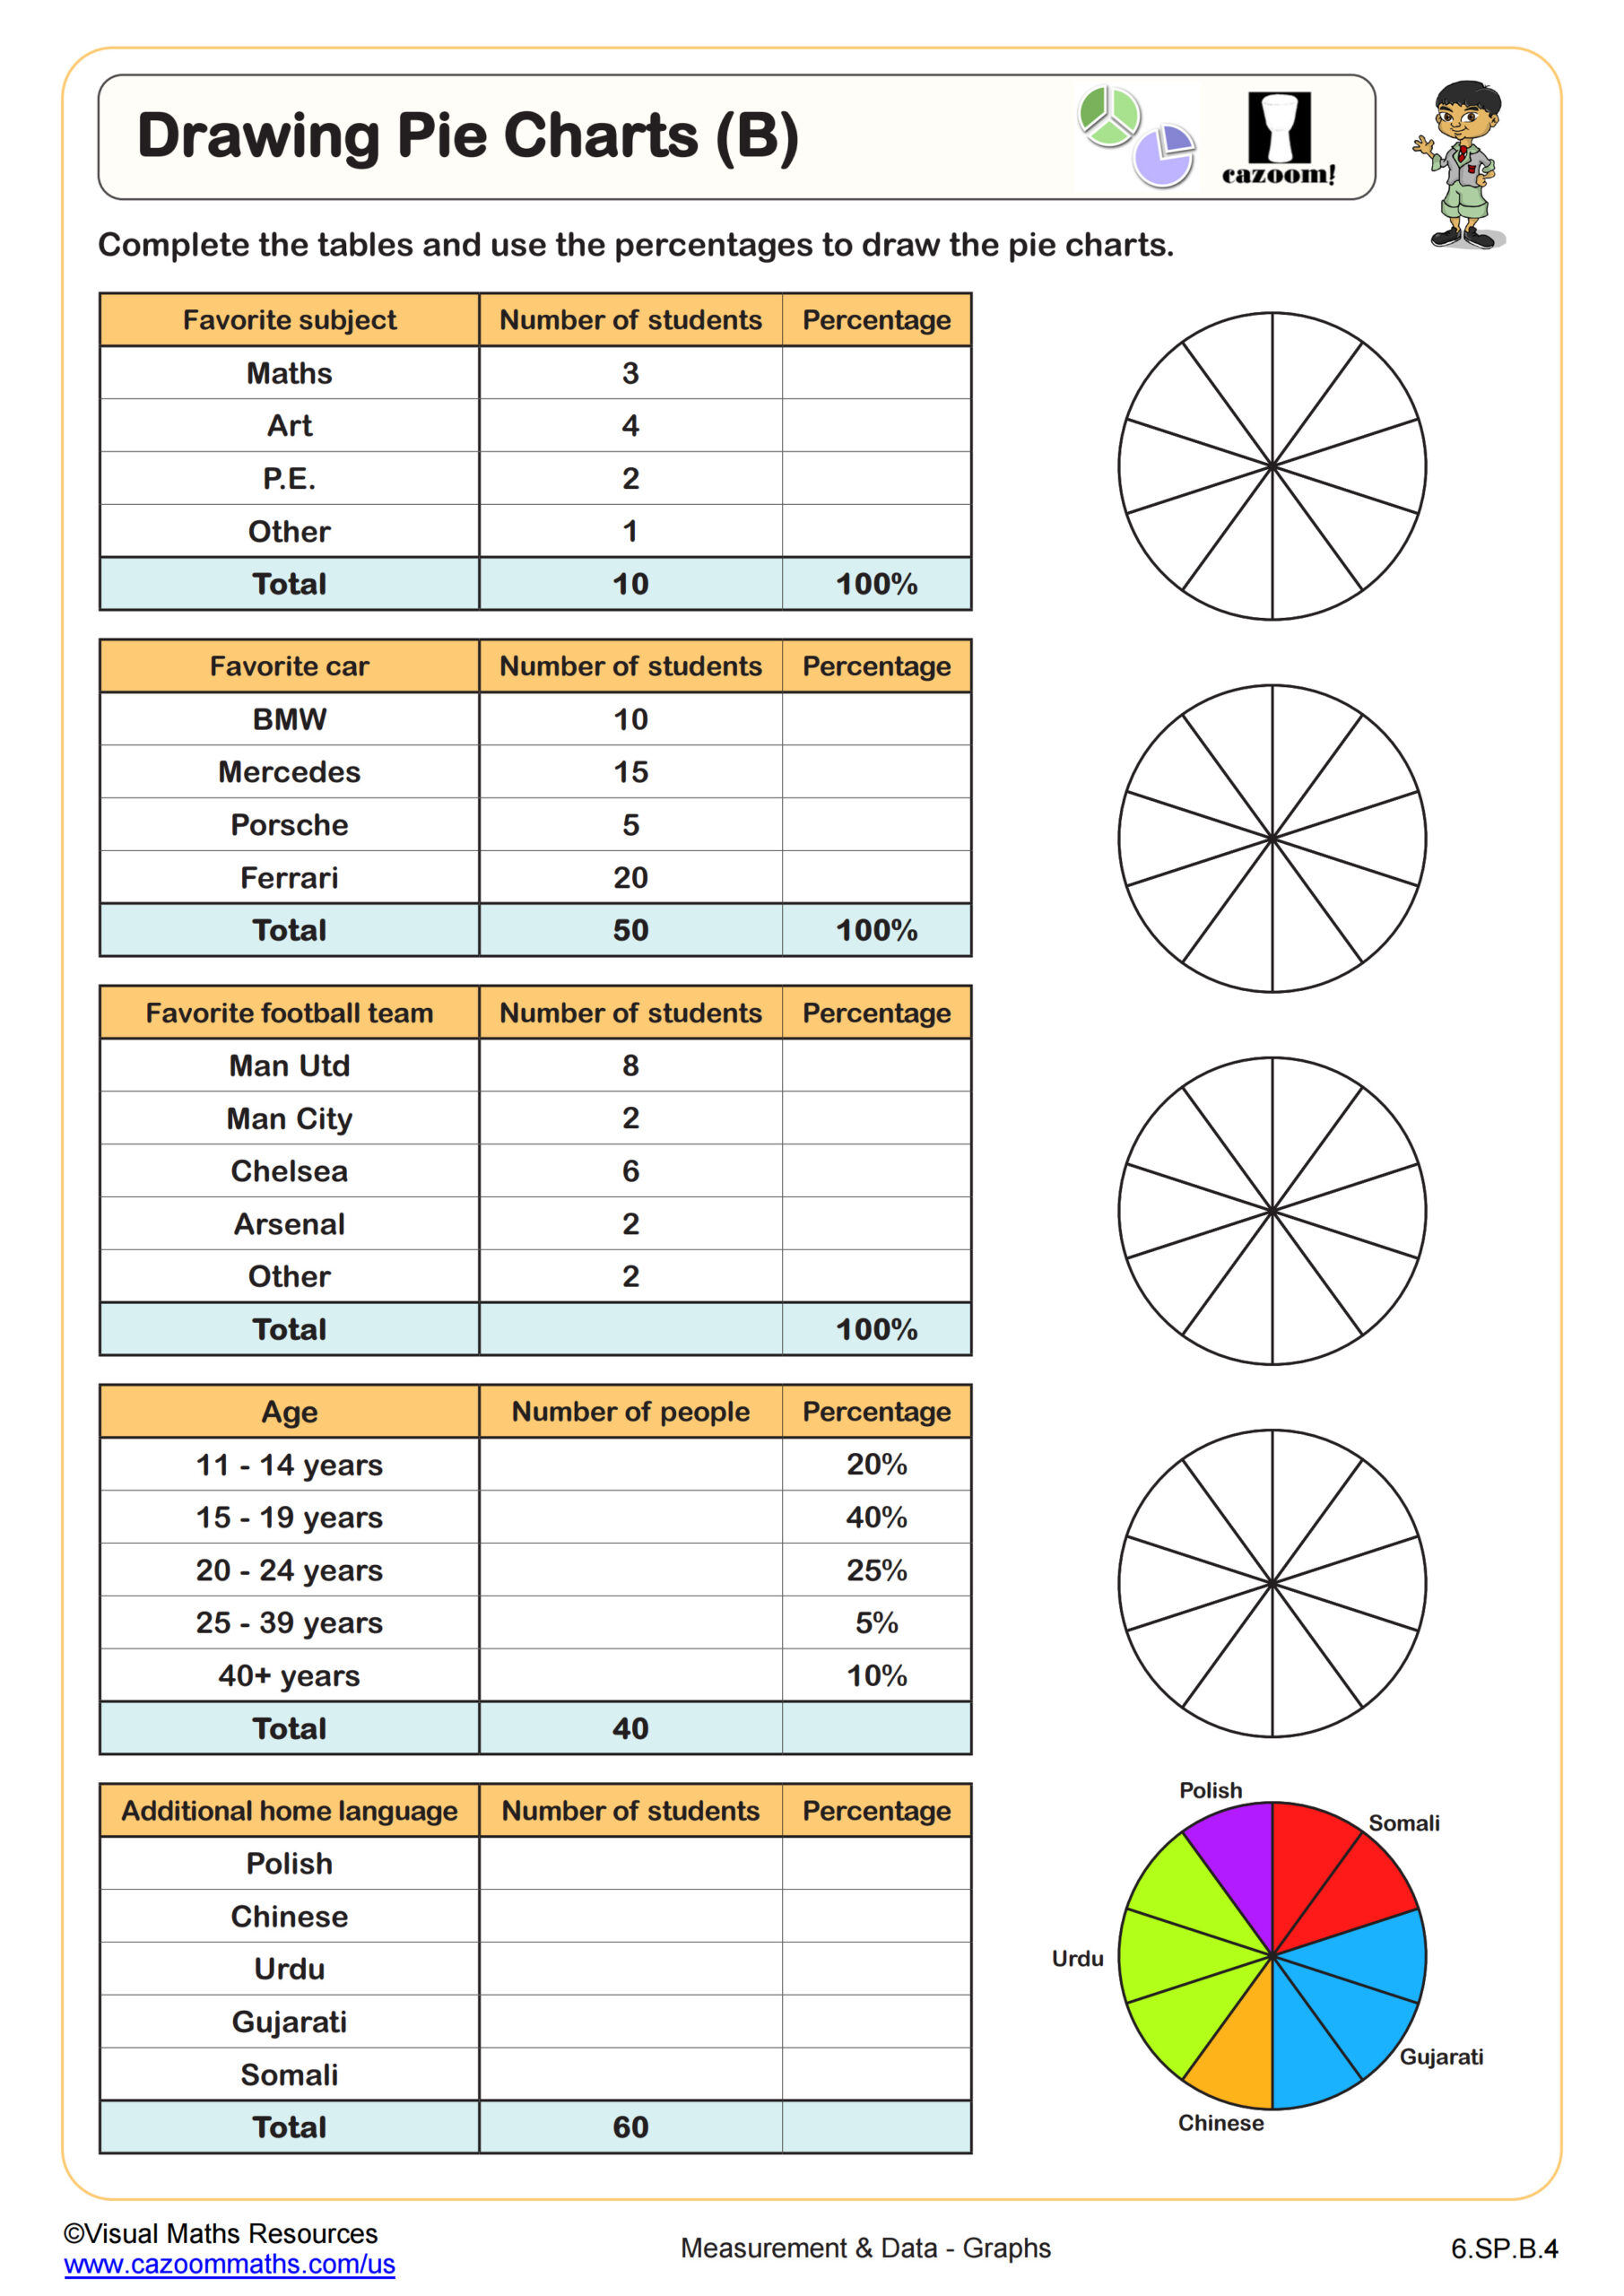
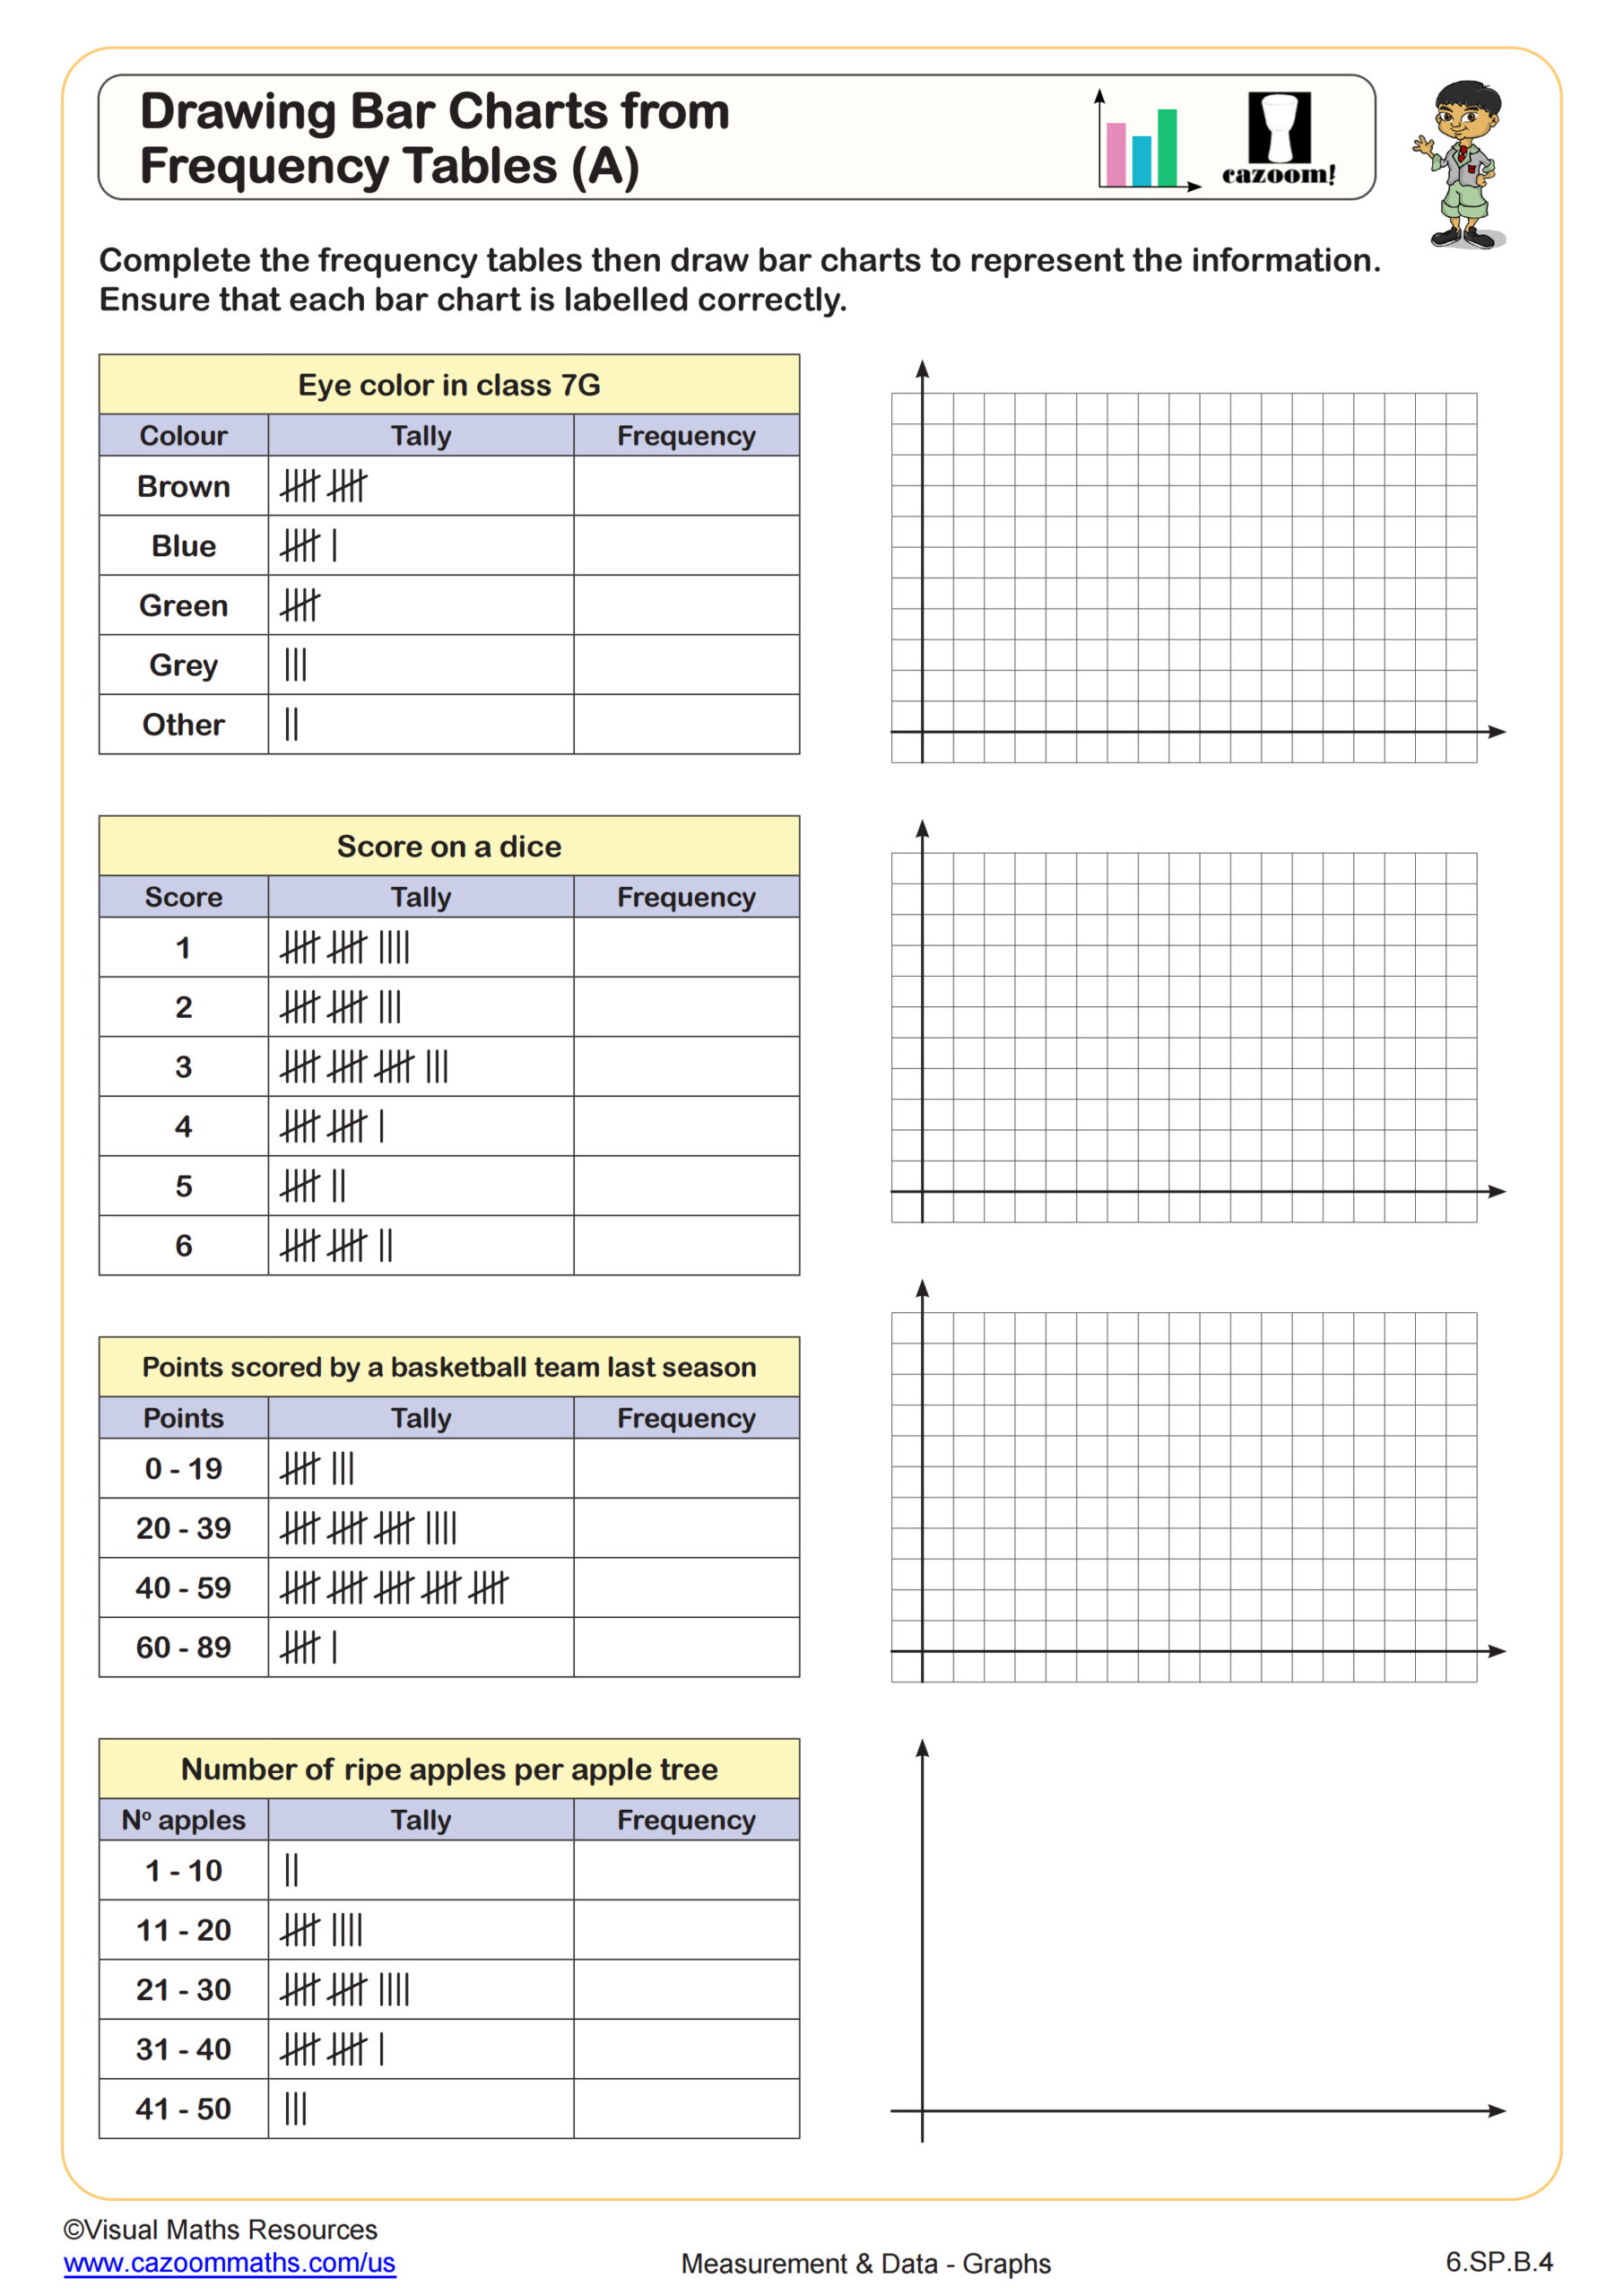
This worksheet can be used as a great discussion starter. Once learners have experienced pie charts, bar charts, line graphs, two-way tables, pictograms, scatter plots, and venn diagrams, this worksheet will help them think about what the best chart or diagram is to use for different situations.
All worksheets are created by the team of experienced teachers at Cazoom Math.

RELATED TO Choosing the Best Graphical Representation of Data WORKSHEET
Frequently Asked Questions
This worksheet is designed for Algebra I students who have already been introduced to various data visualization methods. It builds on their foundational knowledge of different chart types to develop critical thinking skills about data representation. The focus is on analytical reasoning rather than just creating graphs.