Back to:
Correlation and Causation WORKSHEET
Suitable for Grades: 8th Grade, IM 1
CCSS: 8.SP.A.1, HSS.ID.C.9
CCSS Description: Construct and interpret scatter plots for bivariate measurement data to investigate patterns of association between two quantities. Describe patterns such as clustering, outliers, positive or negative association, linear association, and nonlinear association.
Distinguish between correlation and causation.
Distinguish between correlation and causation.
Correlation and Causation WORKSHEET DESCRIPTION
This worksheet supports students in understanding the distinction between correlation and causation through a series of structured tasks.
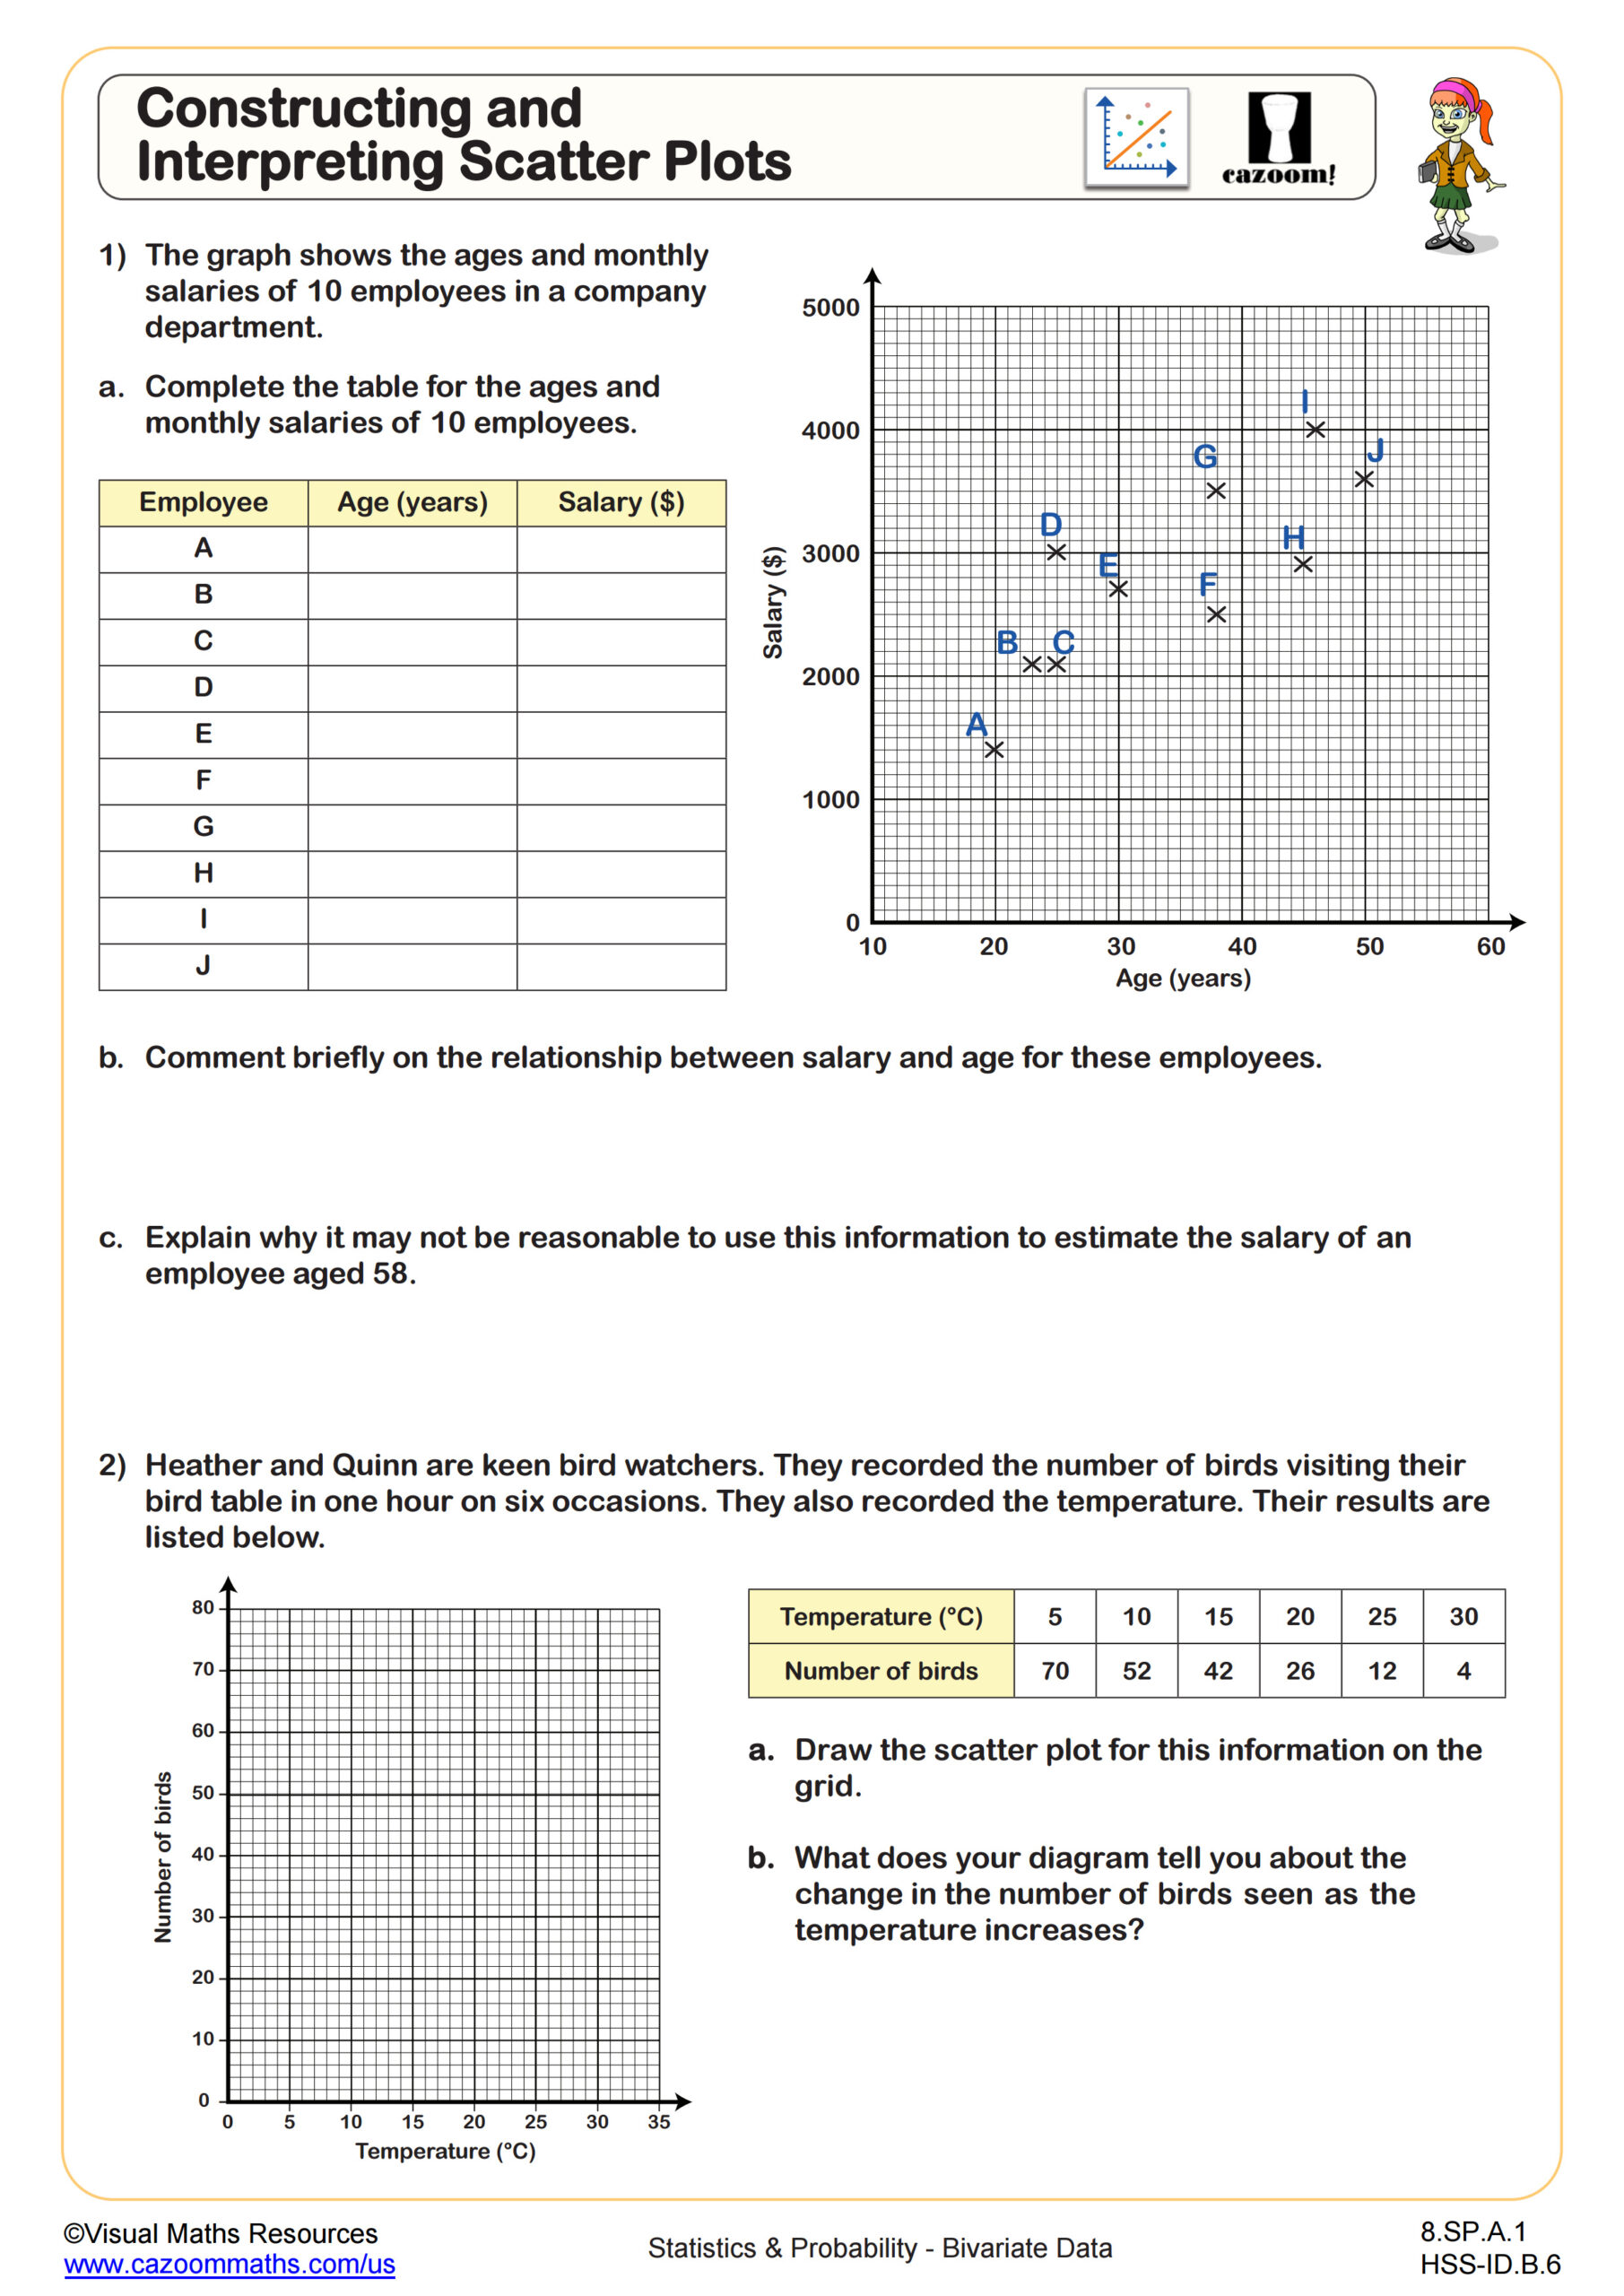
In Section A, students interpret scatter graphs showing relationships such as age versus salary and time spent studying versus test scores. For each graph, they identify the type of correlation and evaluate whether a causal link is present, helping to develop their critical thinking and data analysis skills.
Section B features further real-life examples—including graphs for car speed versus fuel efficiency and sunglasses sold versus sunburn cases—where students assess whether one variable causes changes in another or if the link is coincidental.
All worksheets are created by the team of experienced teachers at Cazoom Math.

RELATED TO Correlation and Causation WORKSHEET
Frequently Asked Questions
This worksheet is designed for 8th grade students and those taking Integrated Math 1 (IM 1). At these levels, students are ready to analyze data relationships critically and distinguish between variables that are simply related versus those where one actually influences the other. The real-world scenarios help make these statistical concepts more accessible and meaningful for middle and early high school learners.