Criticising Graphs and Charts WORKSHEET
Construct and interpret scatter plots for bivariate measurement data to investigate patterns of association between two quantities. Describe patterns such as clustering, outliers, positive or negative association, linear association, and nonlinear association.
Criticising Graphs and Charts WORKSHEET DESCRIPTION
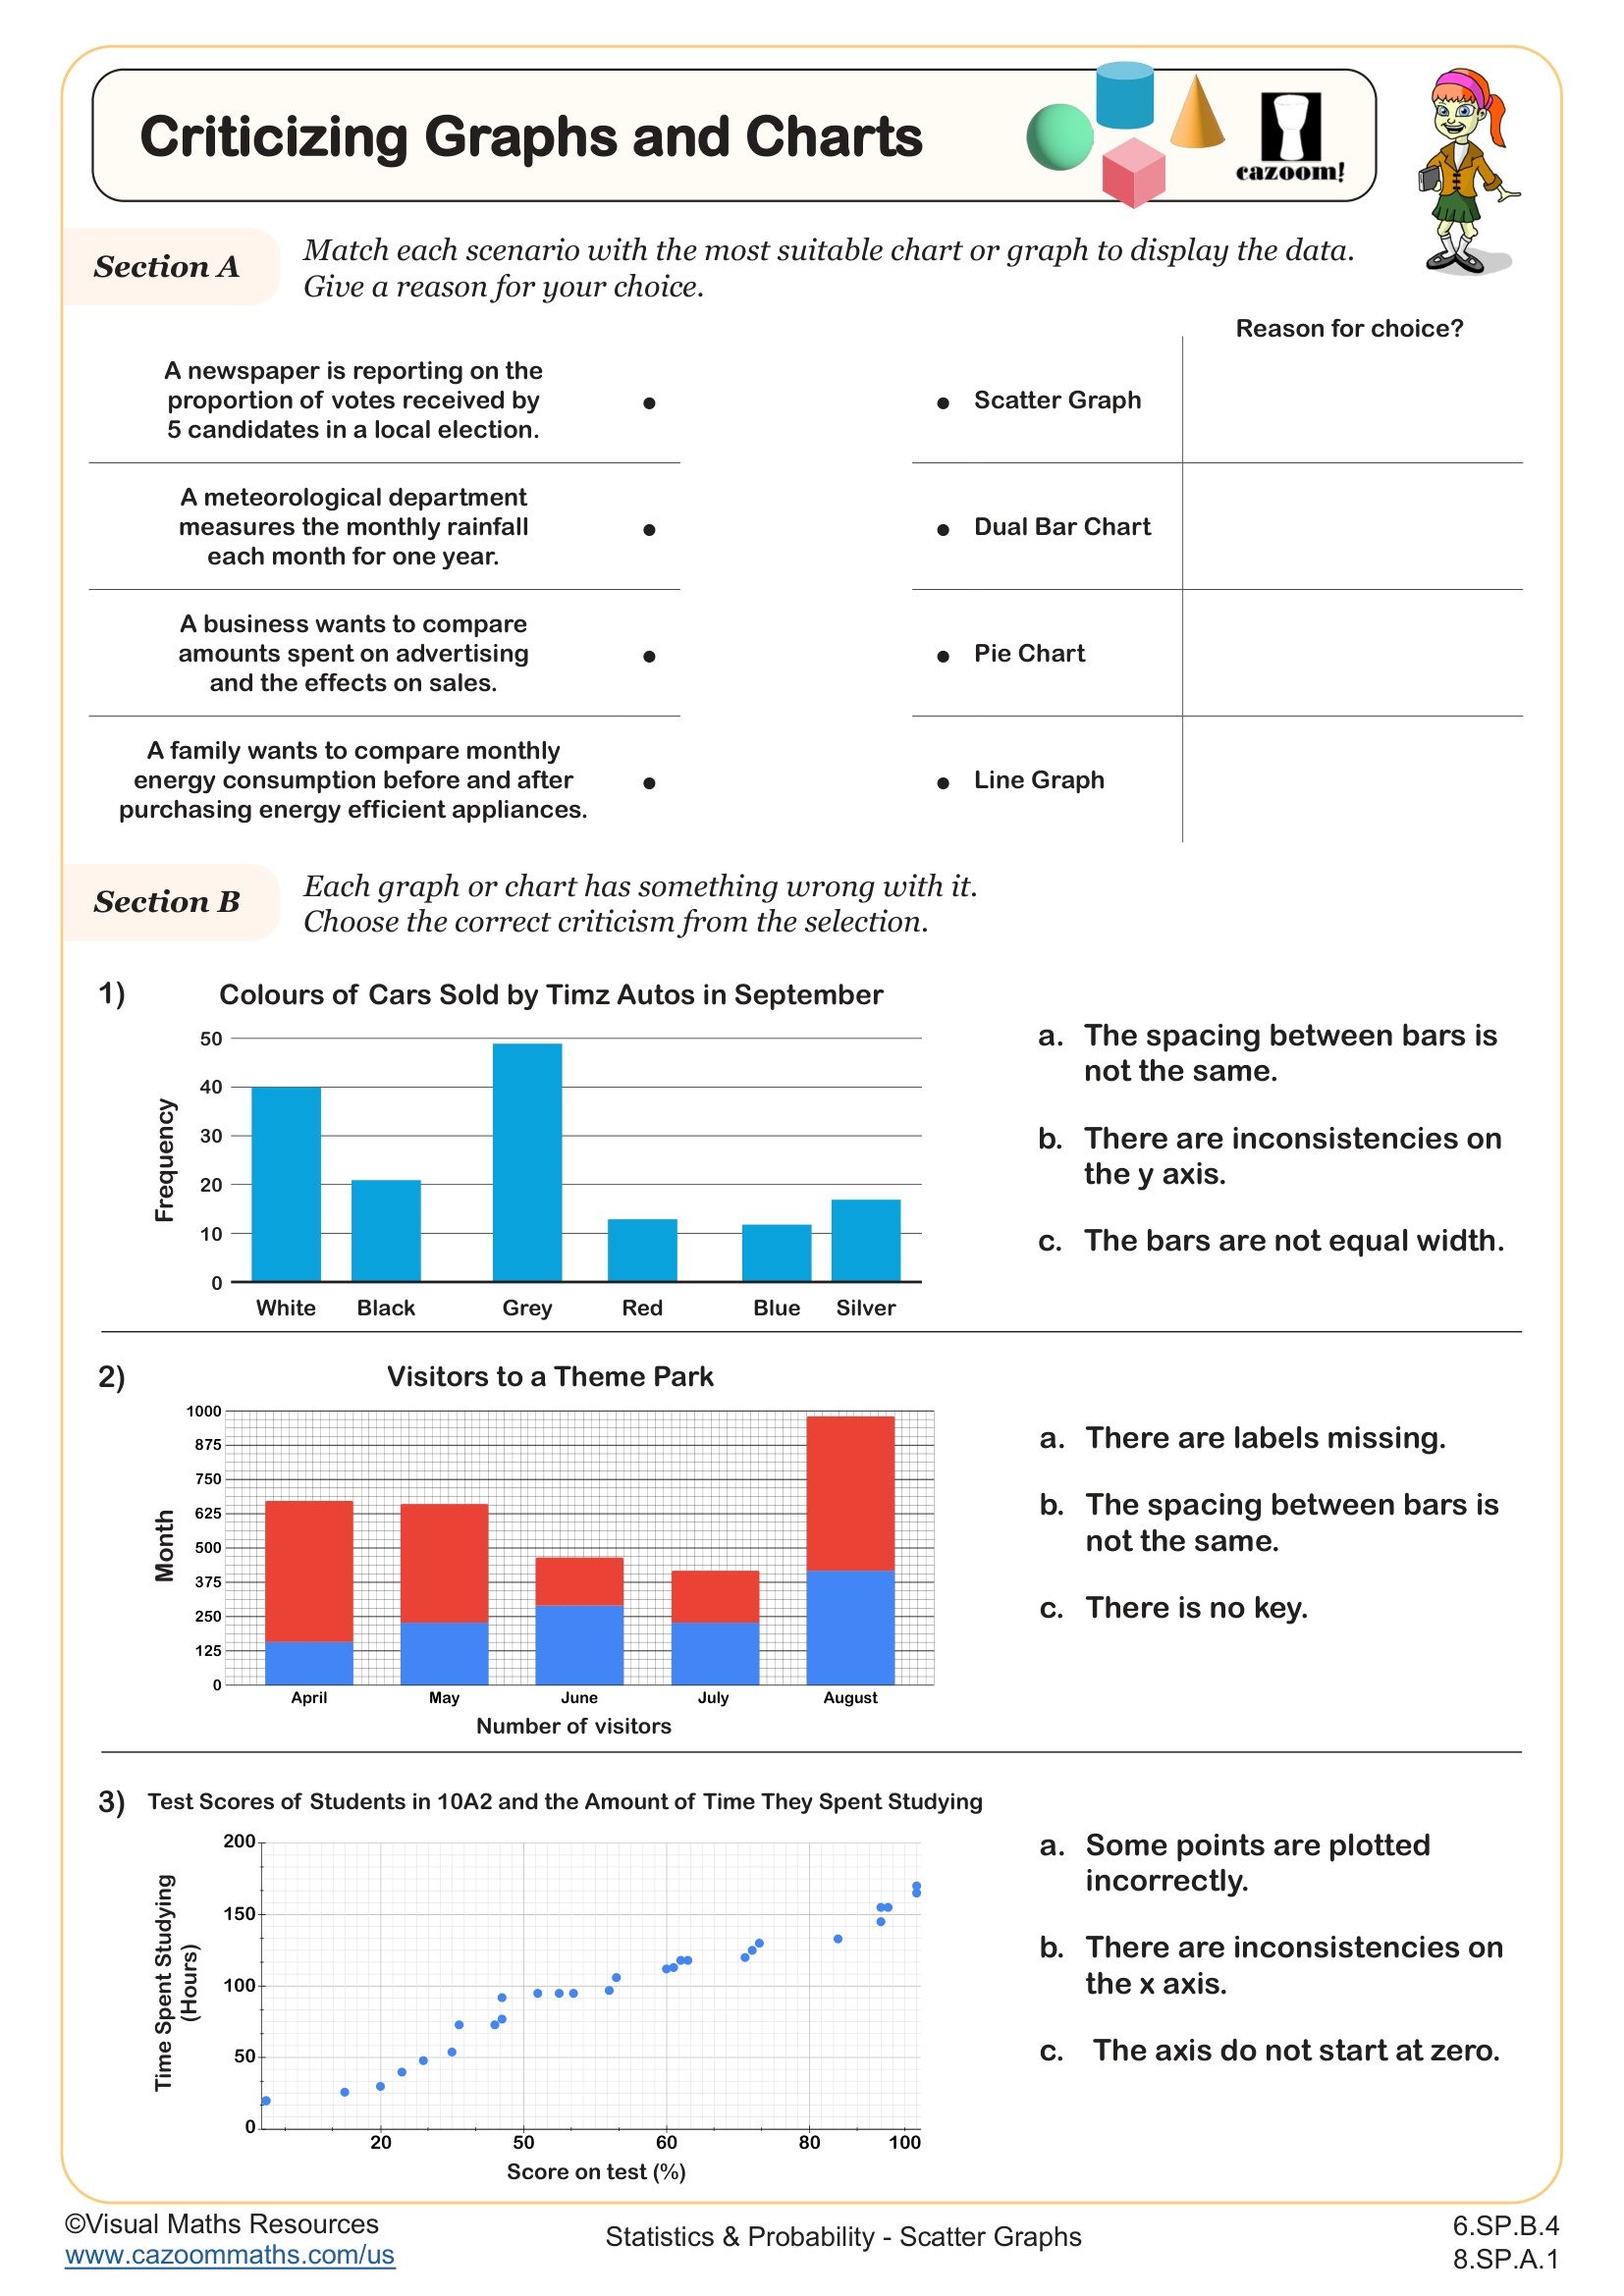
This worksheet will help students develop their skills in identifying errors in graphs and charts.
In Section A, students will match various scenarios with the most appropriate type of chart or graph to display the data, providing reasons for their choices.
In Section B, learners will examine three different charts and select from multiple choice options to identify one error in each chart. This section will introduce them to common mistakes in data display.
In Section C, having been exposed to typical errors, students will apply their knowledge to analyze and find errors in five additional data displays.
RELATED TO Criticising Graphs and Charts WORKSHEET
Frequently Asked Questions
This criticising graphs and charts worksheet is designed for students in 7th Grade and 8th Grade and aligns with Common Core State Standards.
