Cumulative Frequency Diagrams (B) WORKSHEET
Suitable for Grades: Algebra I
CCSS: HSS.ID.B.5
CCSS Description: Summarize categorical data for two categories in two-way frequency tables. Interpret relative frequencies in the context of the data (including joint, marginal, and conditional relative frequencies). Recognize possible associations and trends in the data.
Cumulative Frequency Diagrams (B) WORKSHEET DESCRIPTION
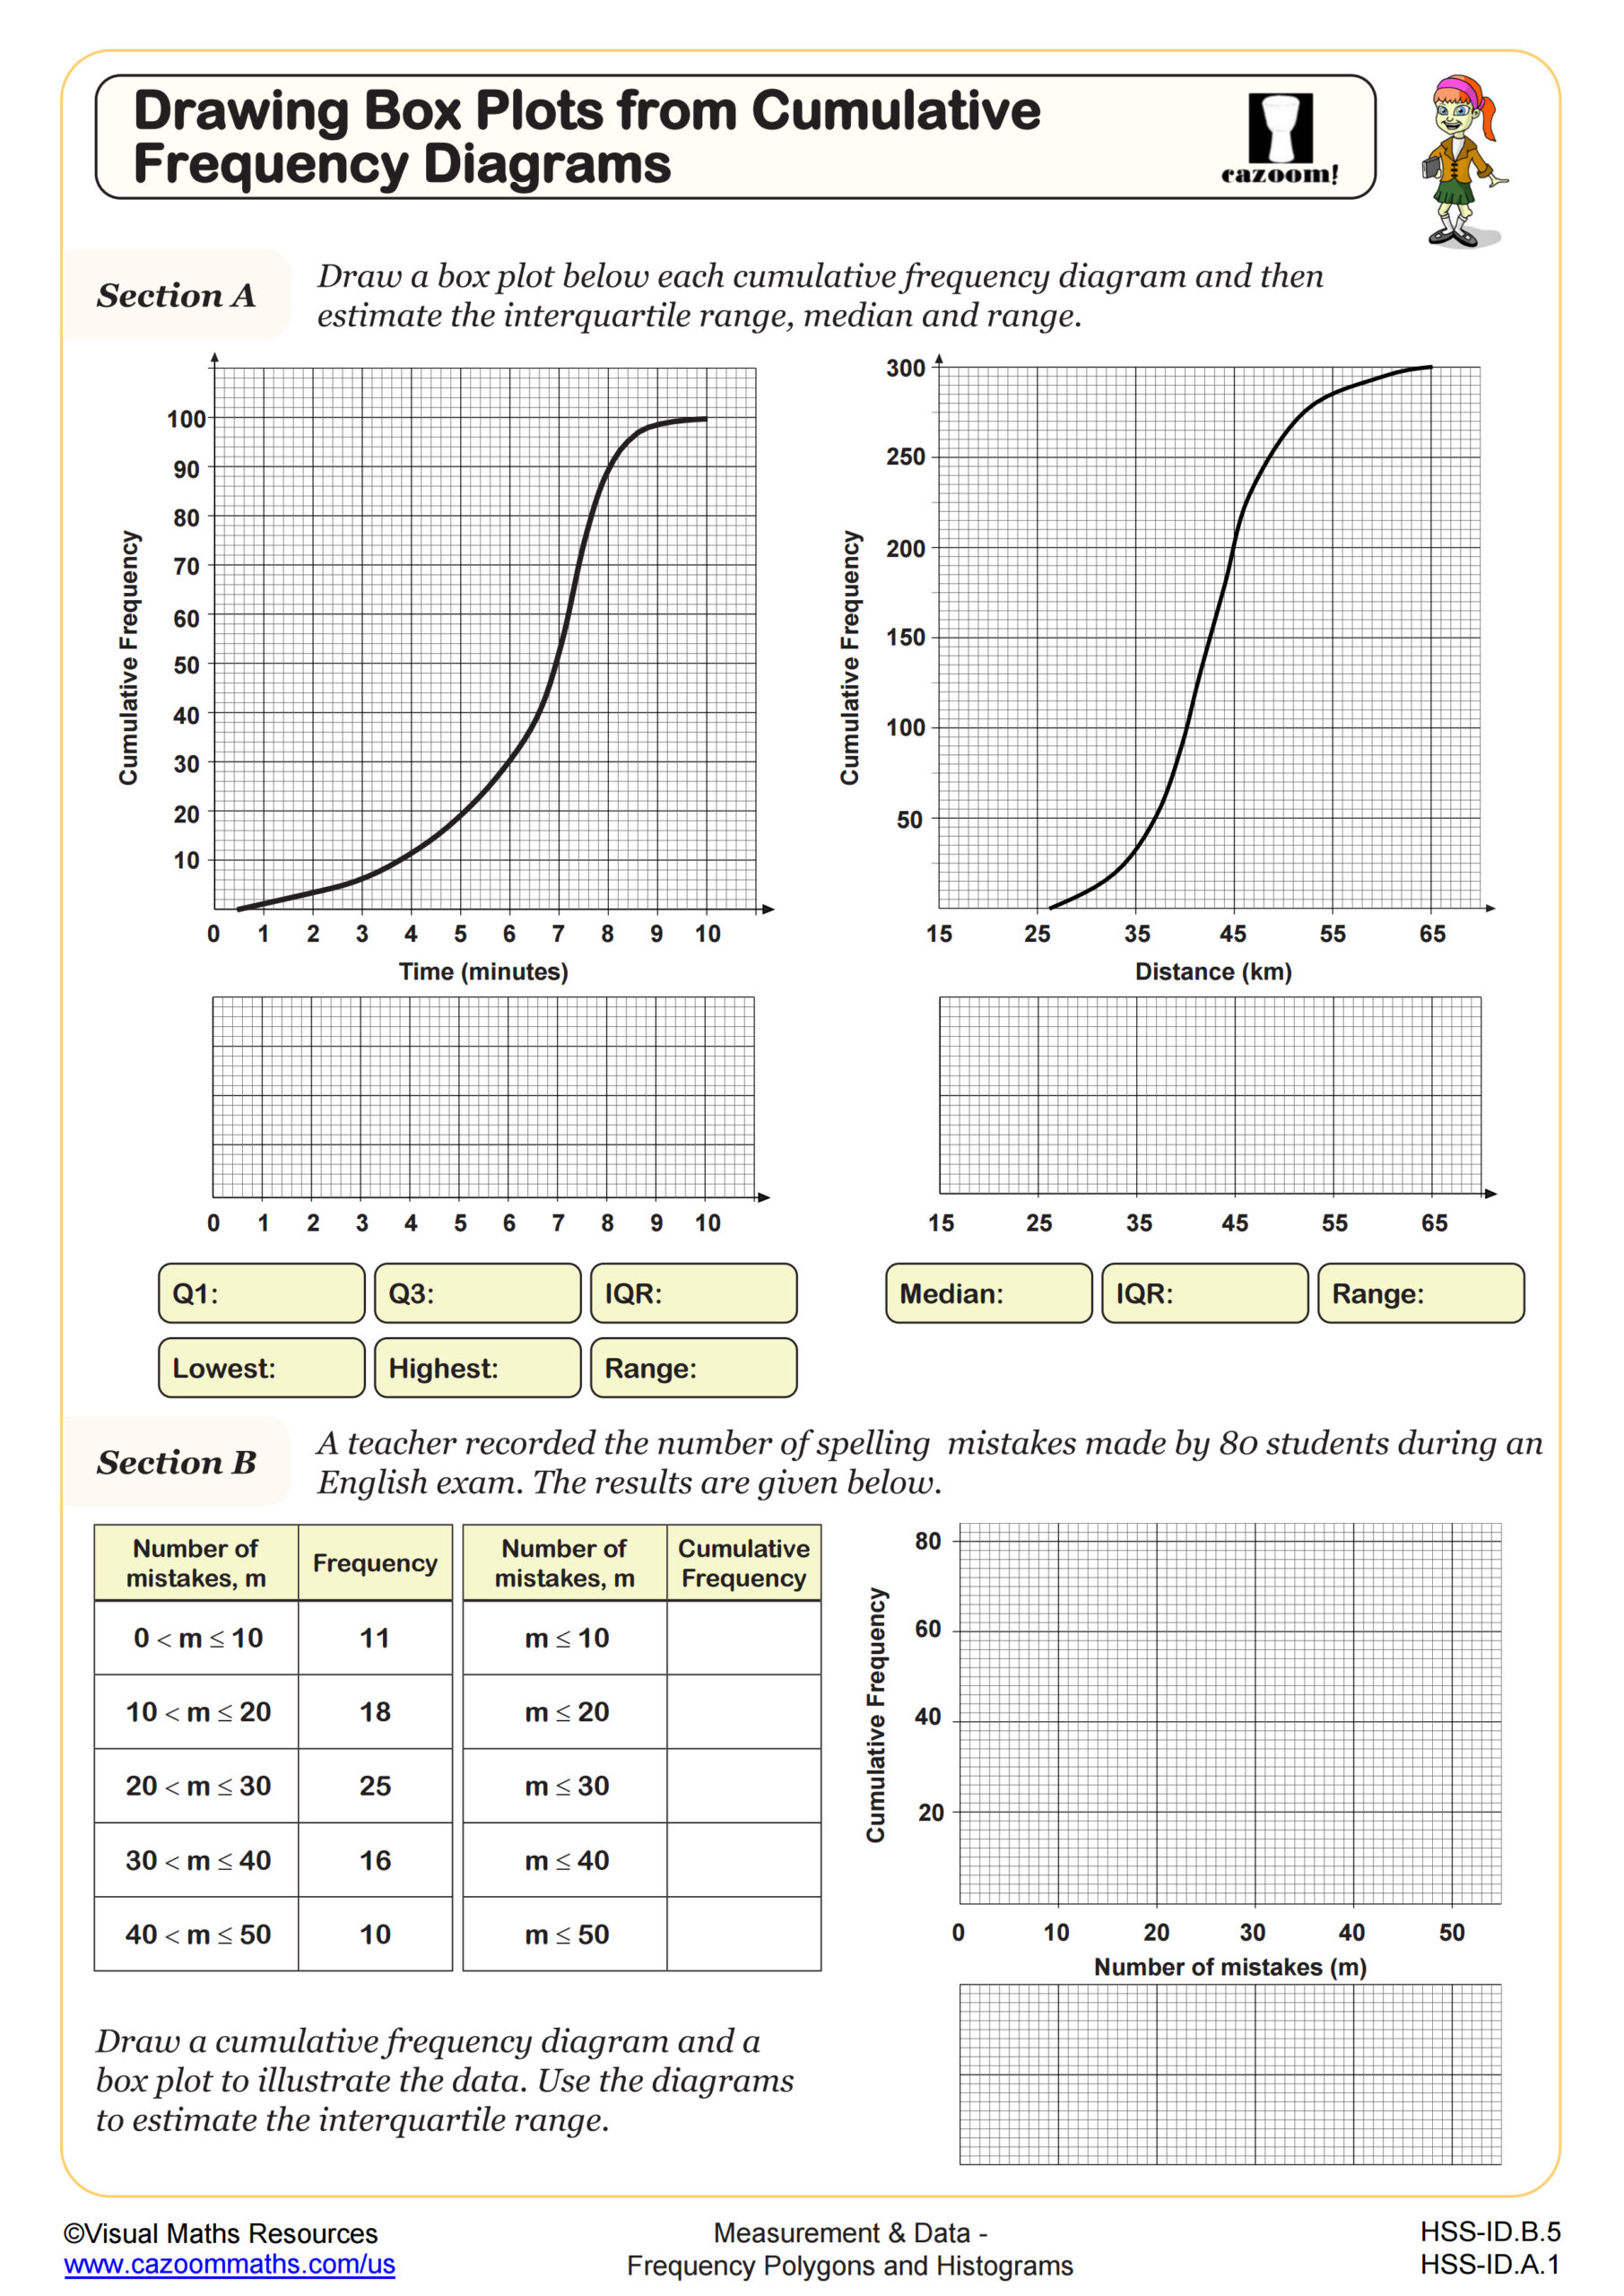
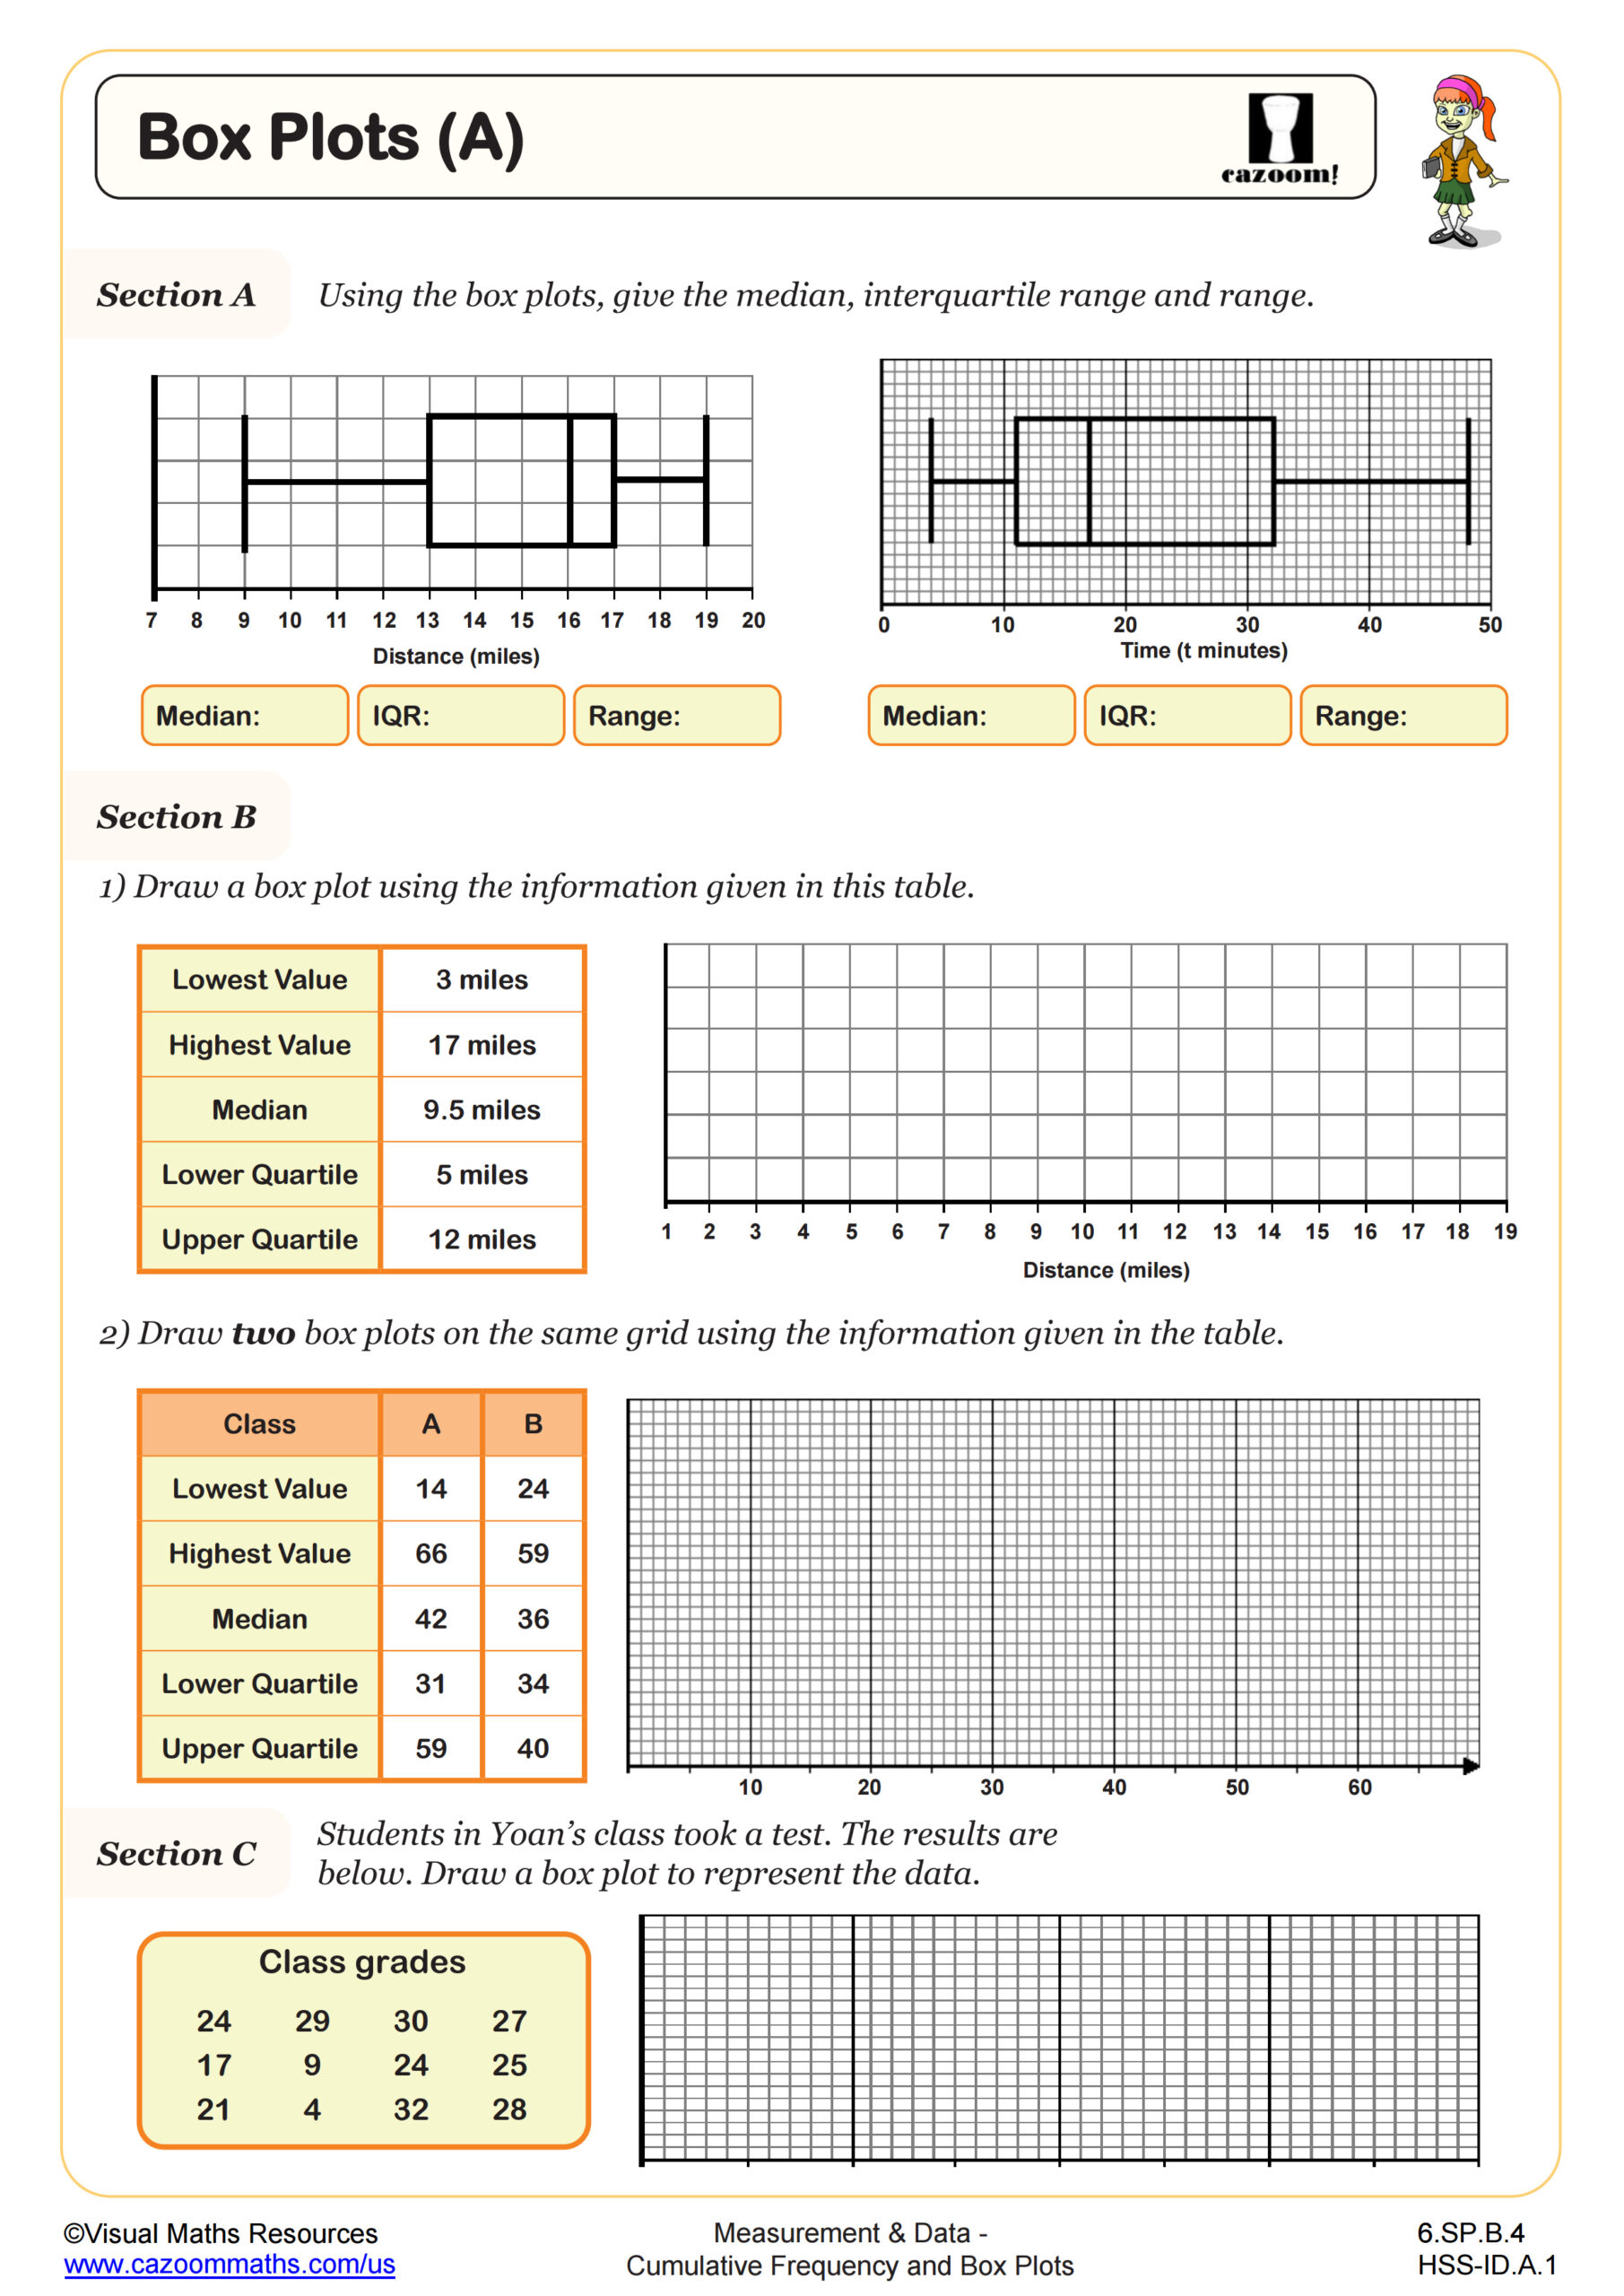
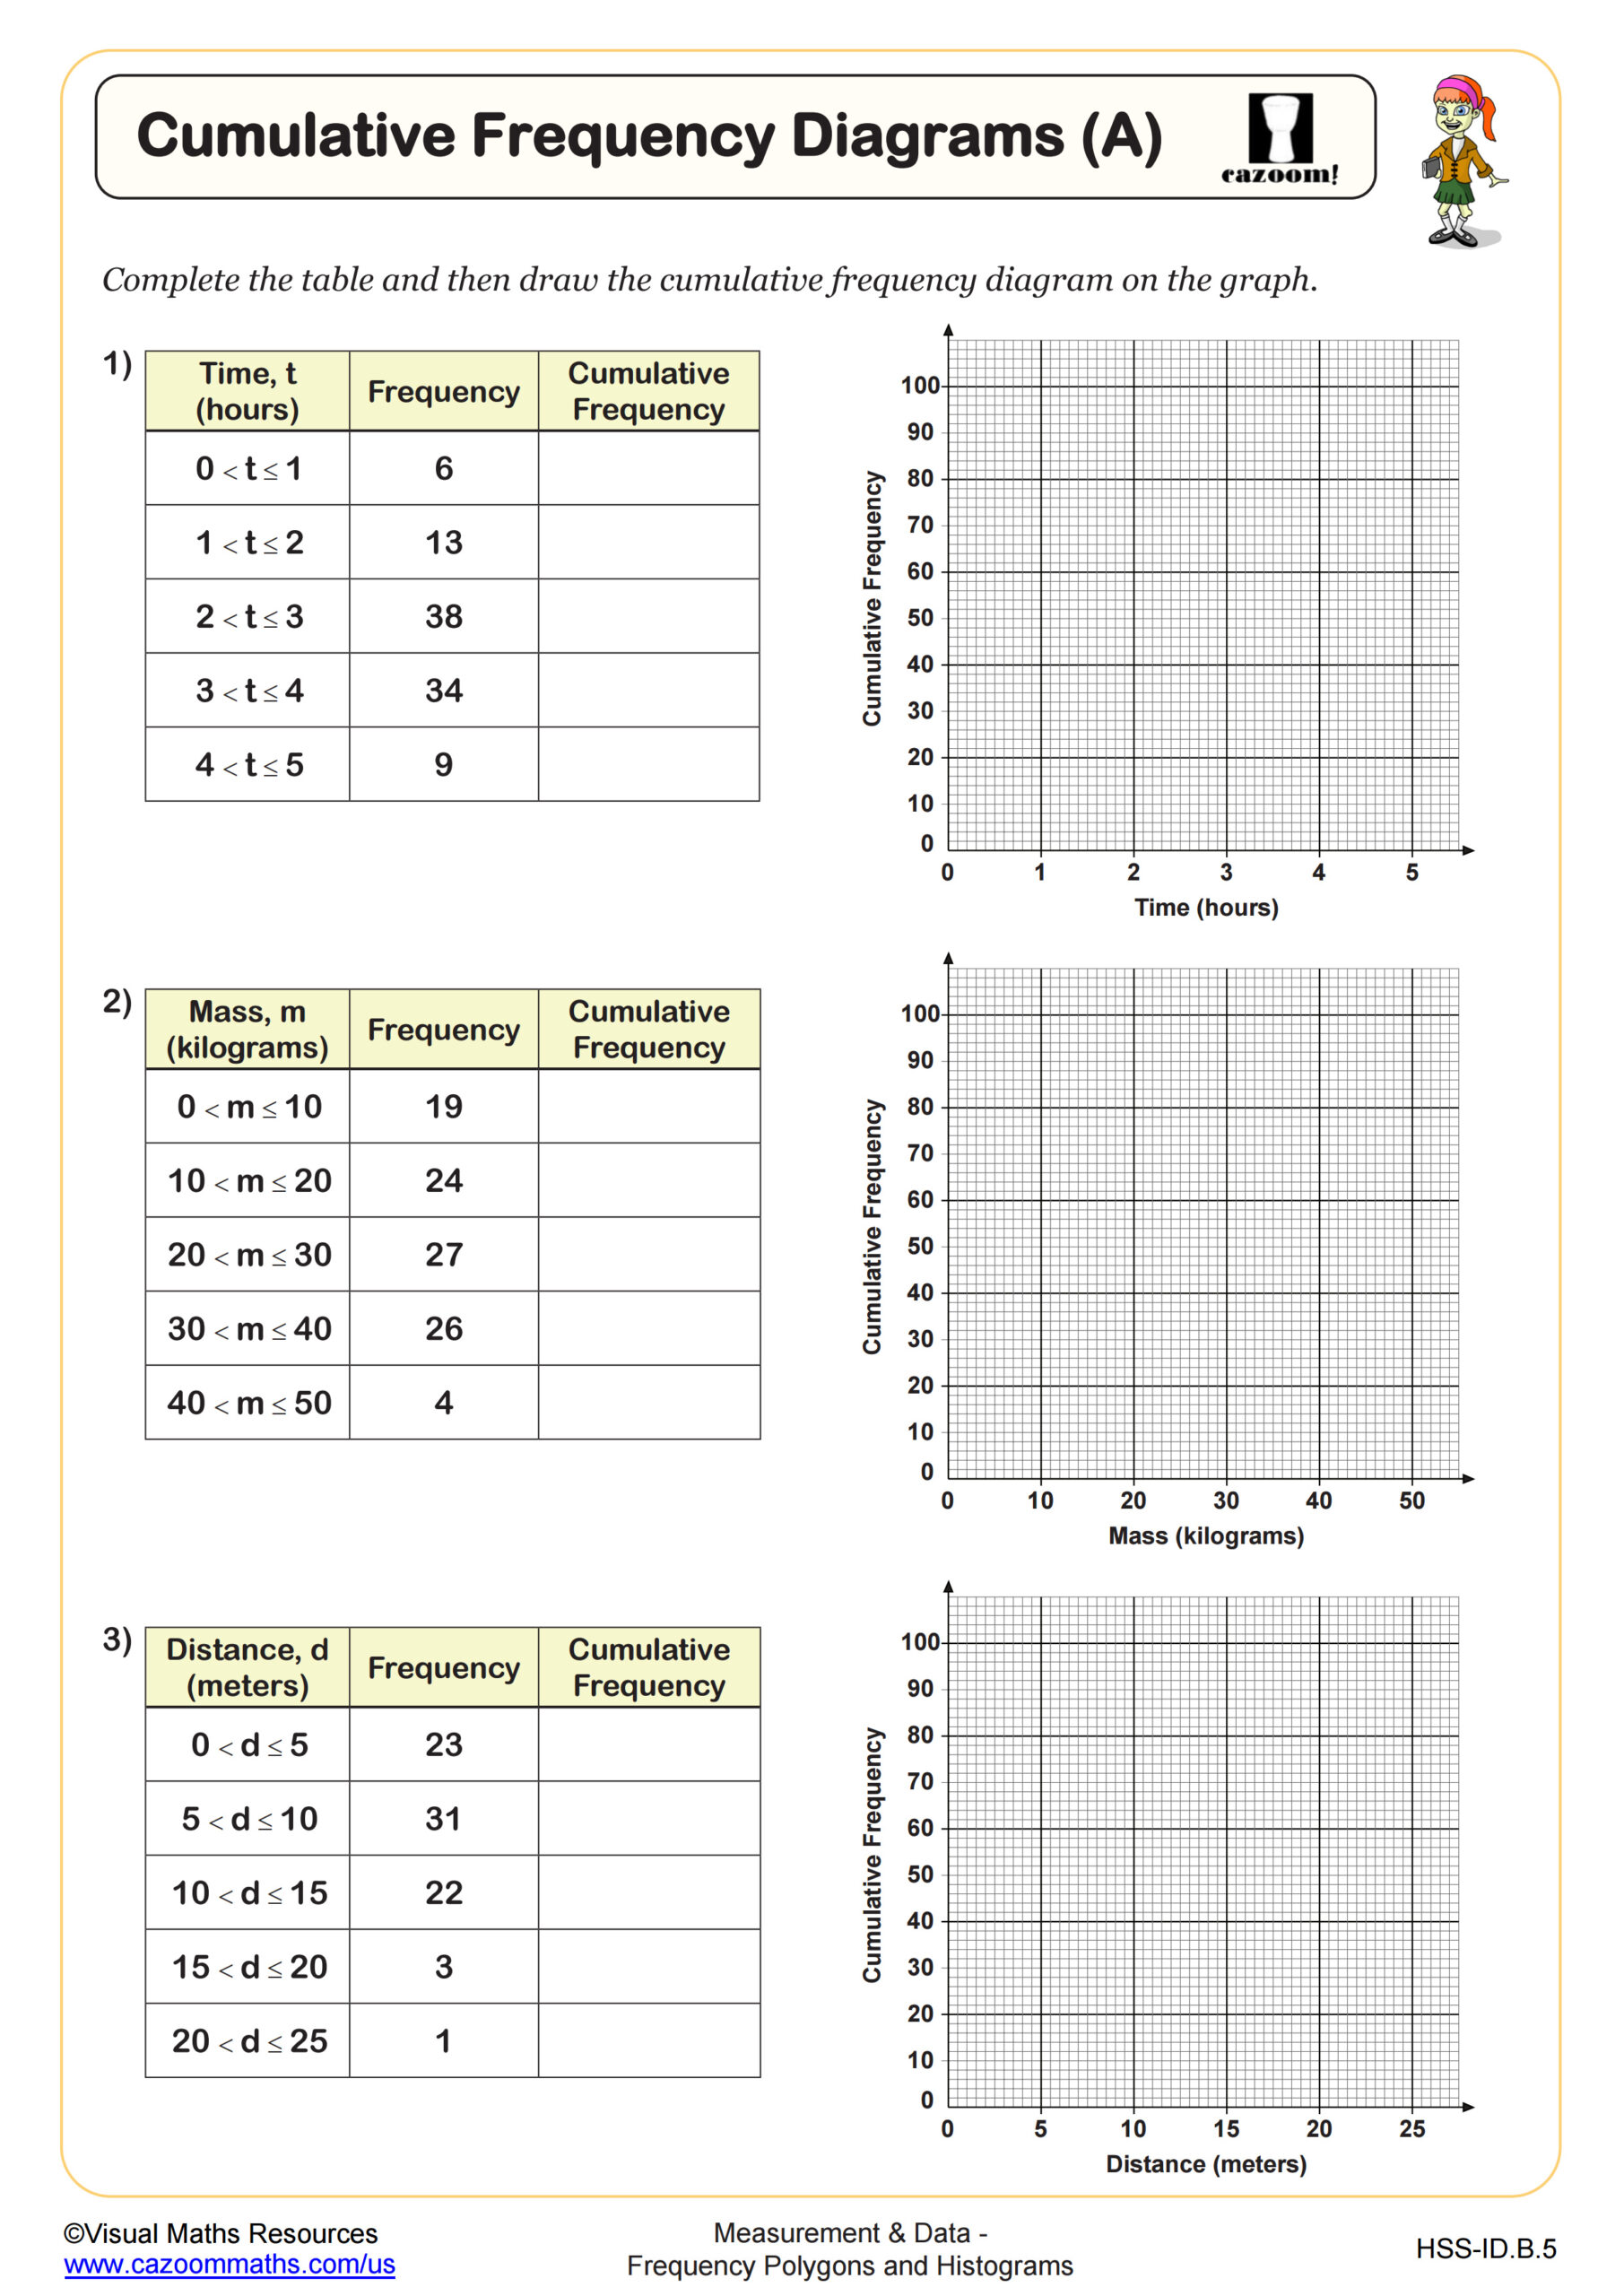
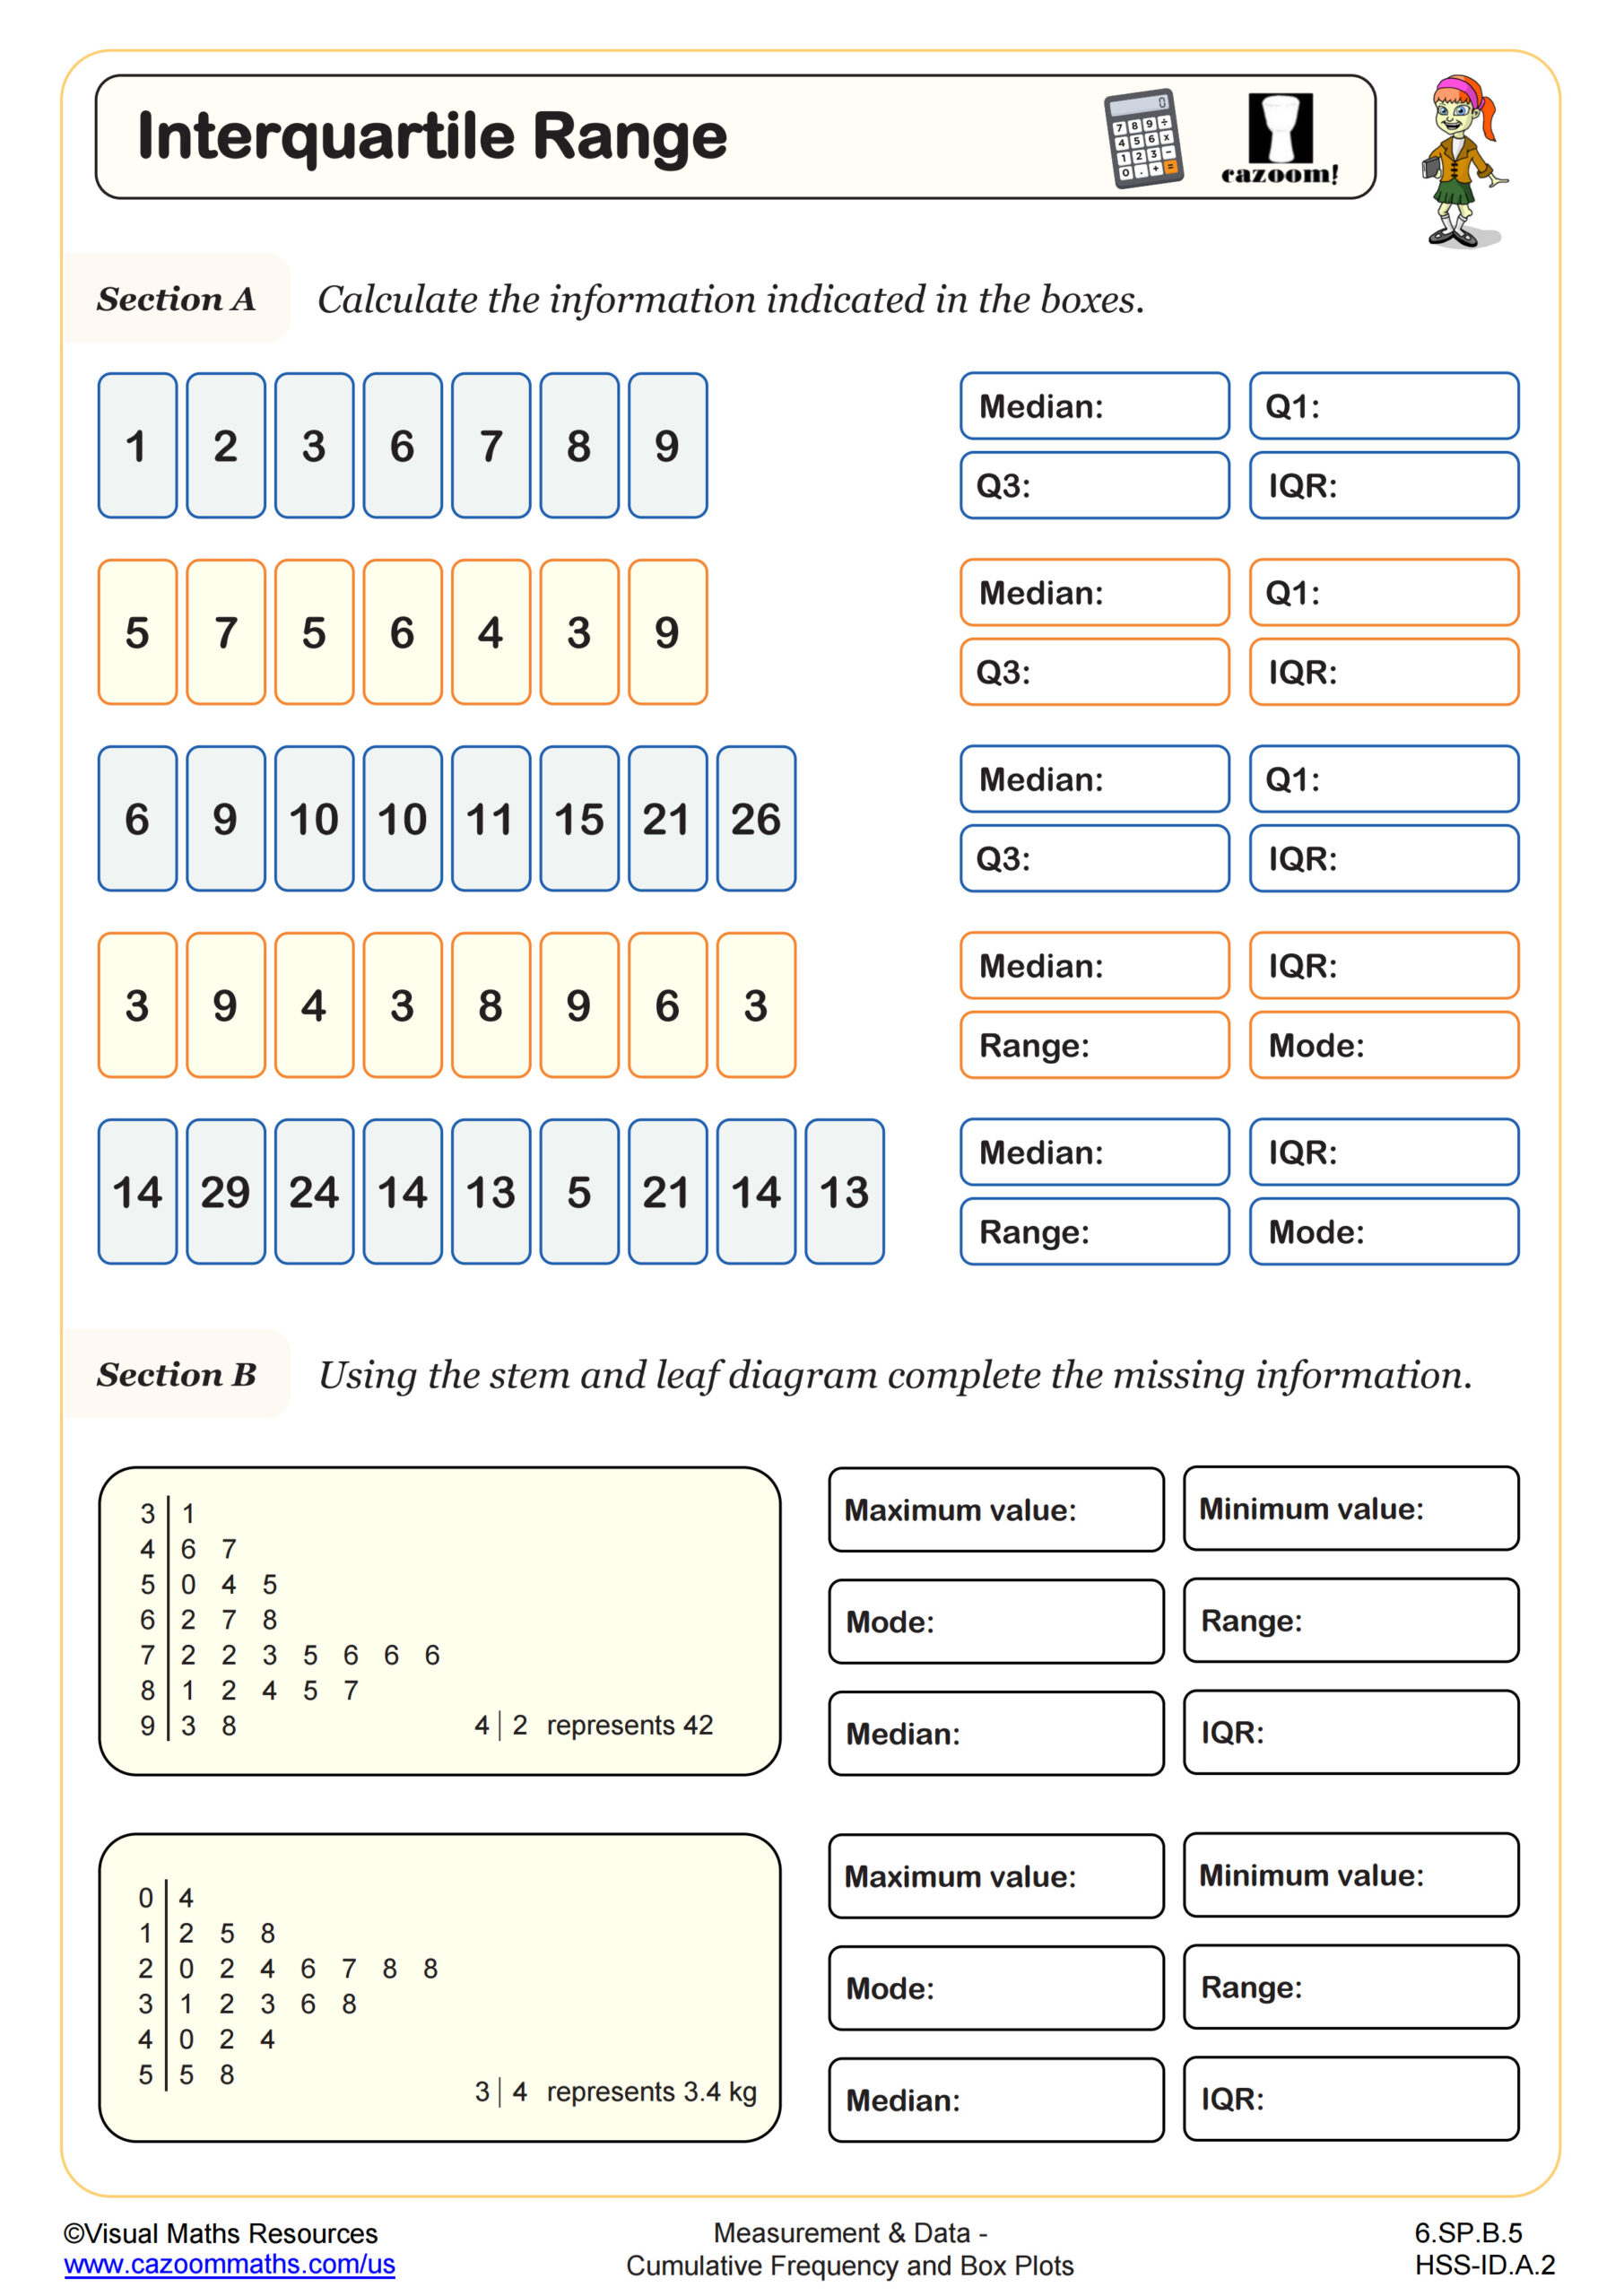
This worksheet is designed to give practice of plotting cumulative frequency diagrams and then finding the median, lower quartile, upper quartile, and interquartile range. It provides three grouped frequency distributions with a cumulative frequency table and axes for each distribution.
All worksheets are created by the team of experienced teachers at Cazoom Math.
 Worksheet")
RELATED TO Cumulative Frequency Diagrams (B) WORKSHEET
Frequently Asked Questions
This worksheet is designed for Algebra I students who are learning about data analysis and statistical representations. At this level, students are ready to work with more complex statistical concepts like quartiles and interquartile range. The skills practiced here build a foundation for advanced statistics courses.