Direct Proportion (A) WORKSHEET
Graph functions expressed symbolically and show key features of the graph, by hand in simple cases and using technology for more complicated cases.★ a. Graph linear and quadratic functions and show intercepts, maxima, and minima. b. Graph square root, cube root, and piecewise-defined functions, including step functions and absolute value functions. c. Graph polynomial functions, identifying zeros when suitable factorizations are available, and showing end behavior. d. (+) Graph rational functions, identifying zeros and asymptotes when suitable factorizations are available, and showing end behavior. e. Graph exponential and logarithmic functions, showing intercepts and end behavior, and trigonometric functions, showing period, midline, and amplitude.
Direct Proportion (A) WORKSHEET DESCRIPTION
Throughout this worksheet students will use their knowledge of what it means for two quantities to be in a directly proportional relationship and provides a good stepping stone toward using constants of proportionality and algebraic representations.
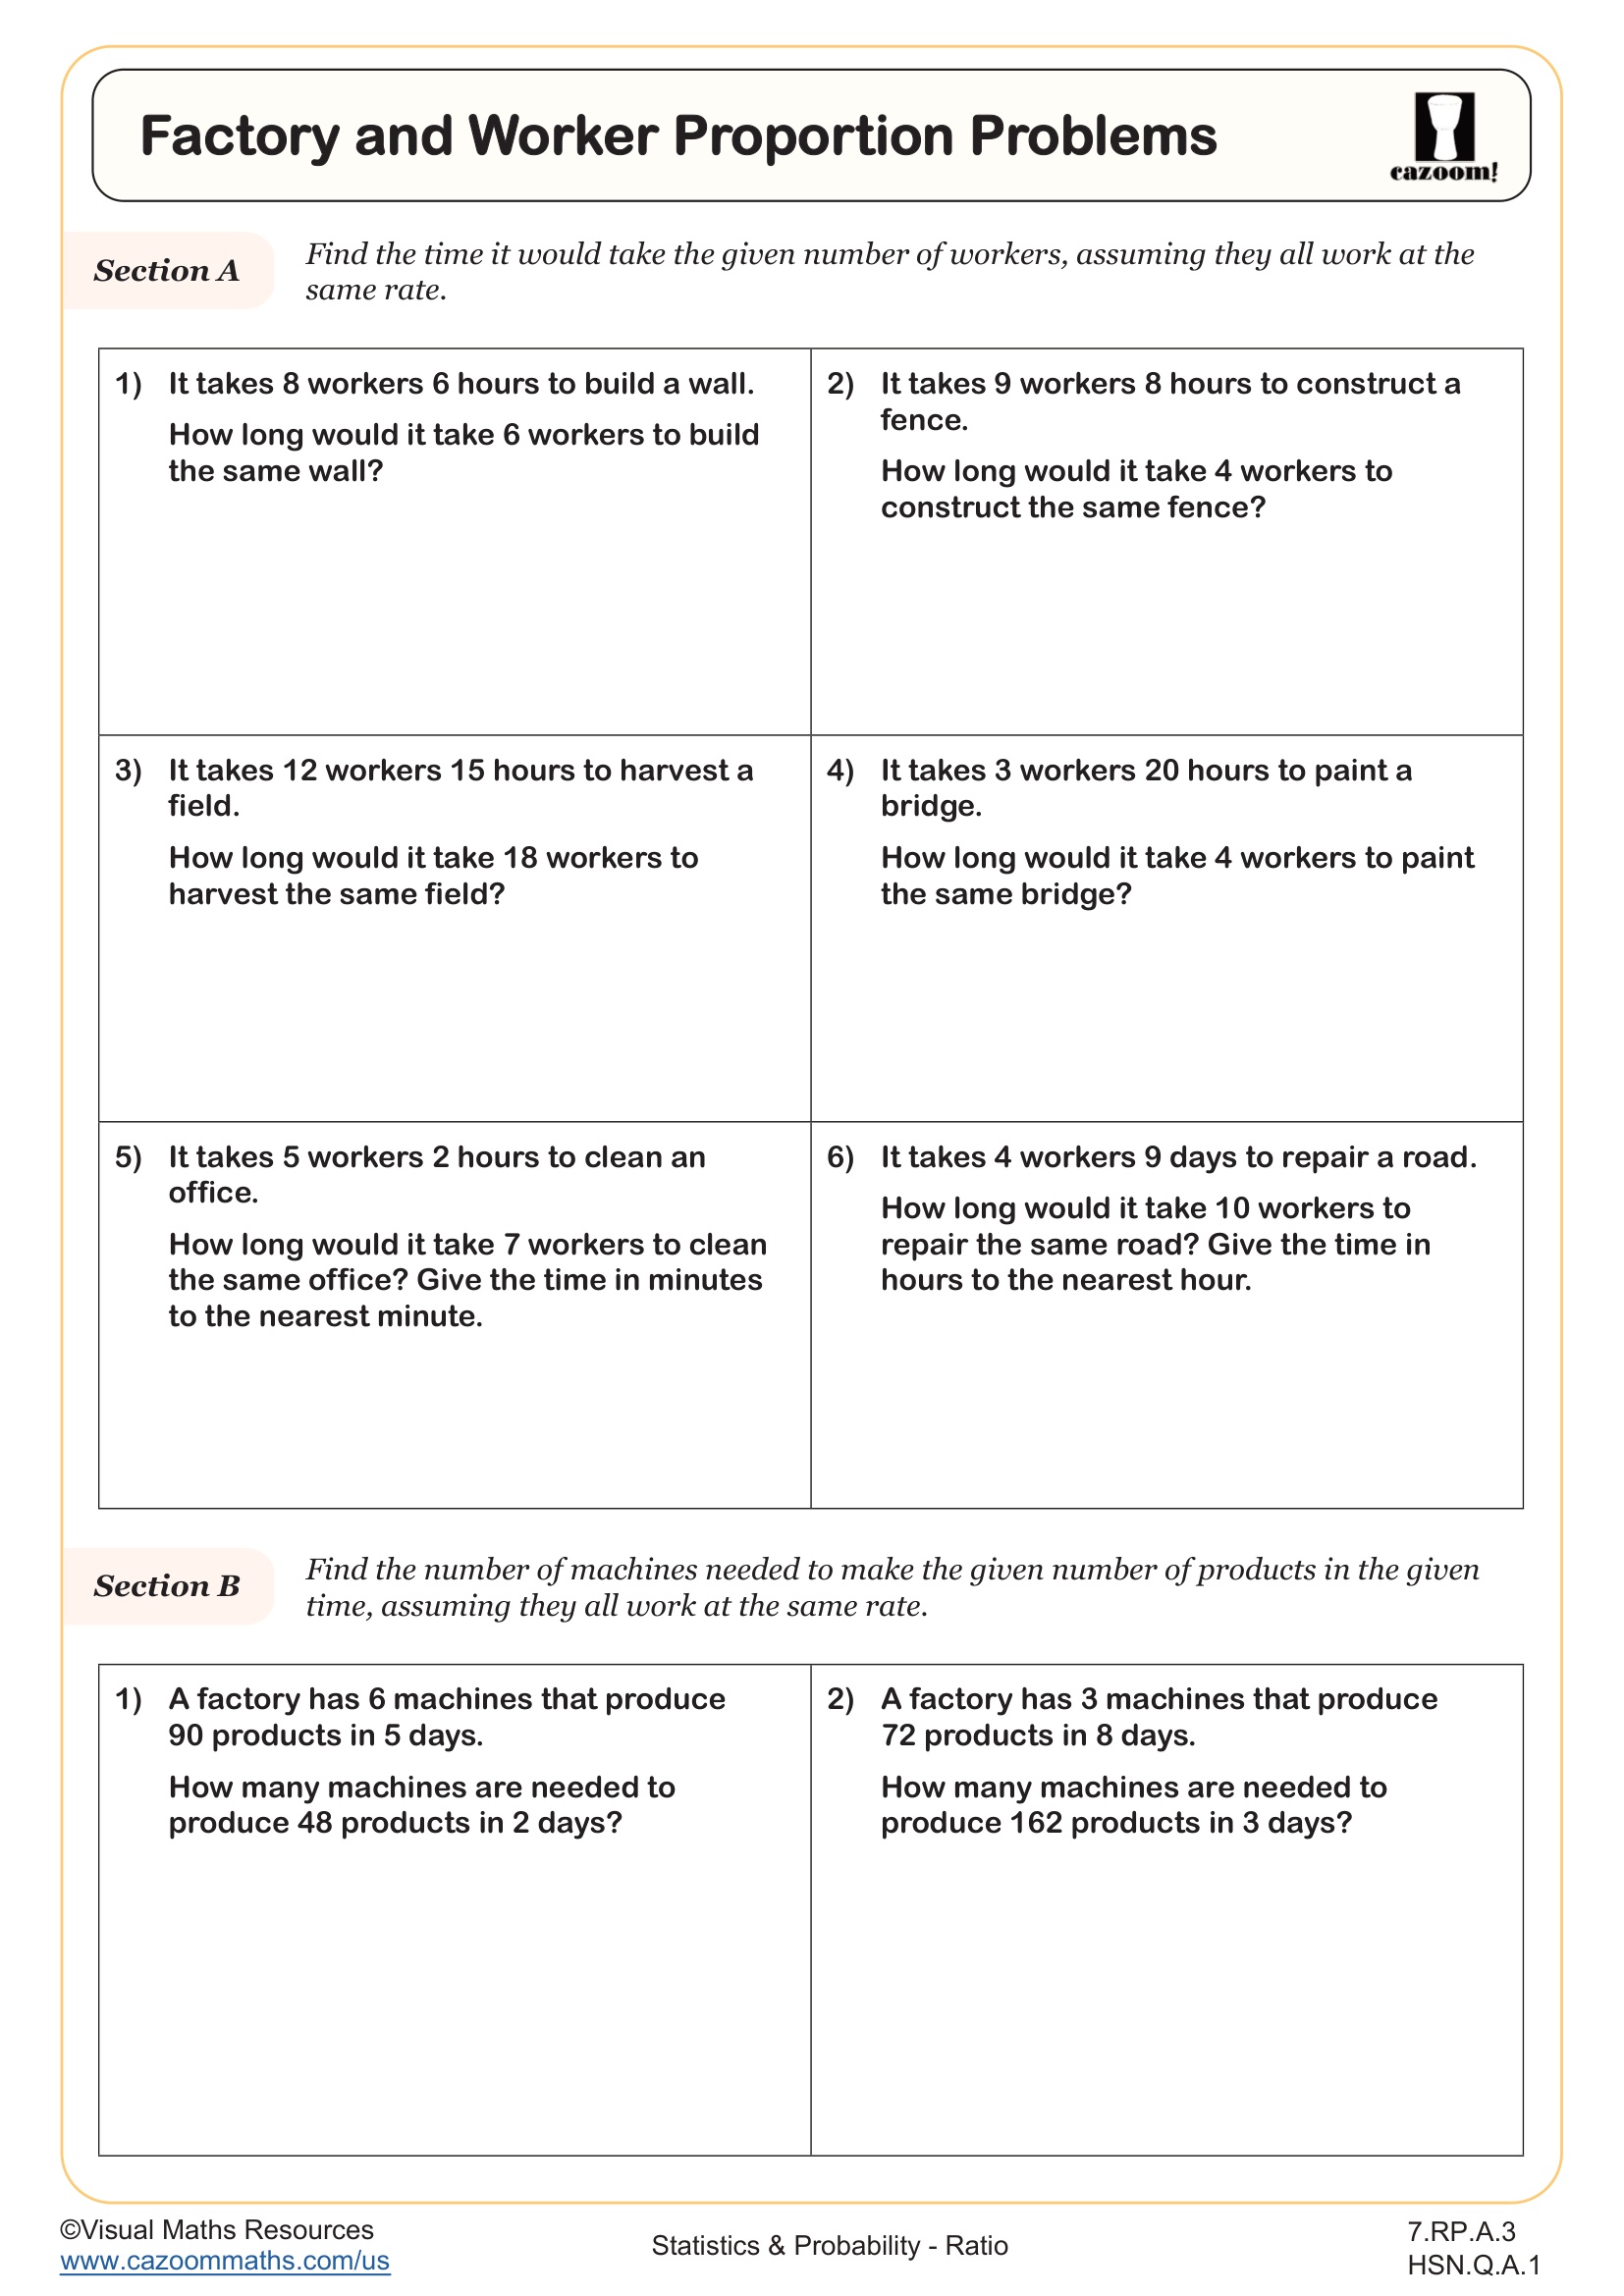
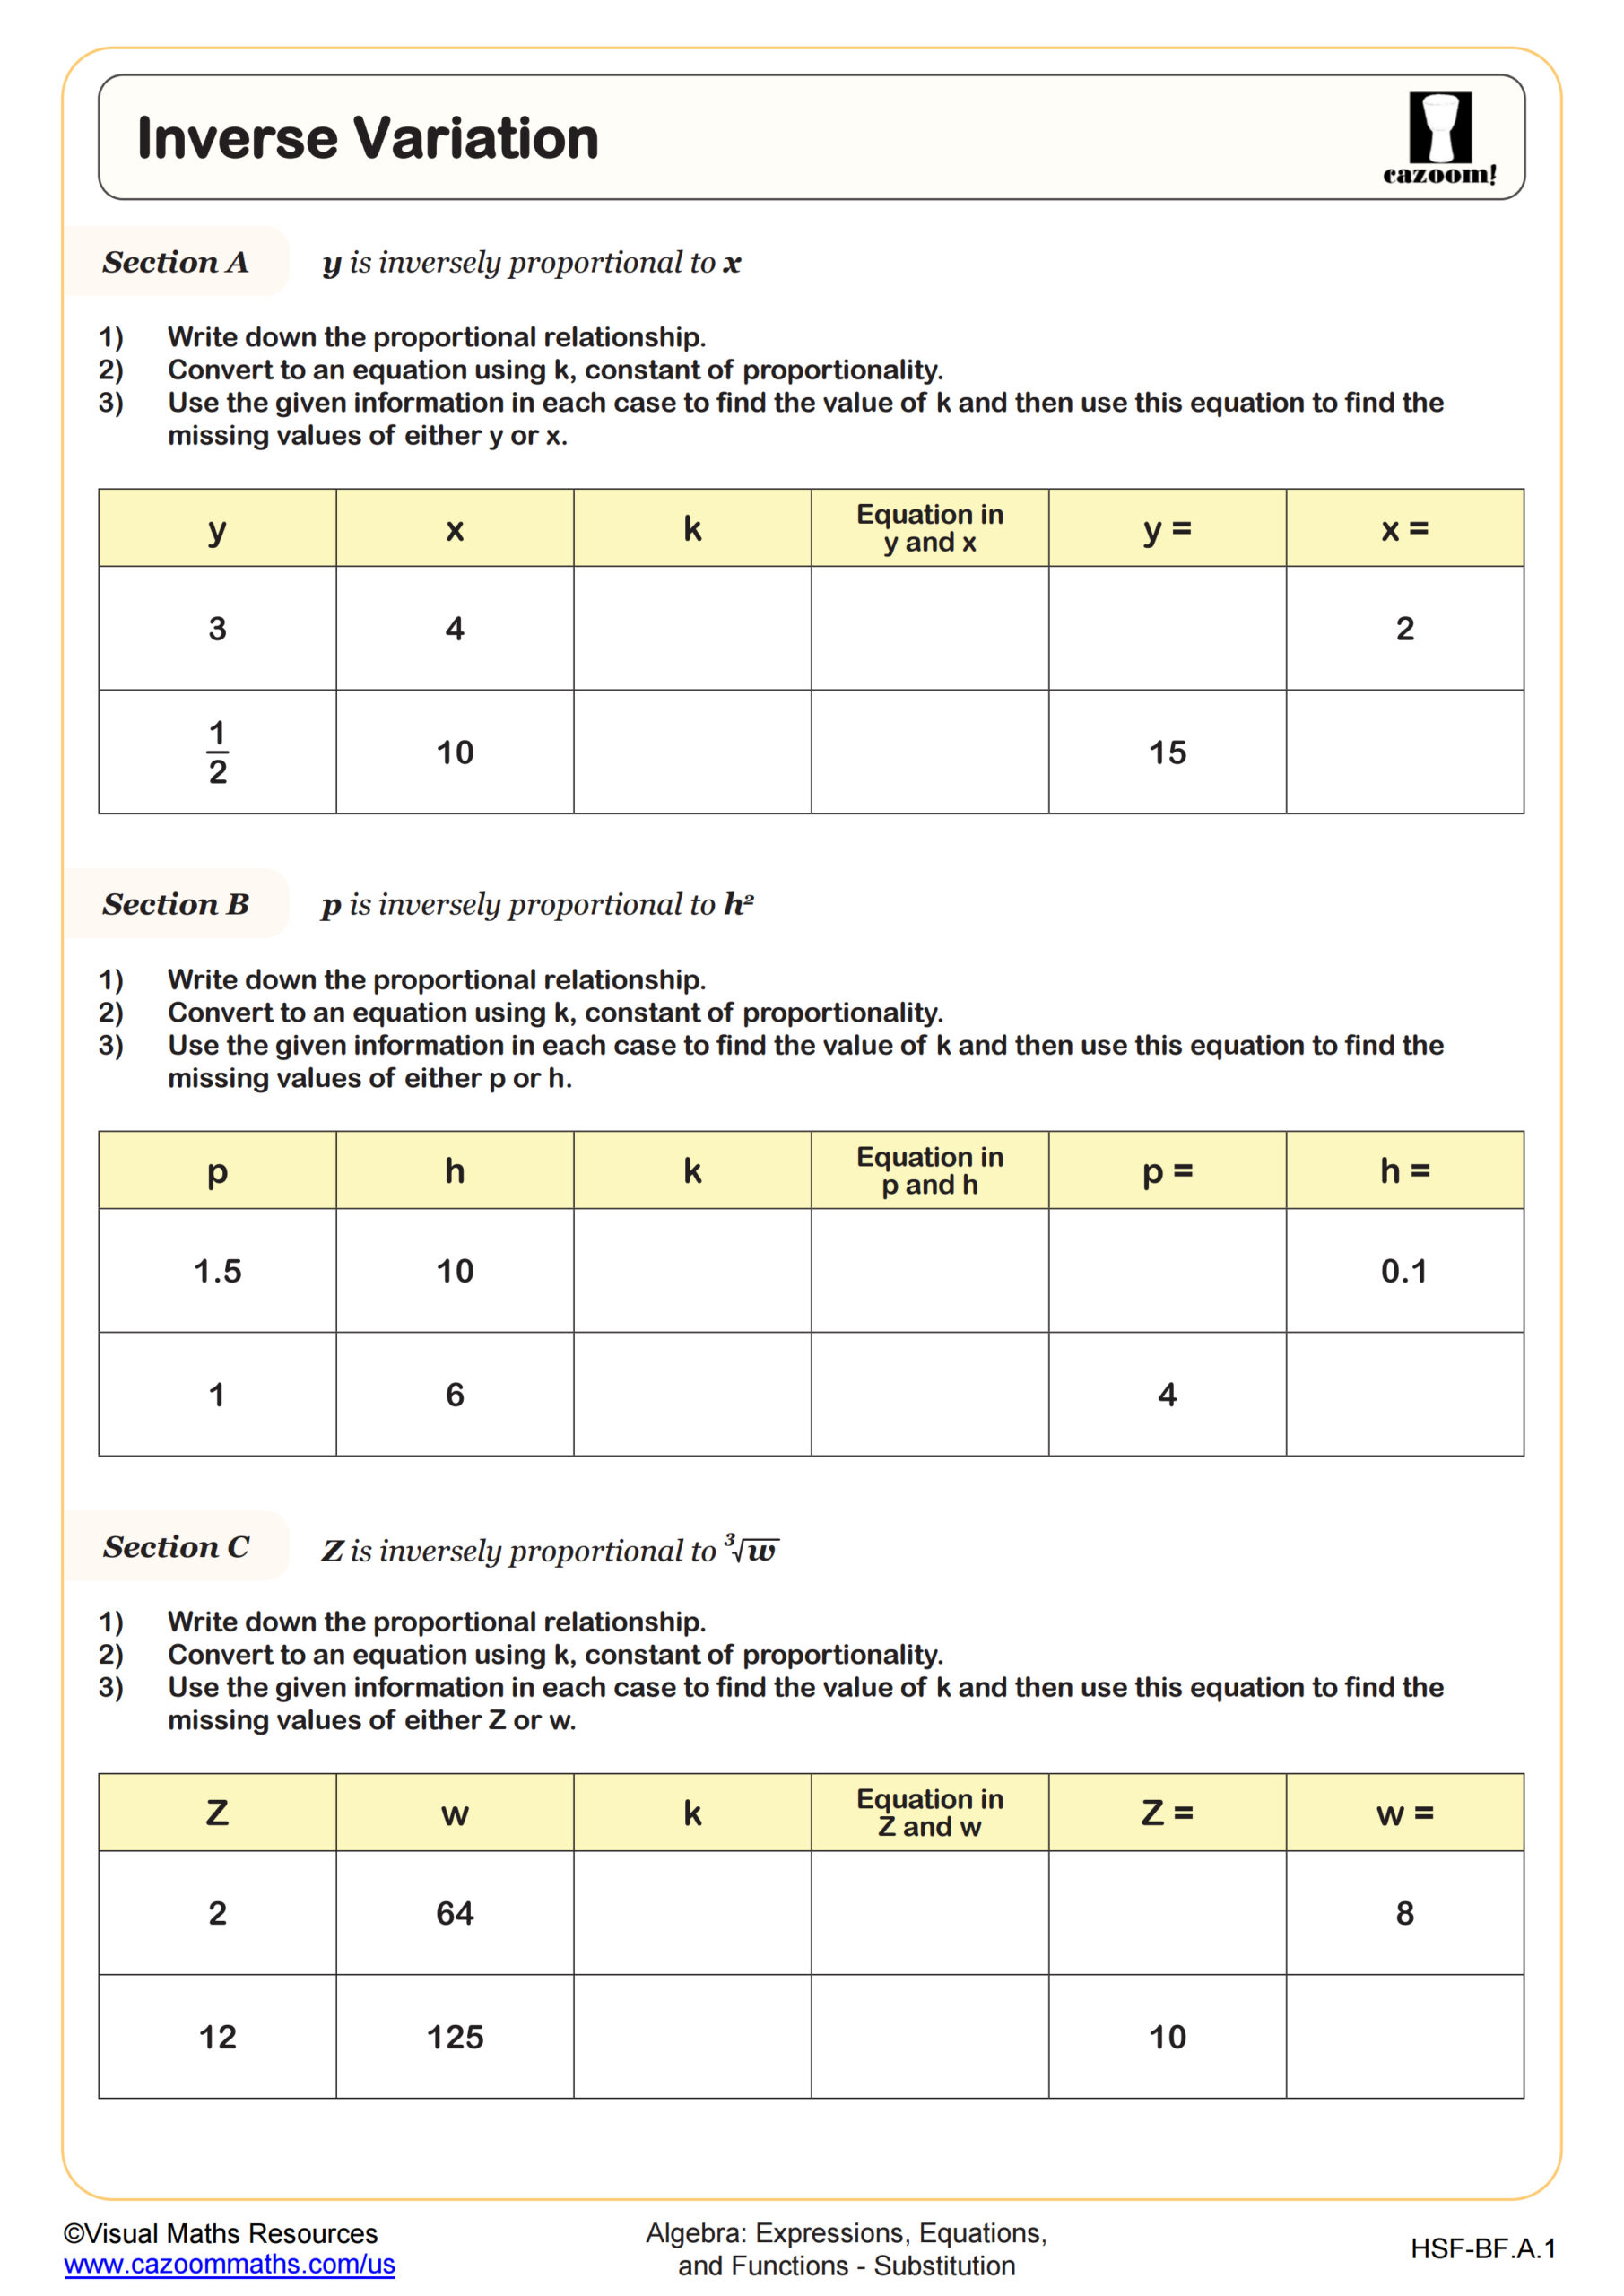
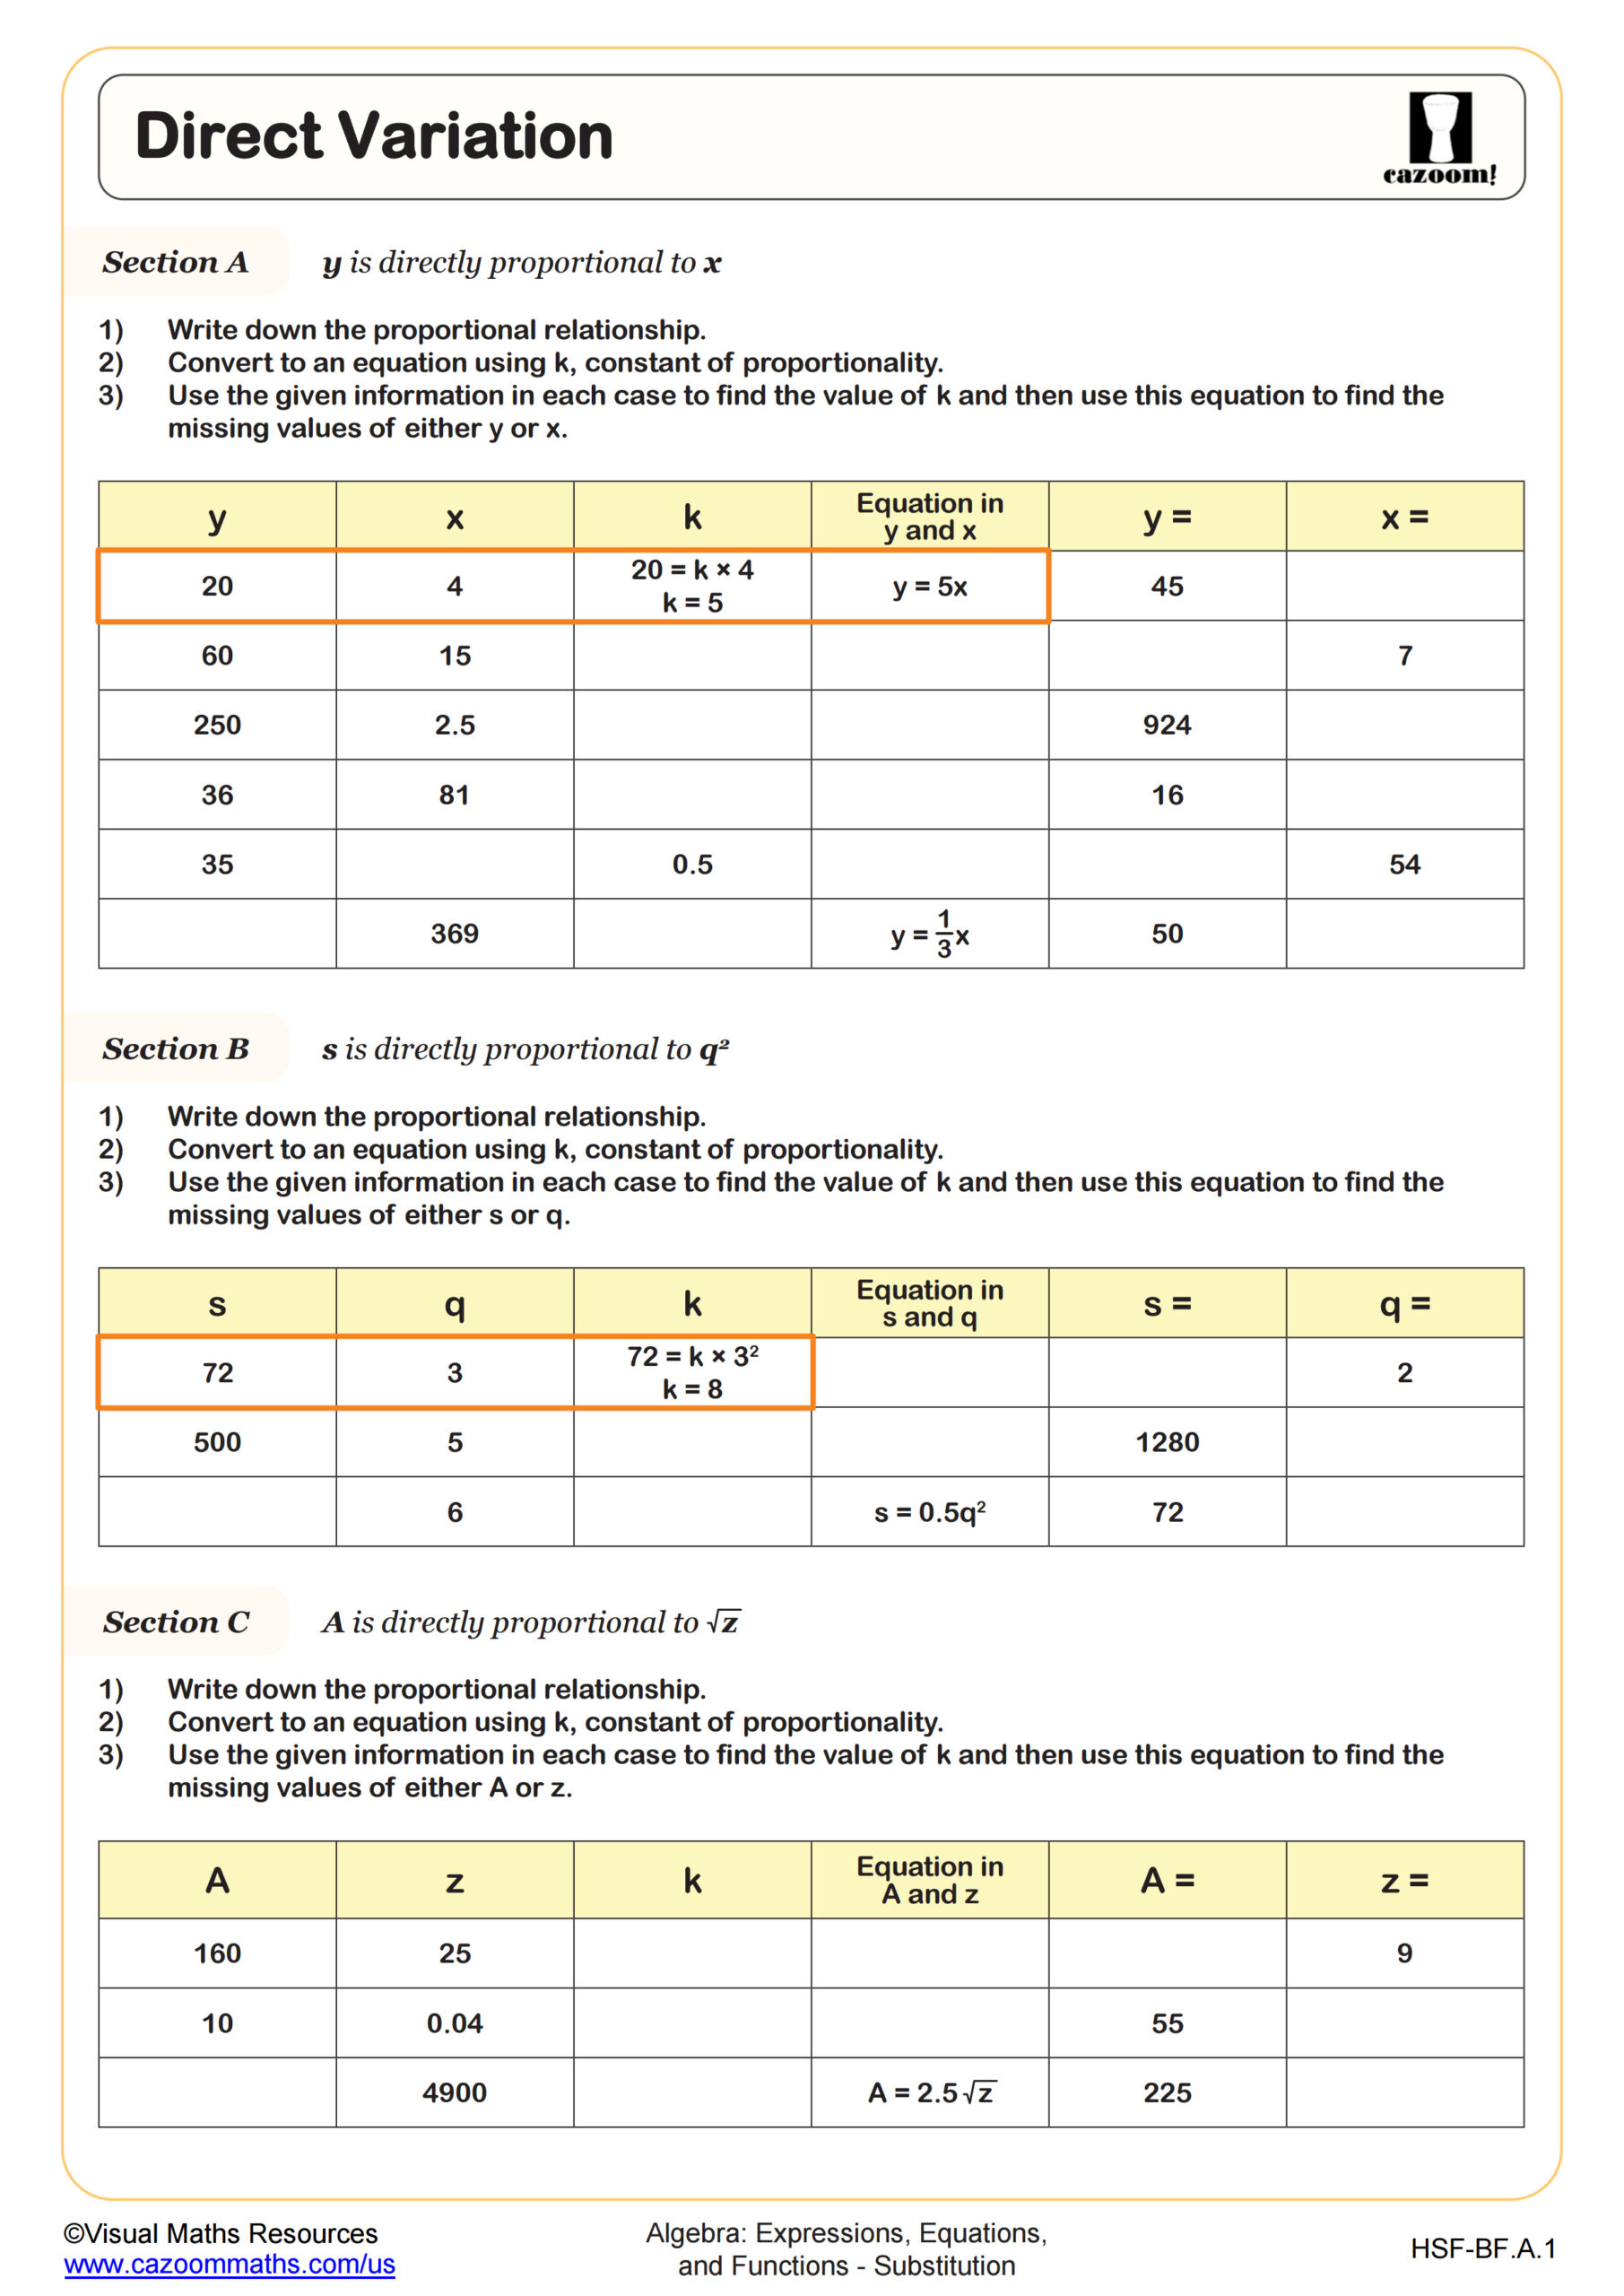
In section A students will complete the gaps in tables where y is directly proportional to x, x cubed and the square root of x by using a given value of x and y in each case.
Next, section B asks students to ascertain which tables out of a possible 6 contain values where y is directly proportional to x. This section helps to shine a light on common misconceptions such as the relationship being linked to addition and subtraction.
Learners will plot the graphs of two sets of directly proportional values on pre drawn and labelled axes before considering what is the same and/or different between the graphs.
All worksheets are created by the team of experienced teachers at Cazoom Math.

RELATED TO Direct Proportion (A) WORKSHEET
Frequently Asked Questions
This worksheet is designed for 6th Grade, Geometry, and IM 1 students. The content builds foundational understanding of proportional relationships that students will encounter across these different math courses. The skills practiced here serve as important preparation for more advanced algebraic concepts.