Draw Line Graphs WORKSHEET
Make a line plot to display a data set of measurements in fractions of a unit (1/2, 1/4, 1/8). Use operations on fractions for this grade to solve problems involving information presented in line plots. For example, given different measurements of liquid in identical beakers, find the amount of liquid each beaker would contain if the total amount in all the beakers were redistributed equally
Draw Line Graphs WORKSHEET DESCRIPTION
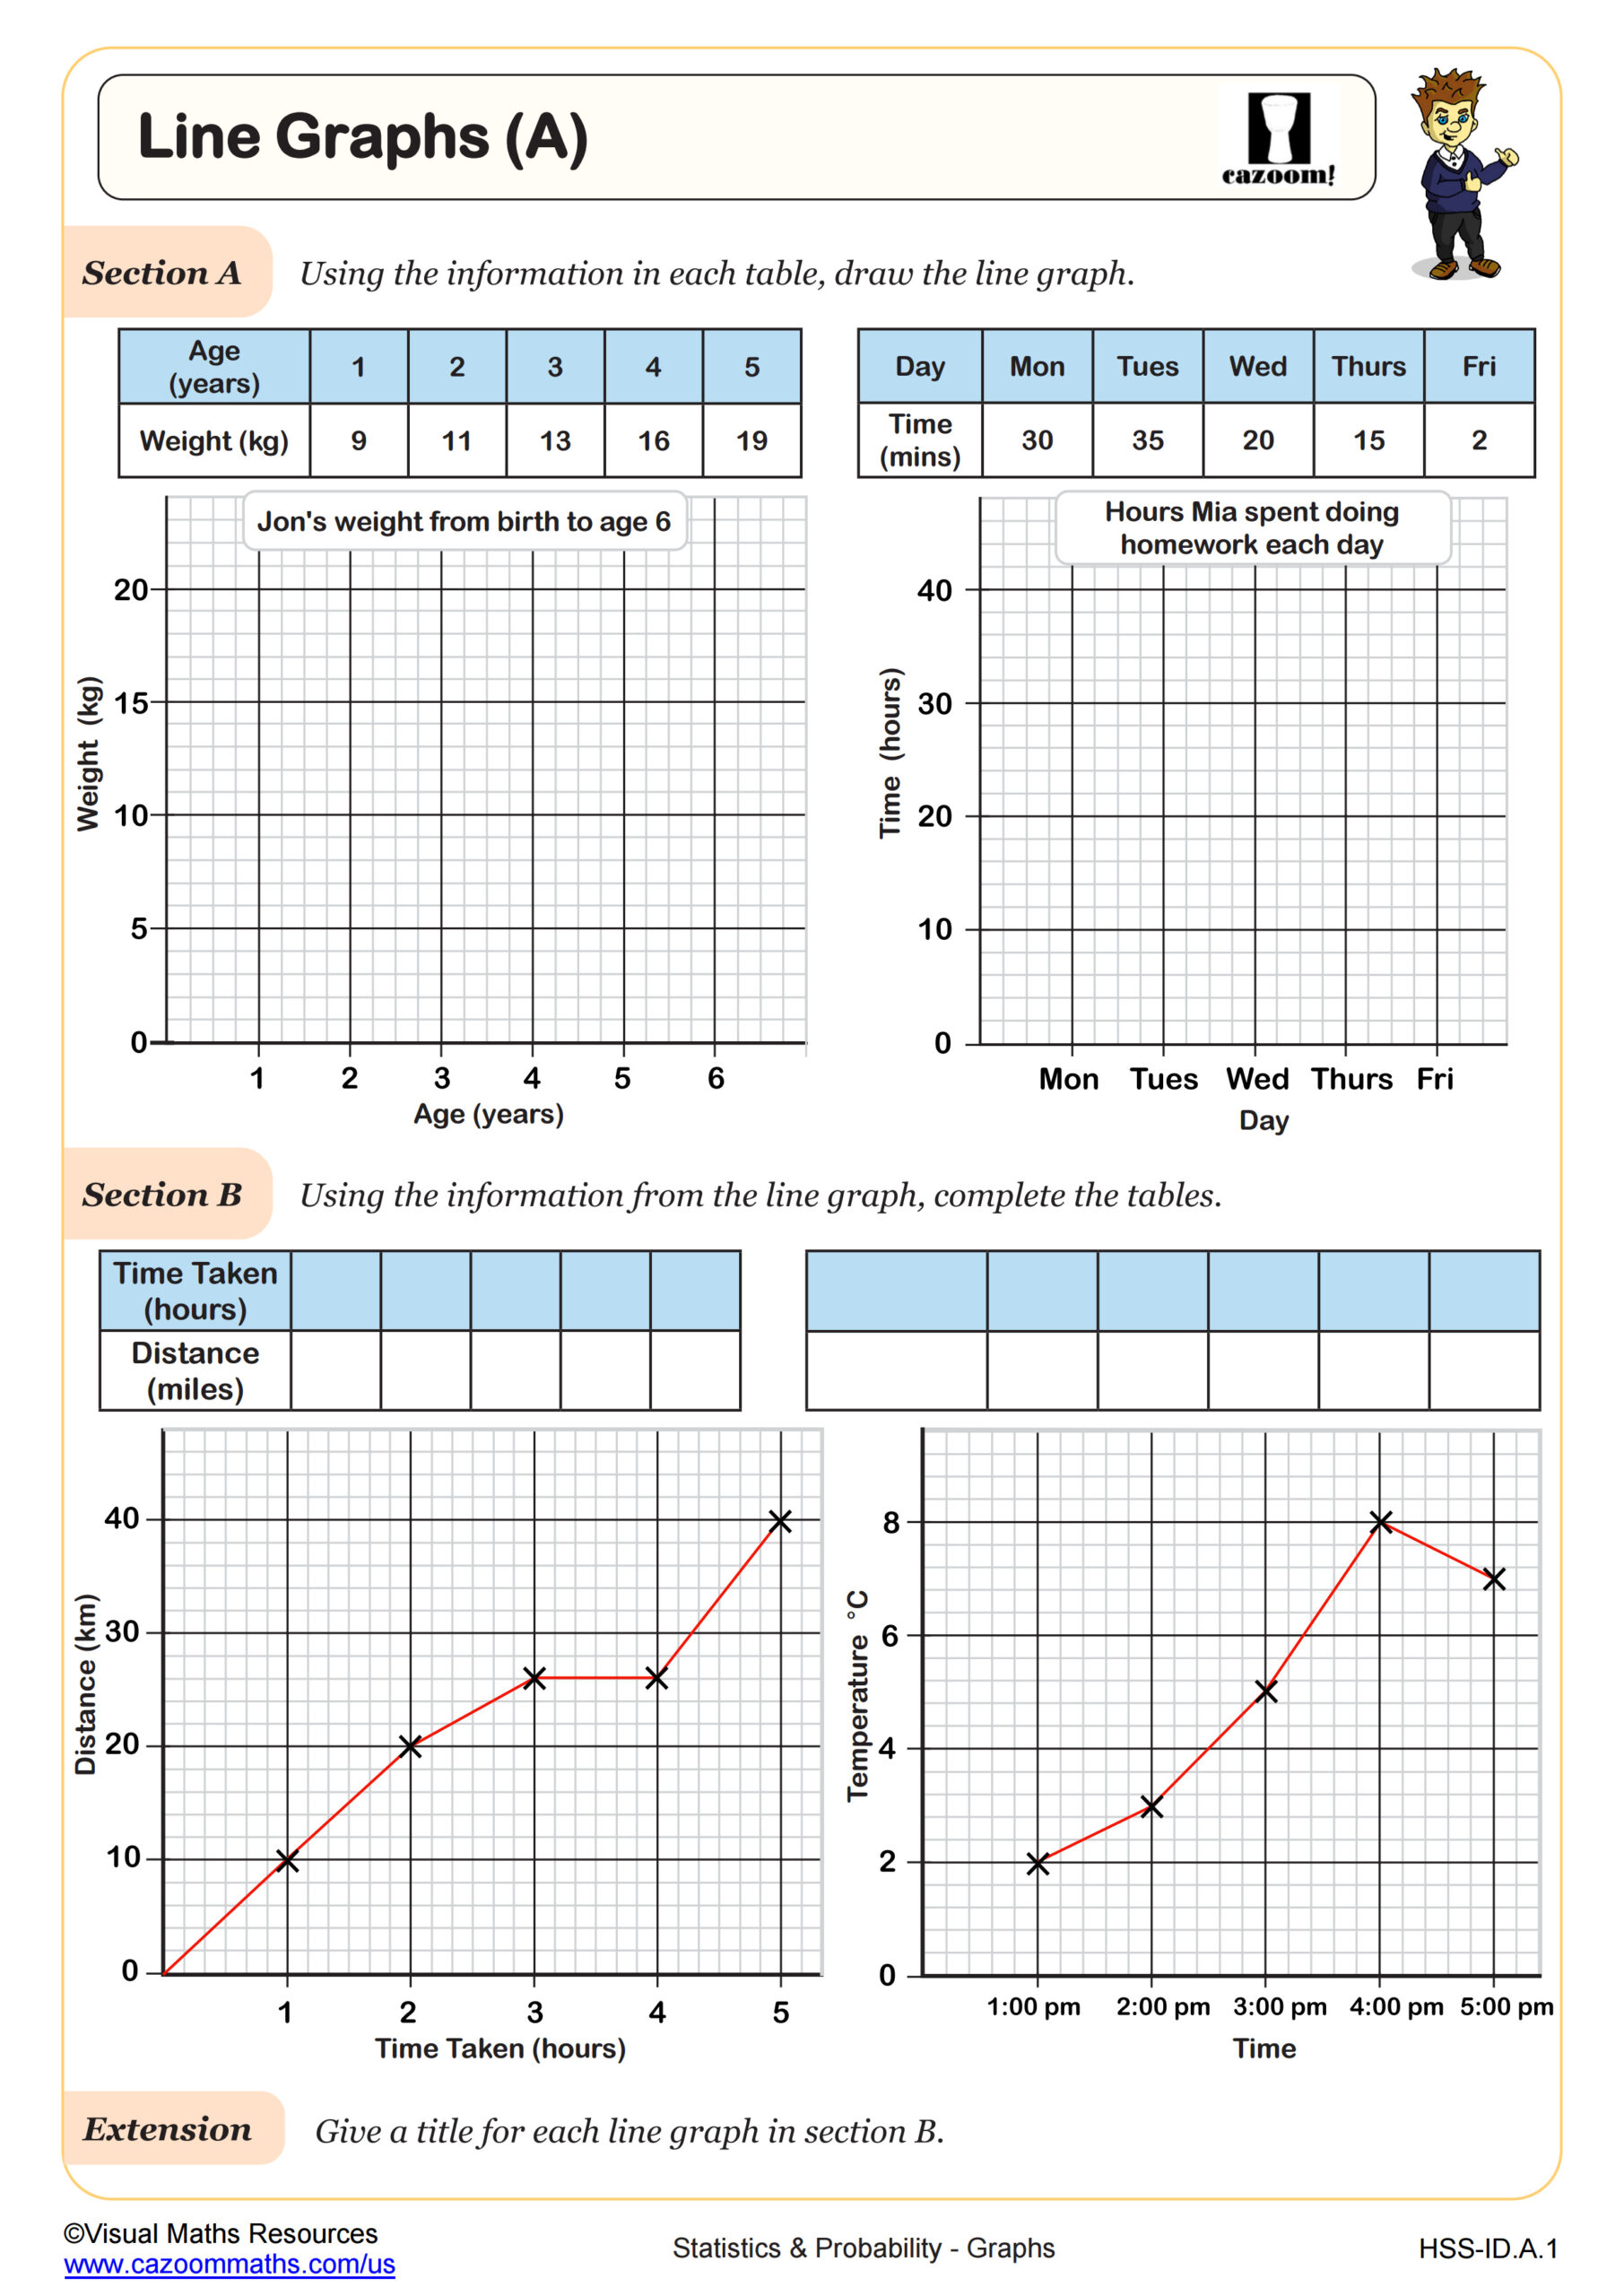
This worksheet focuses on developing students' ability to draw and interpret line graphs.
The first question requires students to select the most suitable line graph that accurately represents the data provided in a table. They must then justify their choice by explaining the reasoning behind their decision.
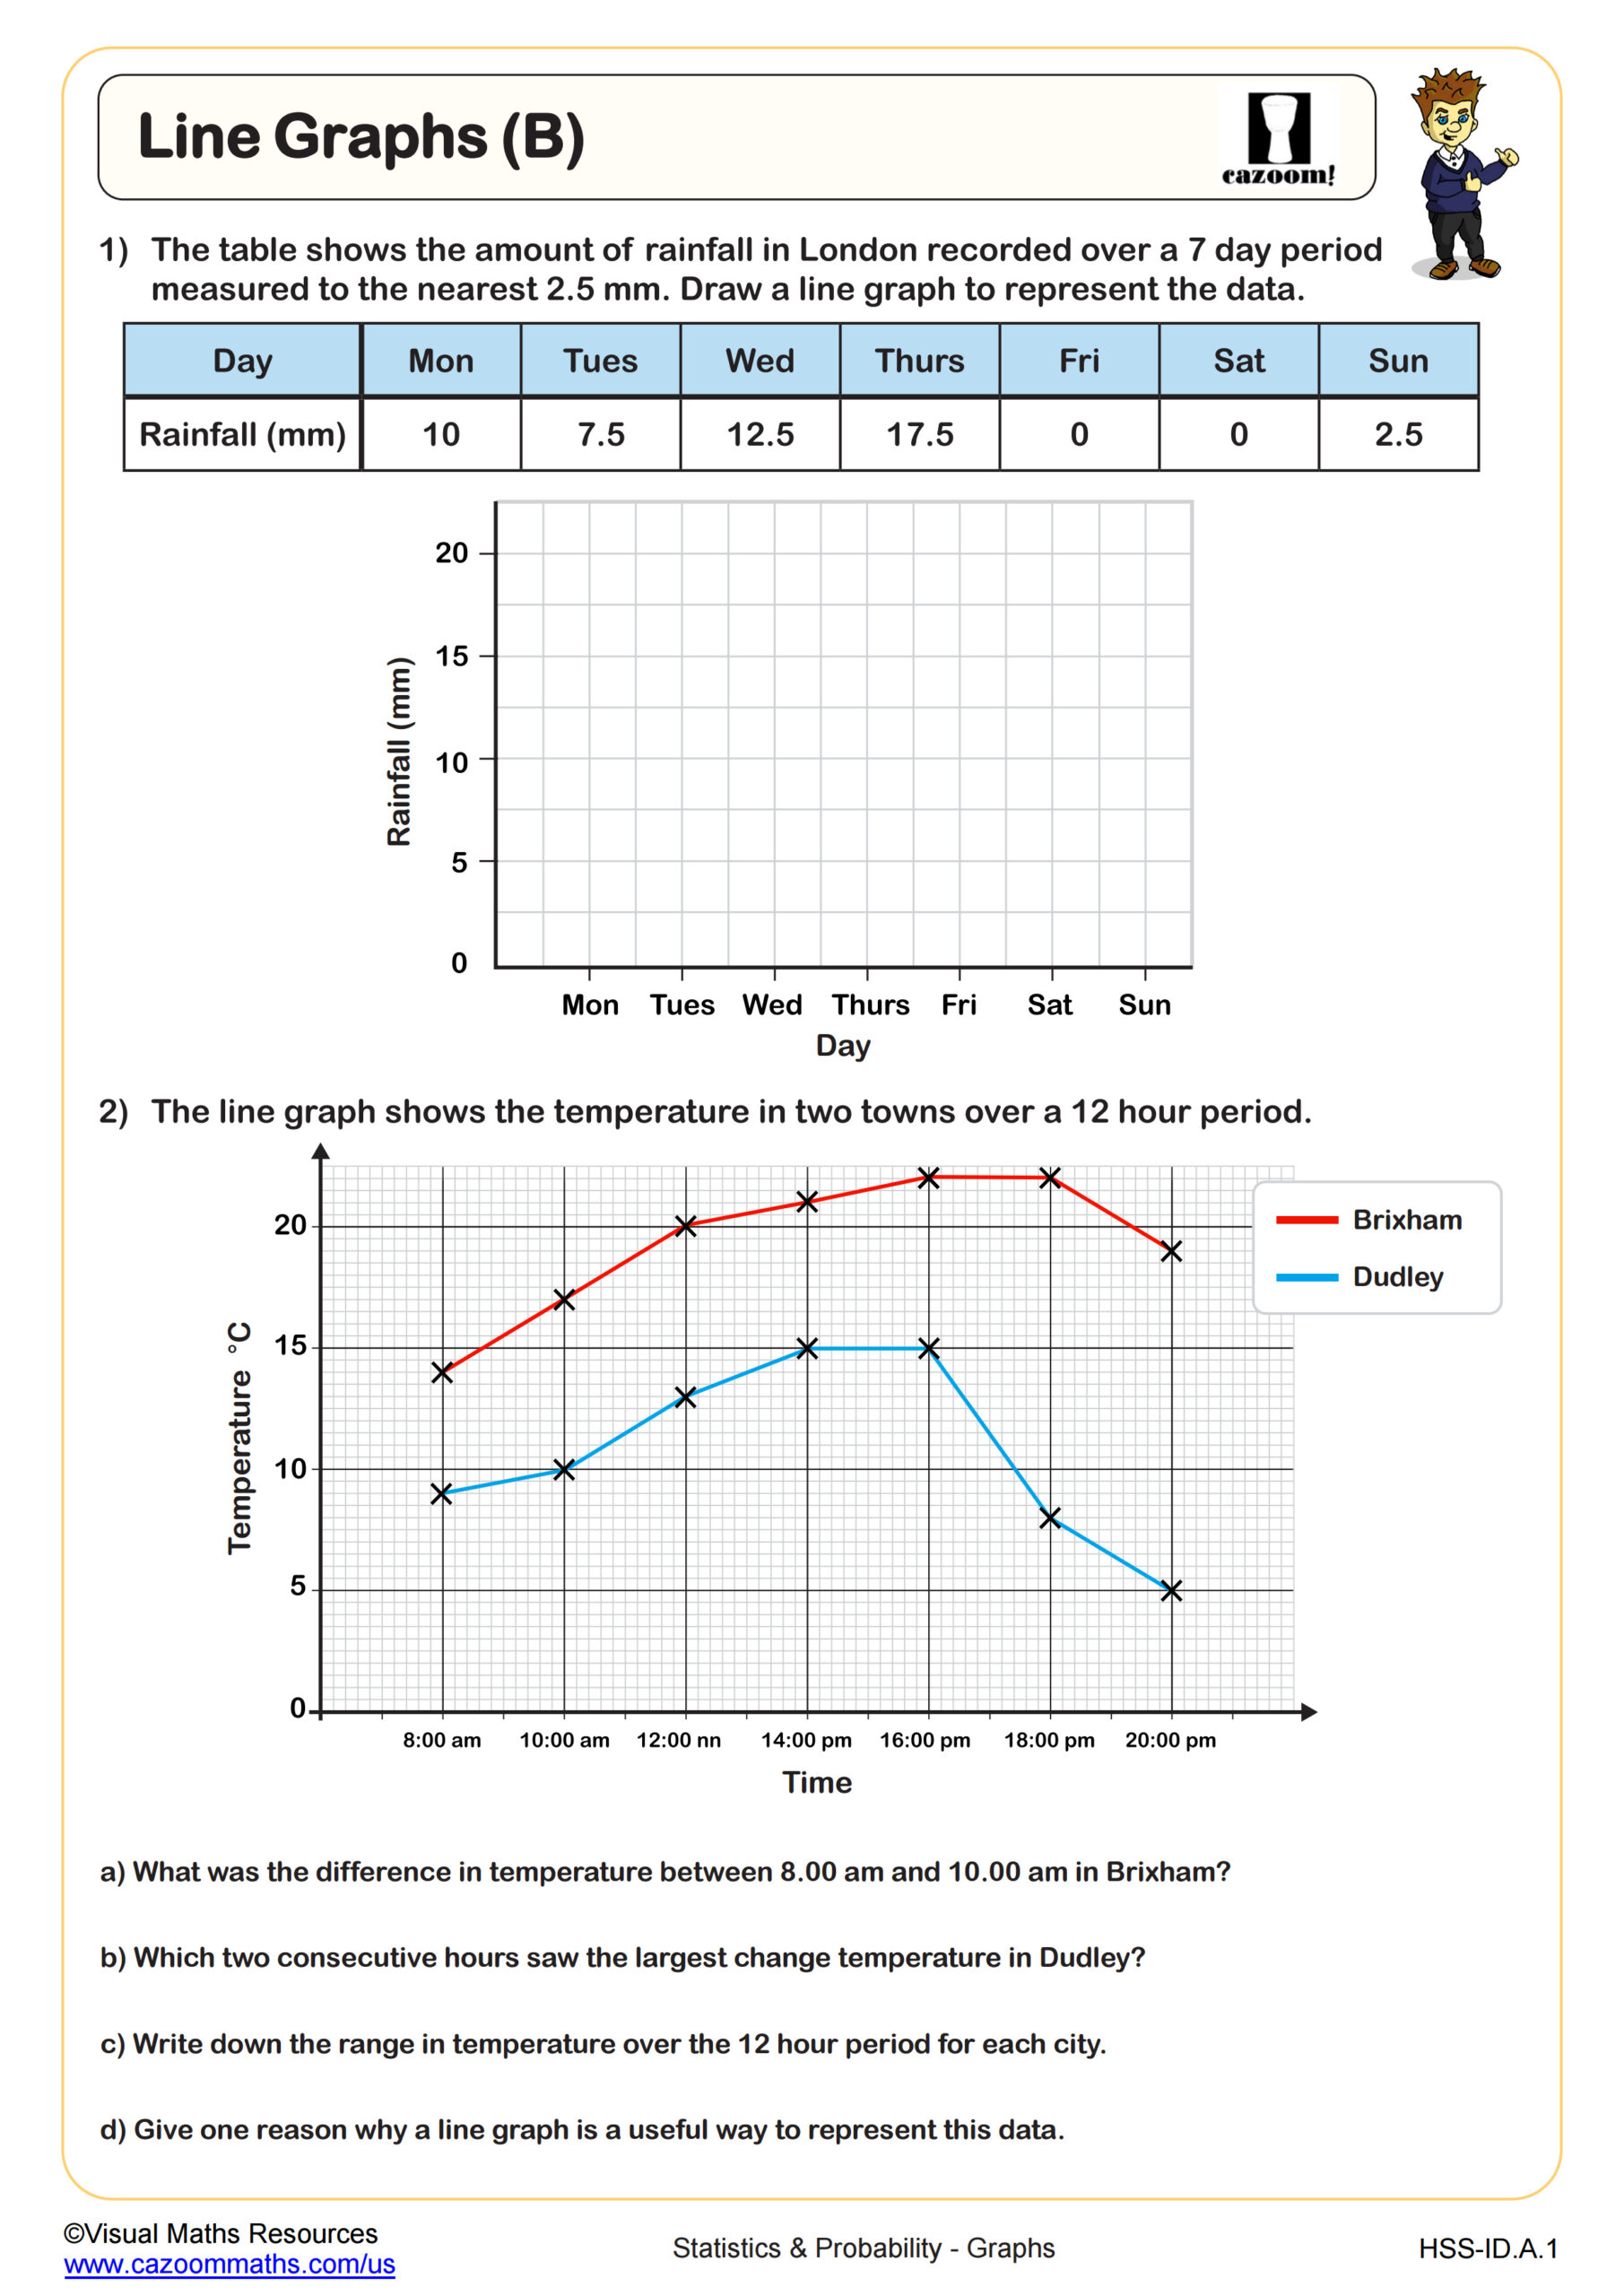
Over the remaining questions, learners will complete a line graph, draw their own, including labeling the axes too, and look for errors in a line graph.
This worksheet provides a comprehensive introduction to drawing and interpreting line graphs while offering opportunities for critical analysis and applied skills."
All worksheets are created by the team of experienced teachers at Cazoom Math.

RELATED TO Draw Line Graphs WORKSHEET
Frequently Asked Questions
This worksheet is designed for 4th grade and 5th grade students who are developing their statistics skills. At these grade levels, students are ready to tackle the foundational concepts of creating and analyzing line graphs, which builds their data interpretation abilities for more advanced math concepts later on.