Back to:
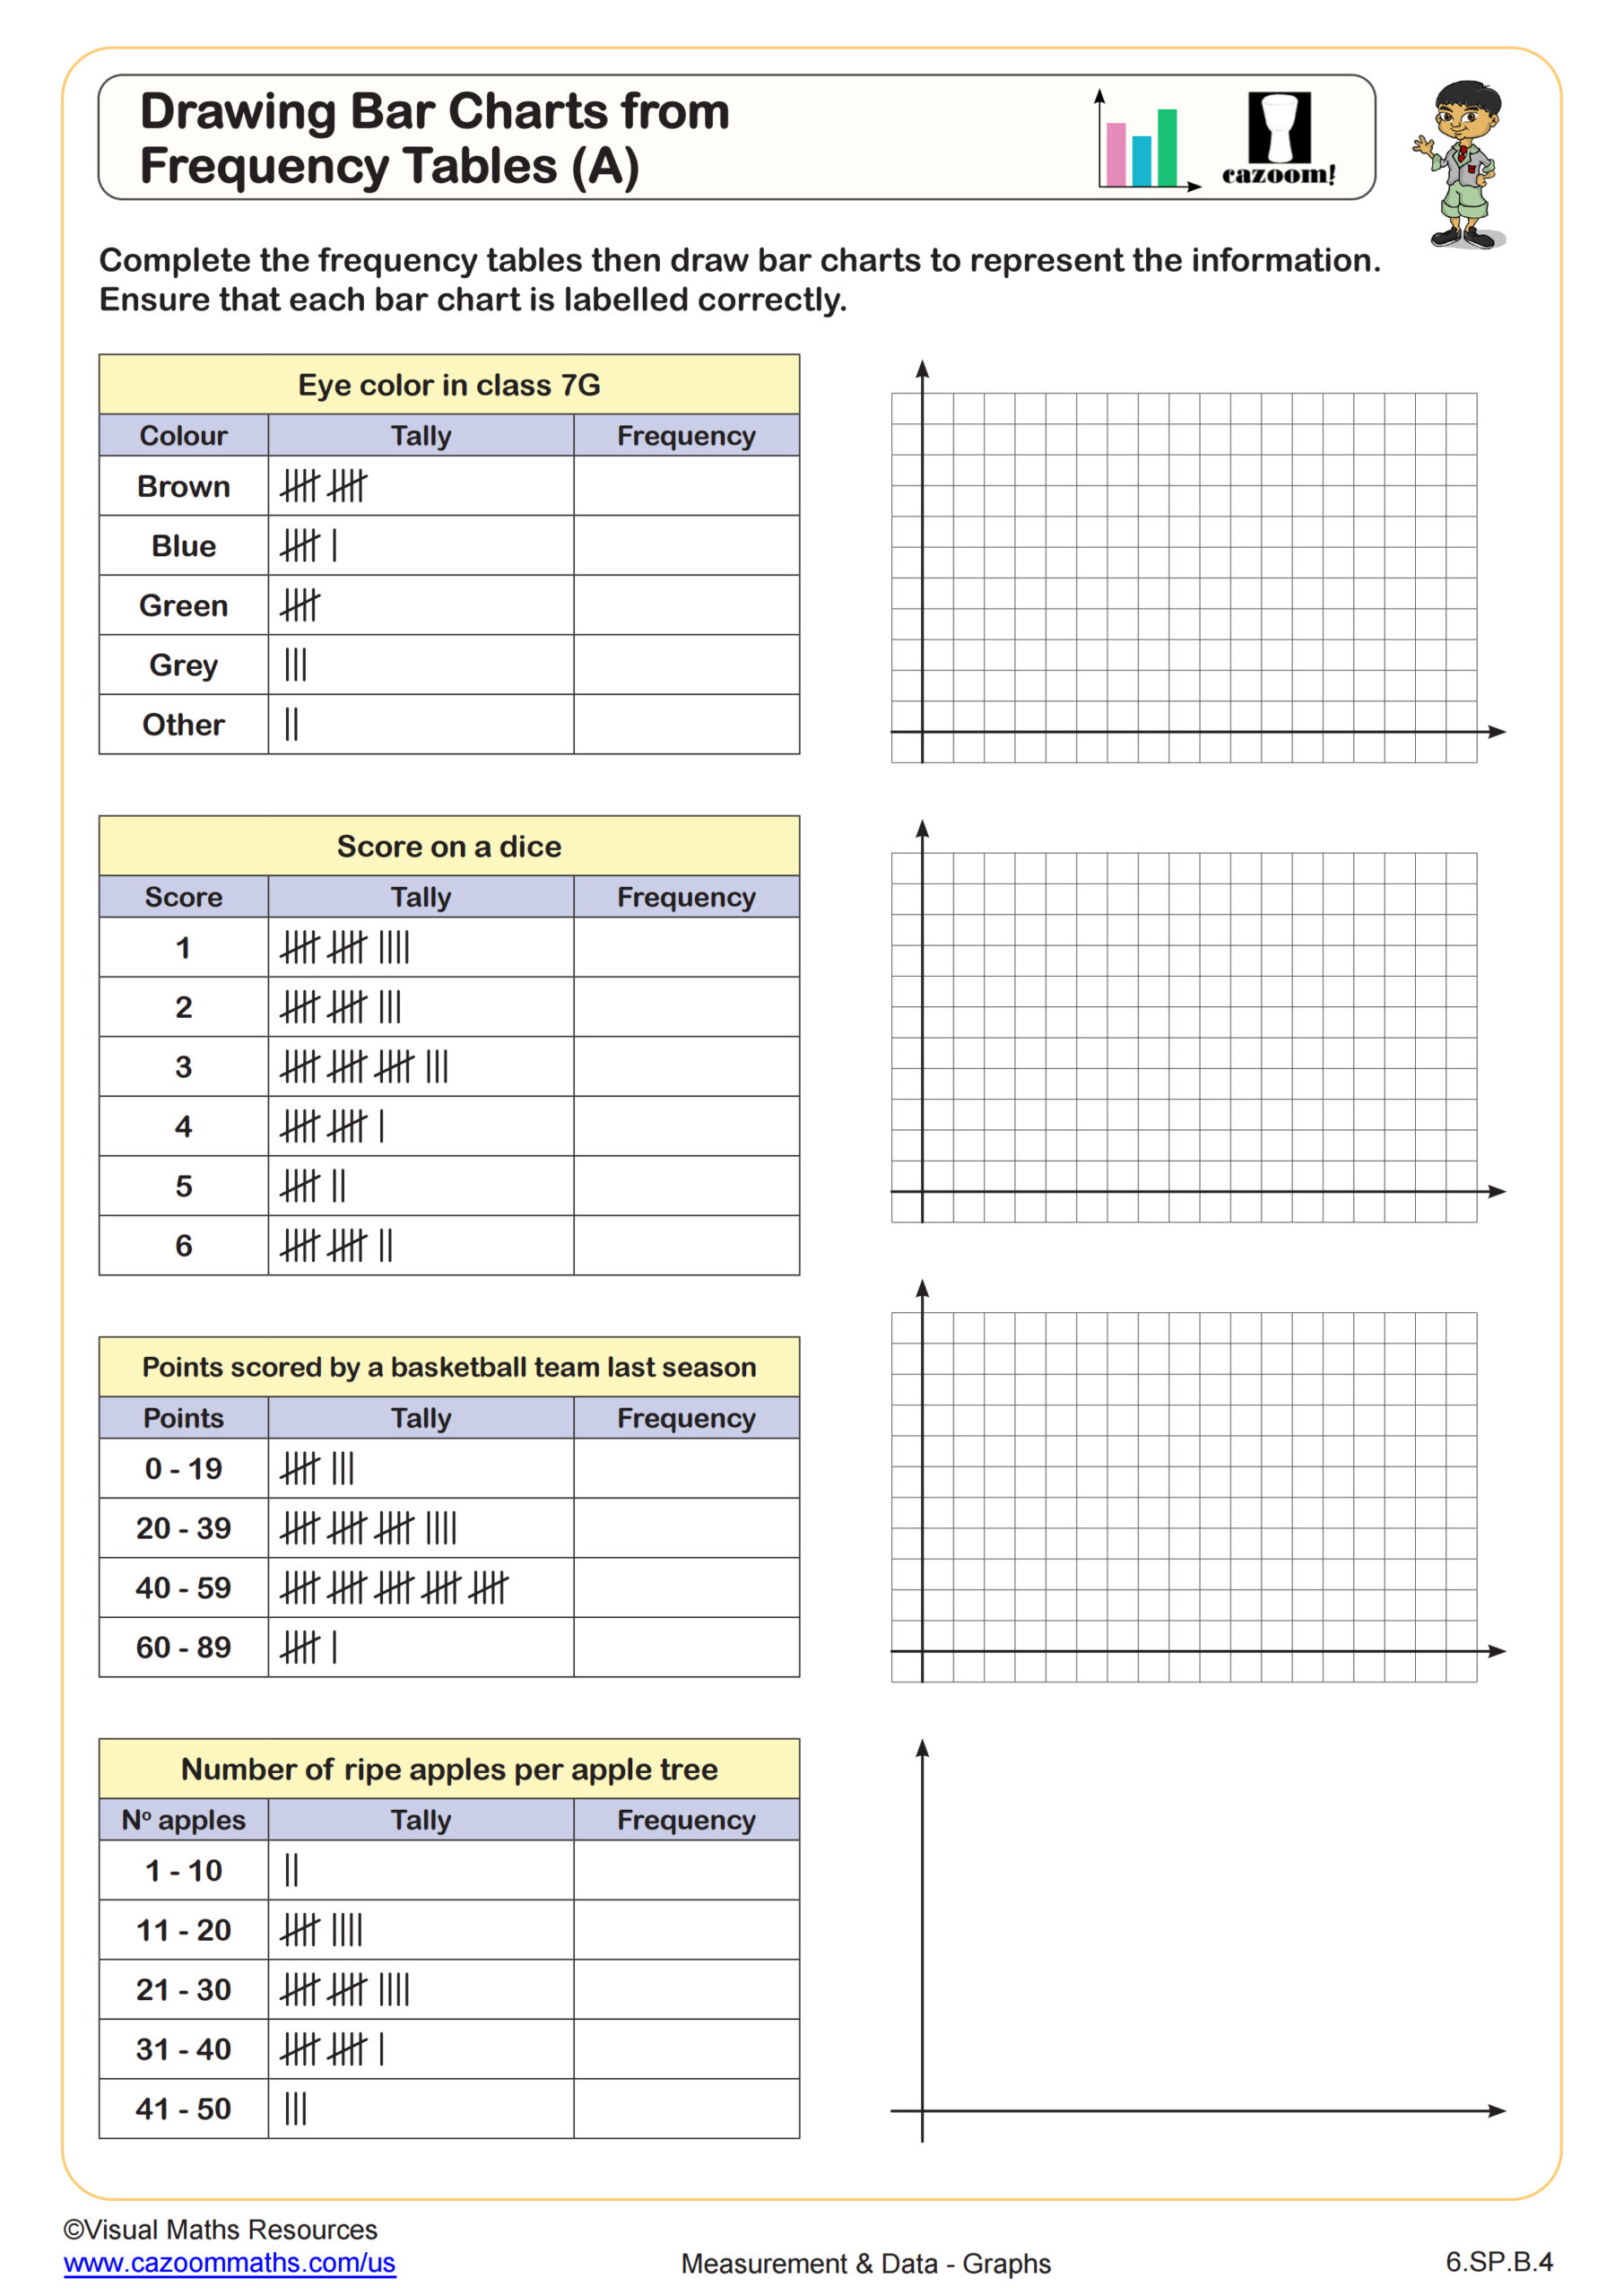
Drawing Bar Graphs from Frequency Tables (B) WORKSHEET
Suitable for Grades: 6th Grade
CCSS: 6.SP.B.4
CCSS Description: Display numerical data in plots on a number line, including dot plots, histograms, and box plots.
Drawing Bar Graphs from Frequency Tables (B) WORKSHEET DESCRIPTION
This worksheet can be used alongside Drawing Bar Graphs from Frequency Tables (A). It provides two sets of data for which tally charts and bar charts are to be produced. Empty tally charts and axes are provided. The importance of correct scales and labelling can be highlighted during this task.
All worksheets are created by the team of experienced teachers at Cazoom Math.
 Worksheet")
RELATED TO Drawing Bar Graphs from Frequency Tables (B) WORKSHEET
Frequently Asked Questions
This drawing bar graphs from frequency tables (b) worksheet is designed for students in 6th Grade and aligns with Common Core State Standards.