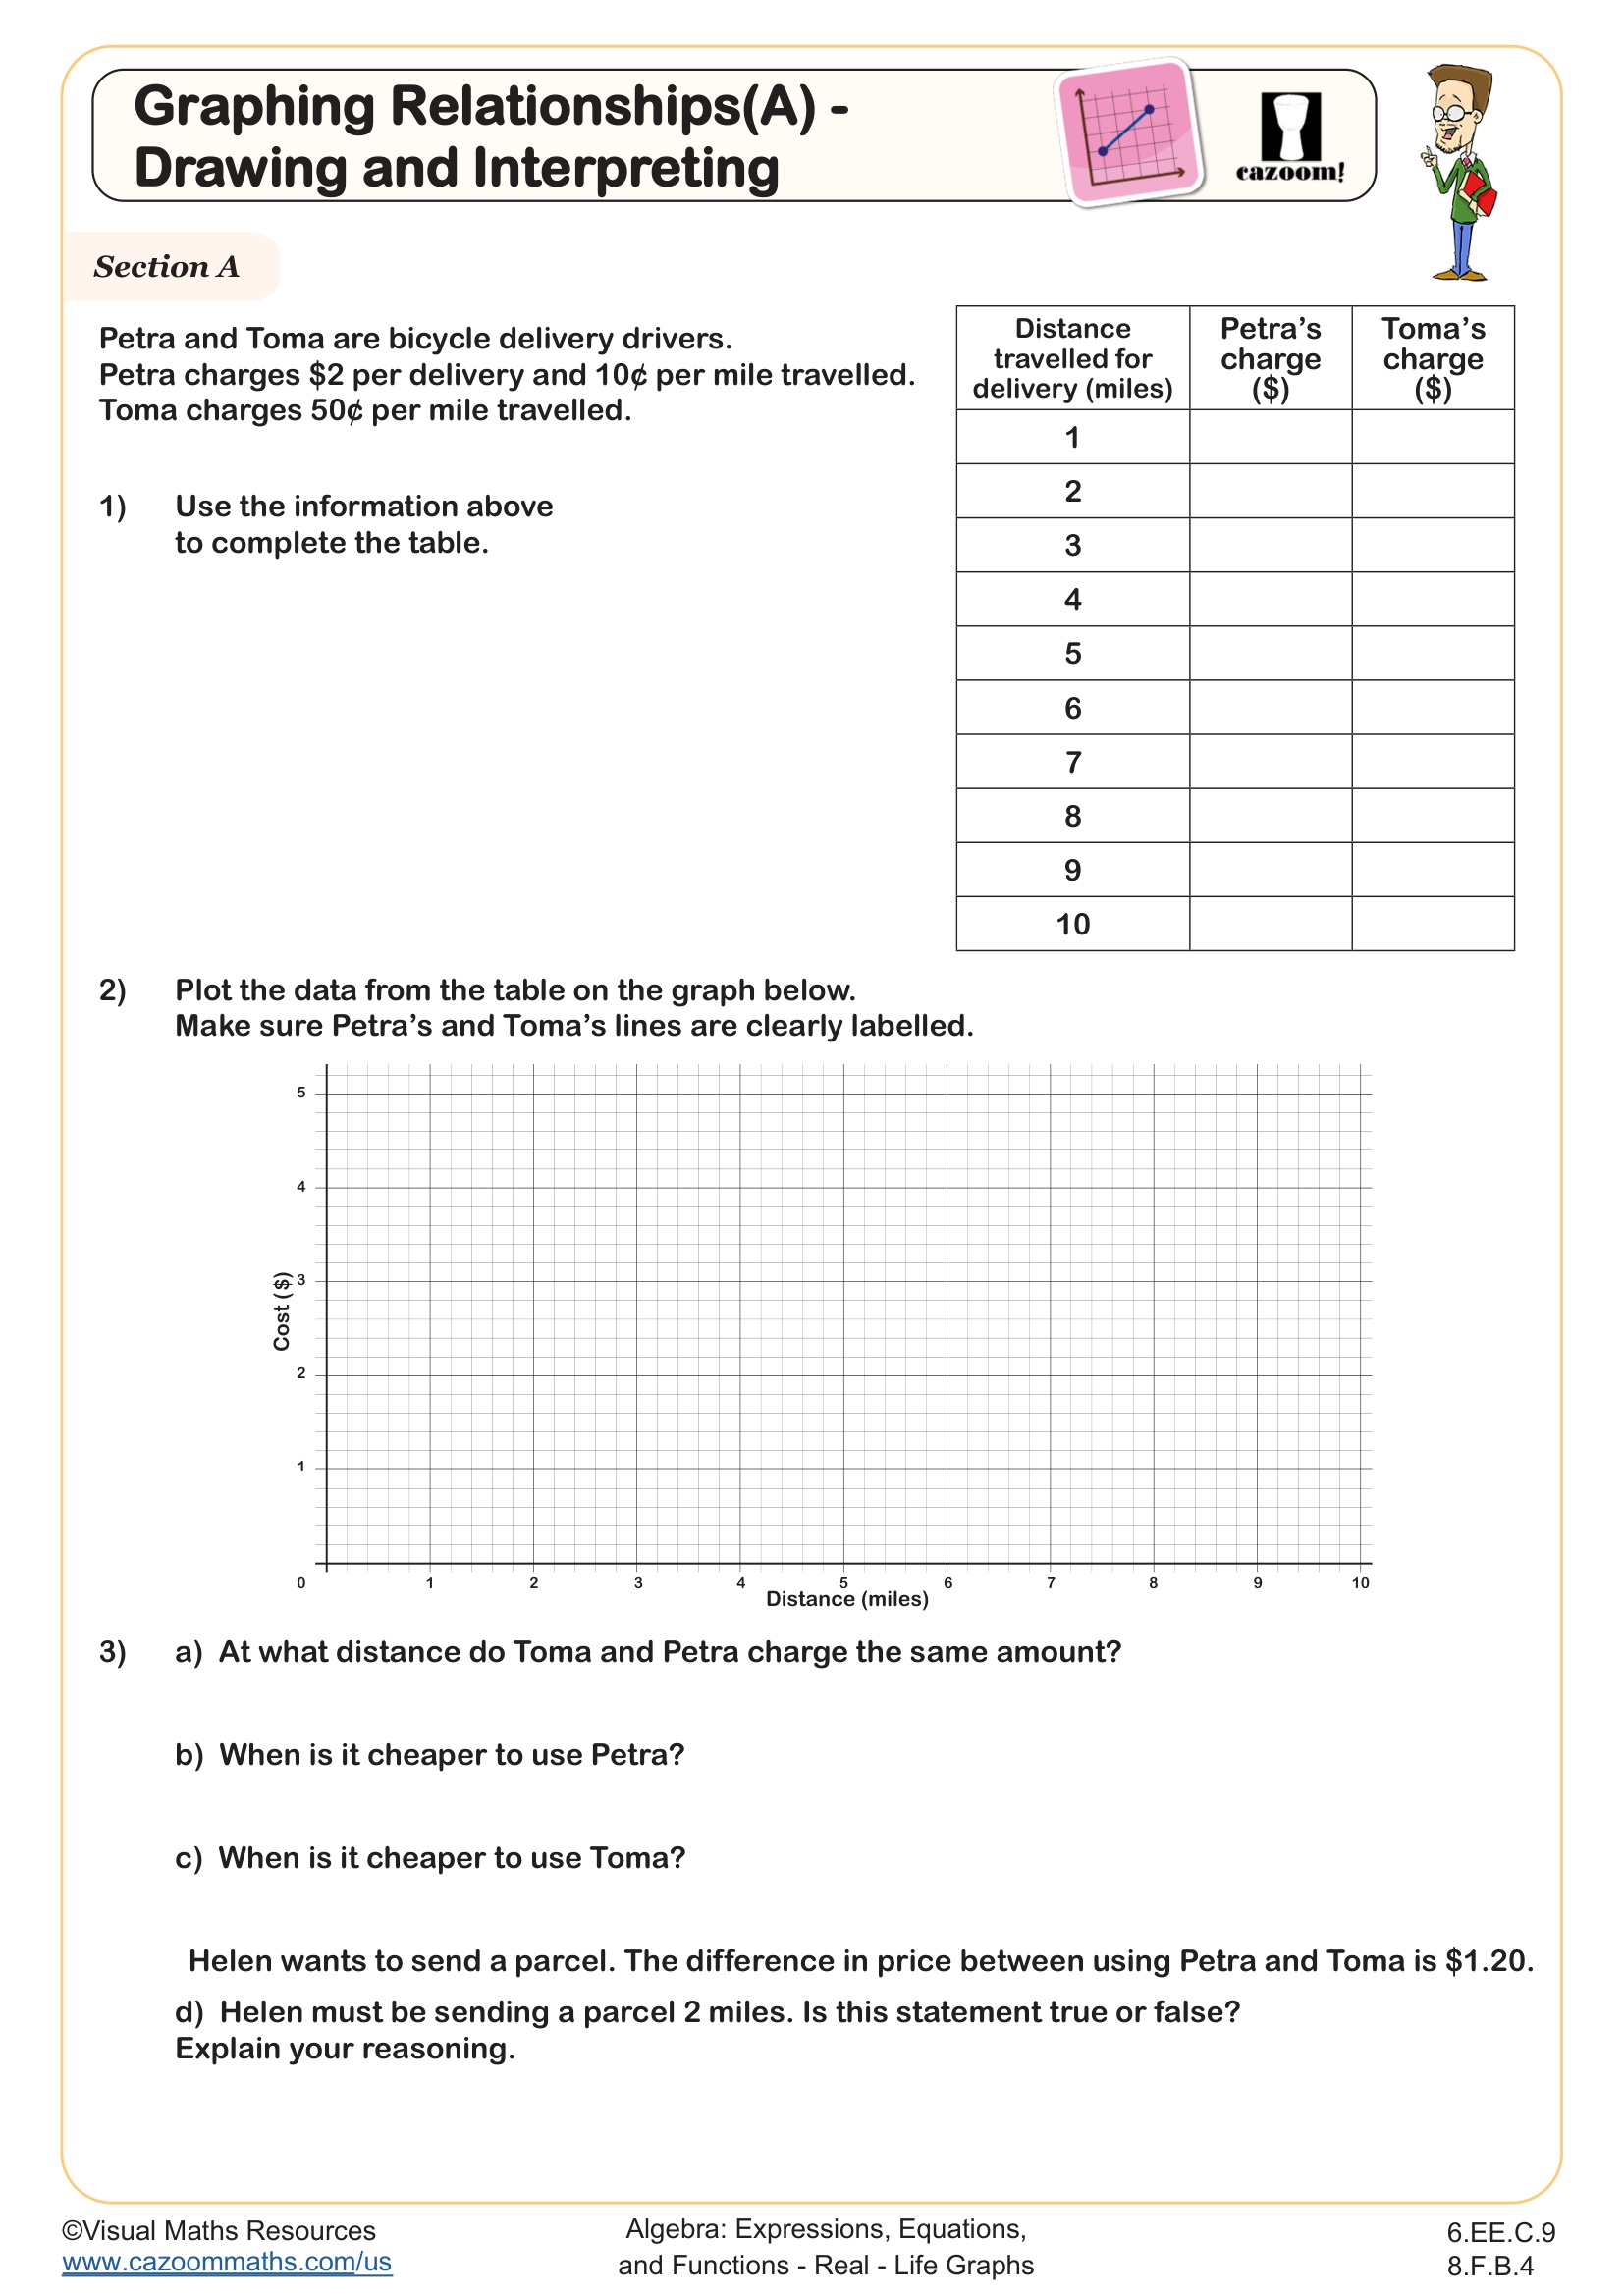
Drawing Conversion Graphs WORKSHEET
Use the equation of a linear model to solve problems in the context of bivariate measurement data, interpreting the slope and intercept. For example, in a linear model for a biology experiment, interpret a slope of 1.5 cm/hr as meaning that an additional hour of sunlight each day is associated with an additional 1.5 cm in mature plant height.
Drawing Conversion Graphs WORKSHEET DESCRIPTION
Learners will plot four different conversion graphs across this worksheet.
In question 1, students will plot a graph showing the equivalence between liters and pints. They will complete a table of values before plotting these points on pre-drawn axes.
Next, in question 2, pupils will use the fact that 1 kg ≈ 2.2 pounds to draw a conversion graph.
The graph in question 3 will show the currency conversion between € and $. This time, students are required to label the y-axis appropriately.
Lastly, students will use the approximate formula for converting between degrees Celsius and Fahrenheit to draw a conversion graph in question 4. Again, learners are required to label the y-axis before drawing the graph.
All worksheets are created by the team of experienced teachers at Cazoom Math.

RELATED TO Drawing Conversion Graphs WORKSHEET
Frequently Asked Questions
This worksheet is designed for 7th and 8th grade students who are learning about ratios and proportional relationships. The drawing conversion graphs activities align well with middle school standards where students explore how quantities relate to each other through graphical representations.