Drawing Gradients (A) WORKSHEET
Construct linear and exponential functions, including arithmetic and geometric sequences, given a graph, a description of a relationship, or two input‑output pairs (include reading these from a table).
Drawing Gradients (A) WORKSHEET DESCRIPTION
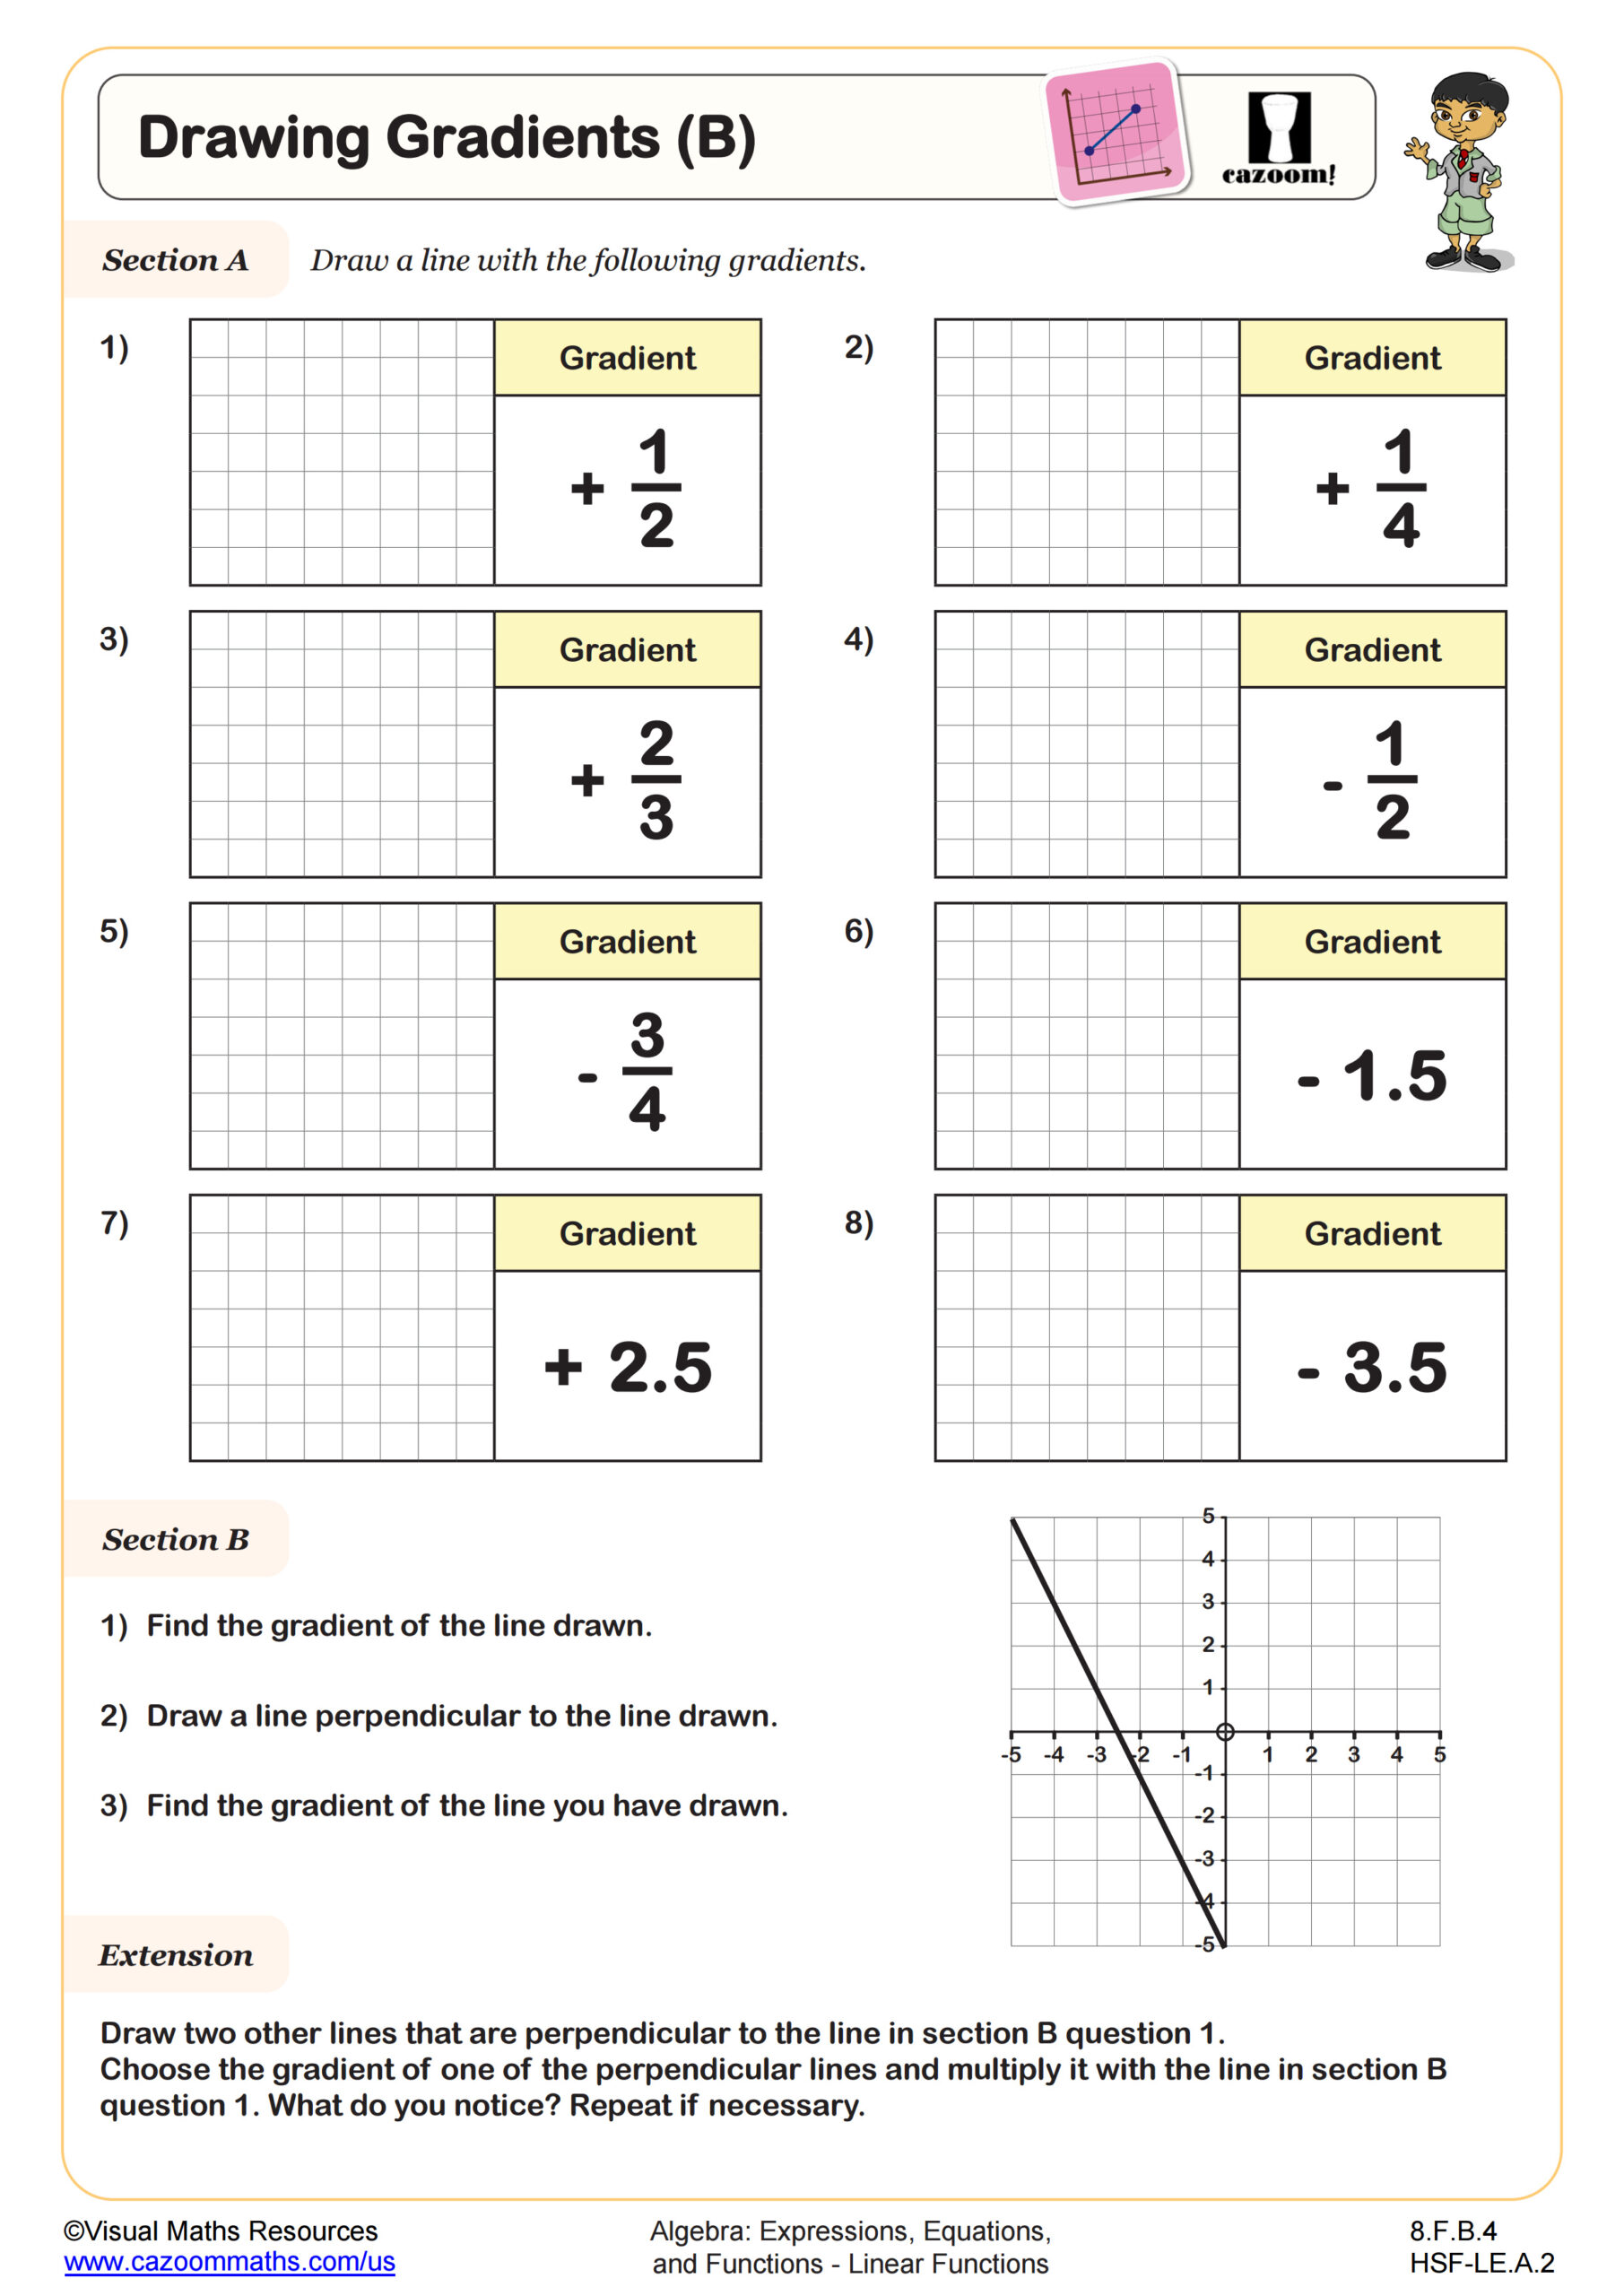
This worksheet focuses on drawing straight lines with positive and negative integer slopes on square grids. Start your students here before moving on to drawing slopes on axes or plotting straight lines using the slope and y intercept.
Ensure students use a pencil and ruler as they draw eight straight lines on separate square grids in section A. Gradients include +1, -5, +4, and more. In section B, learners will progress to drawing four straight lines with a given gradient on one coordinate grid.
If your students are already familiar with the equations of straight line graphs, they can complete section C too. Here, they will write down the equation of each line they have drawn in section B.
All worksheets are created by the team of experienced teachers at Cazoom Math.
 Worksheet")
RELATED TO Drawing Gradients (A) WORKSHEET
Frequently Asked Questions
This drawing gradients (a) worksheet is designed for students in 8th Grade and Algebra I and aligns with Common Core State Standards.