Drawing Gradients (B) WORKSHEET
Construct linear and exponential functions, including arithmetic and geometric sequences, given a graph, a description of a relationship, or two input‑output pairs (include reading these from a table).
Drawing Gradients (B) WORKSHEET DESCRIPTION
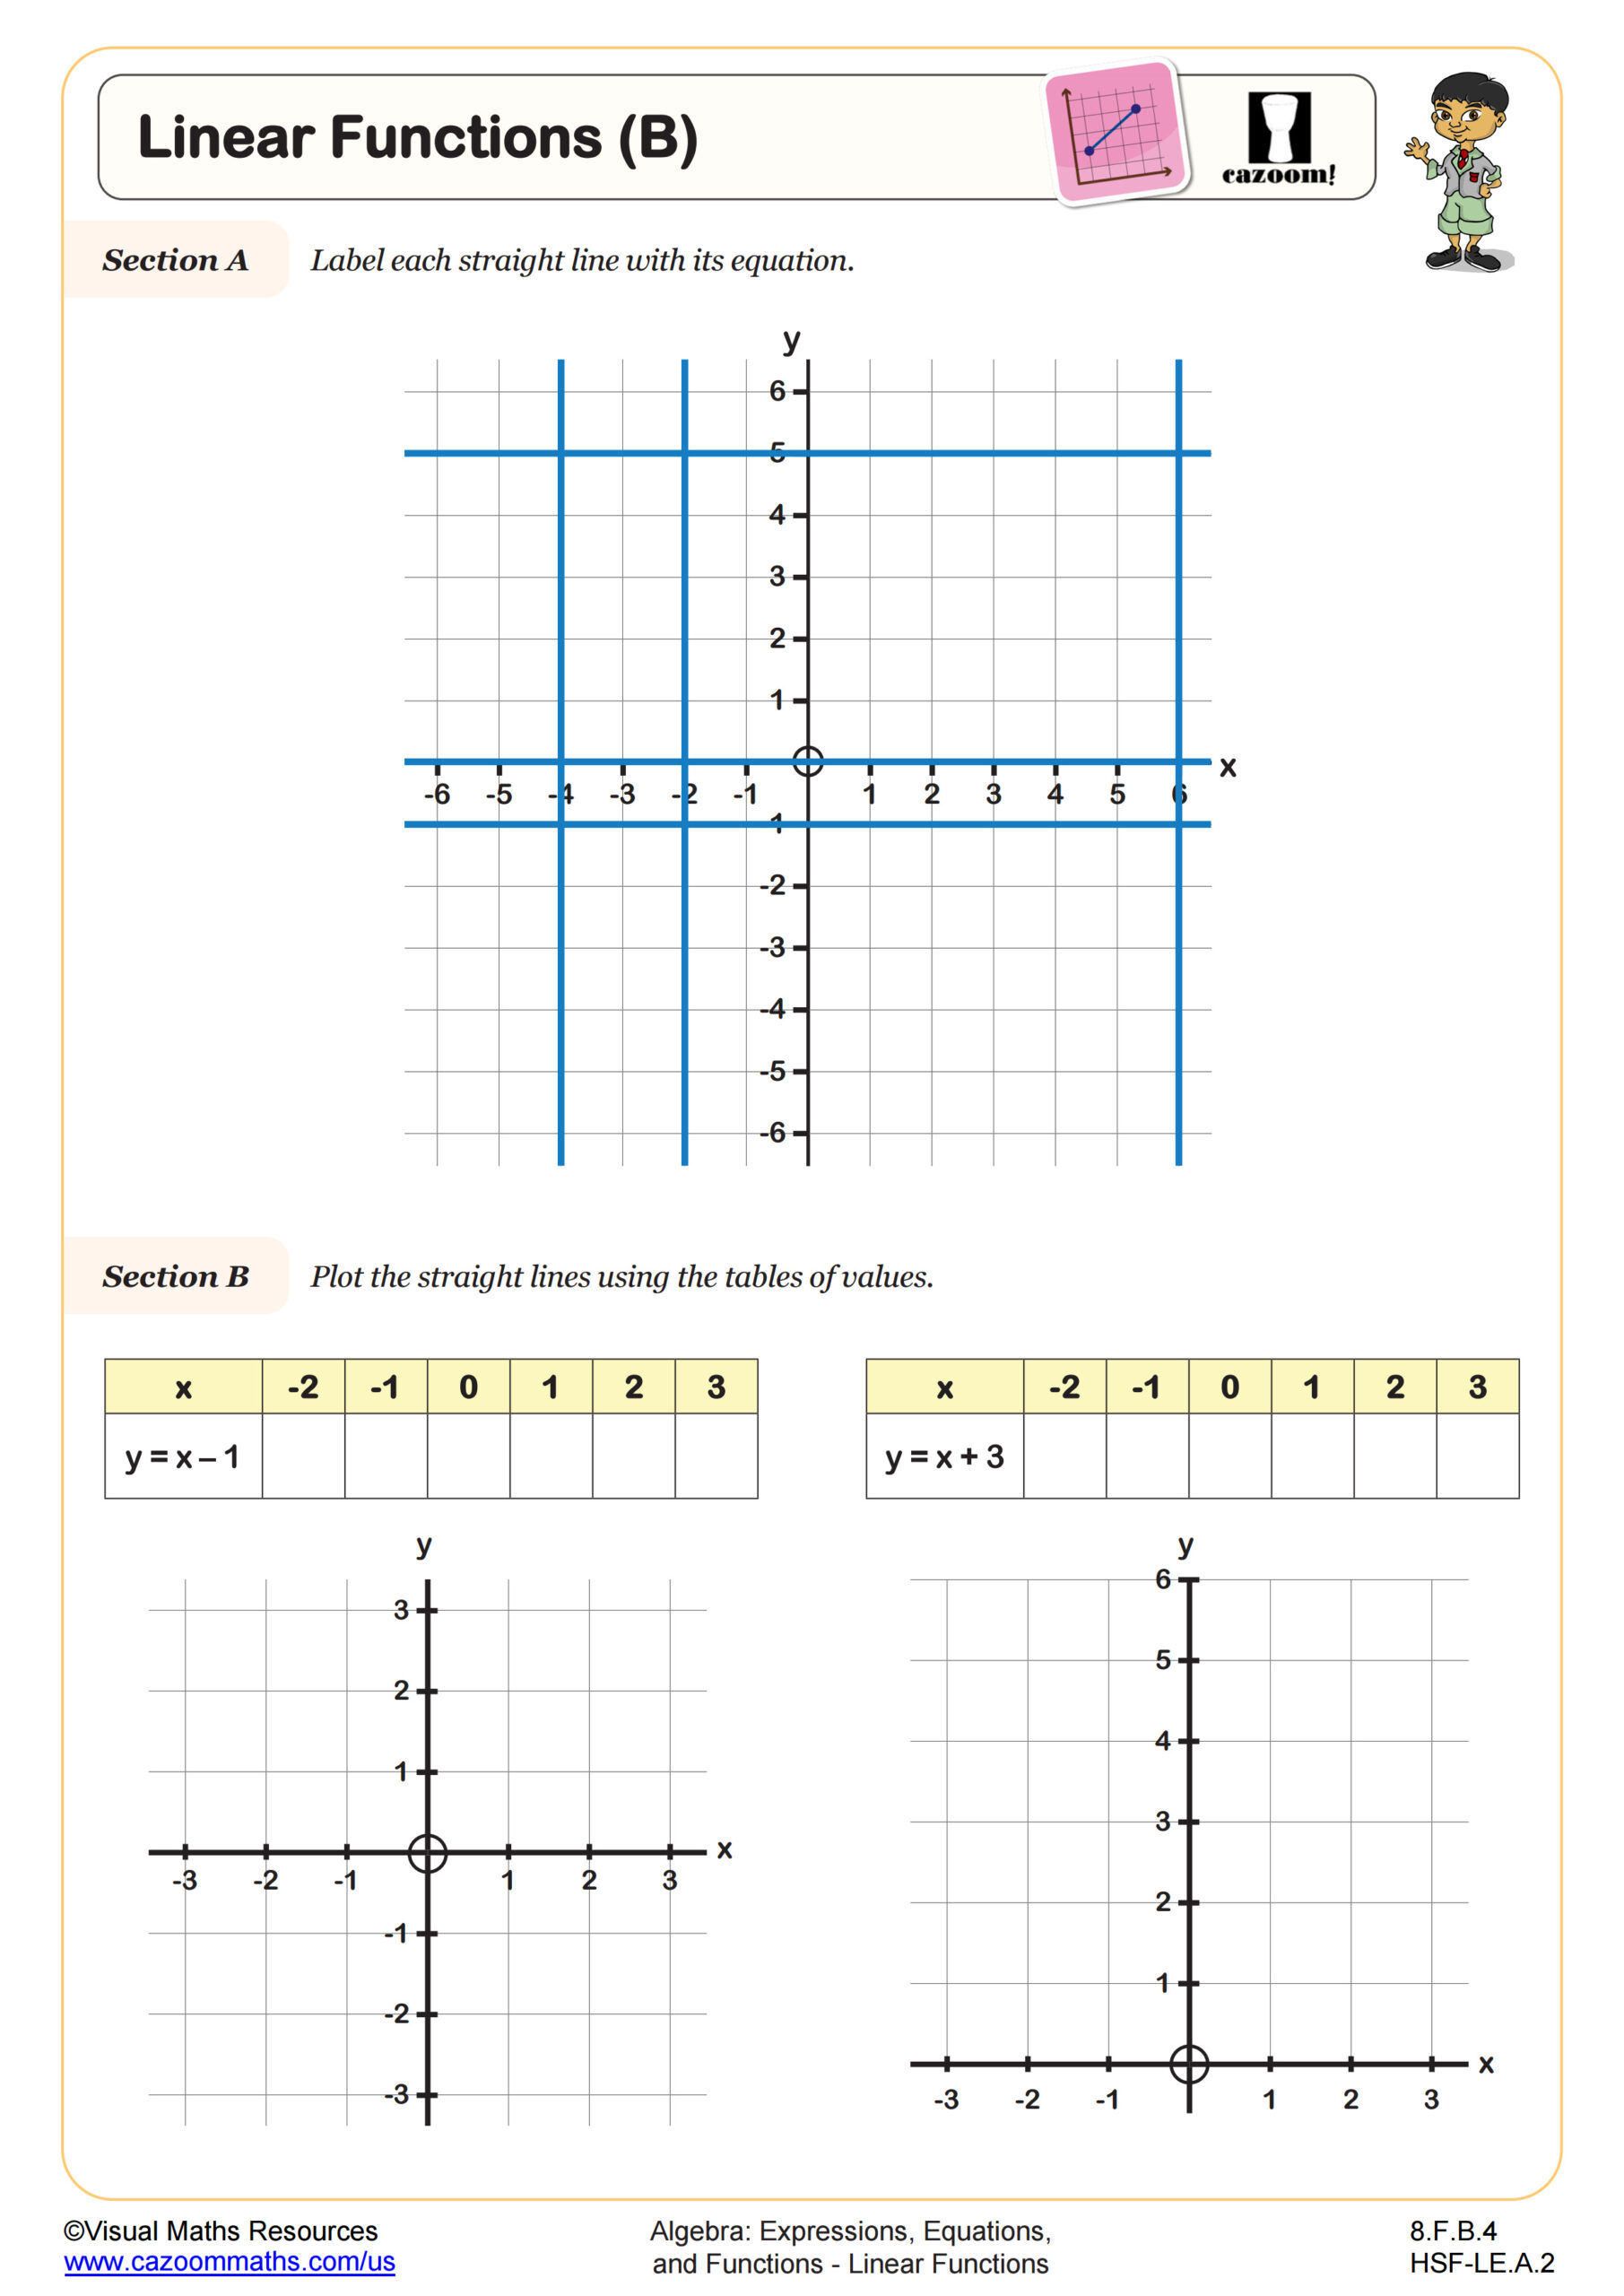
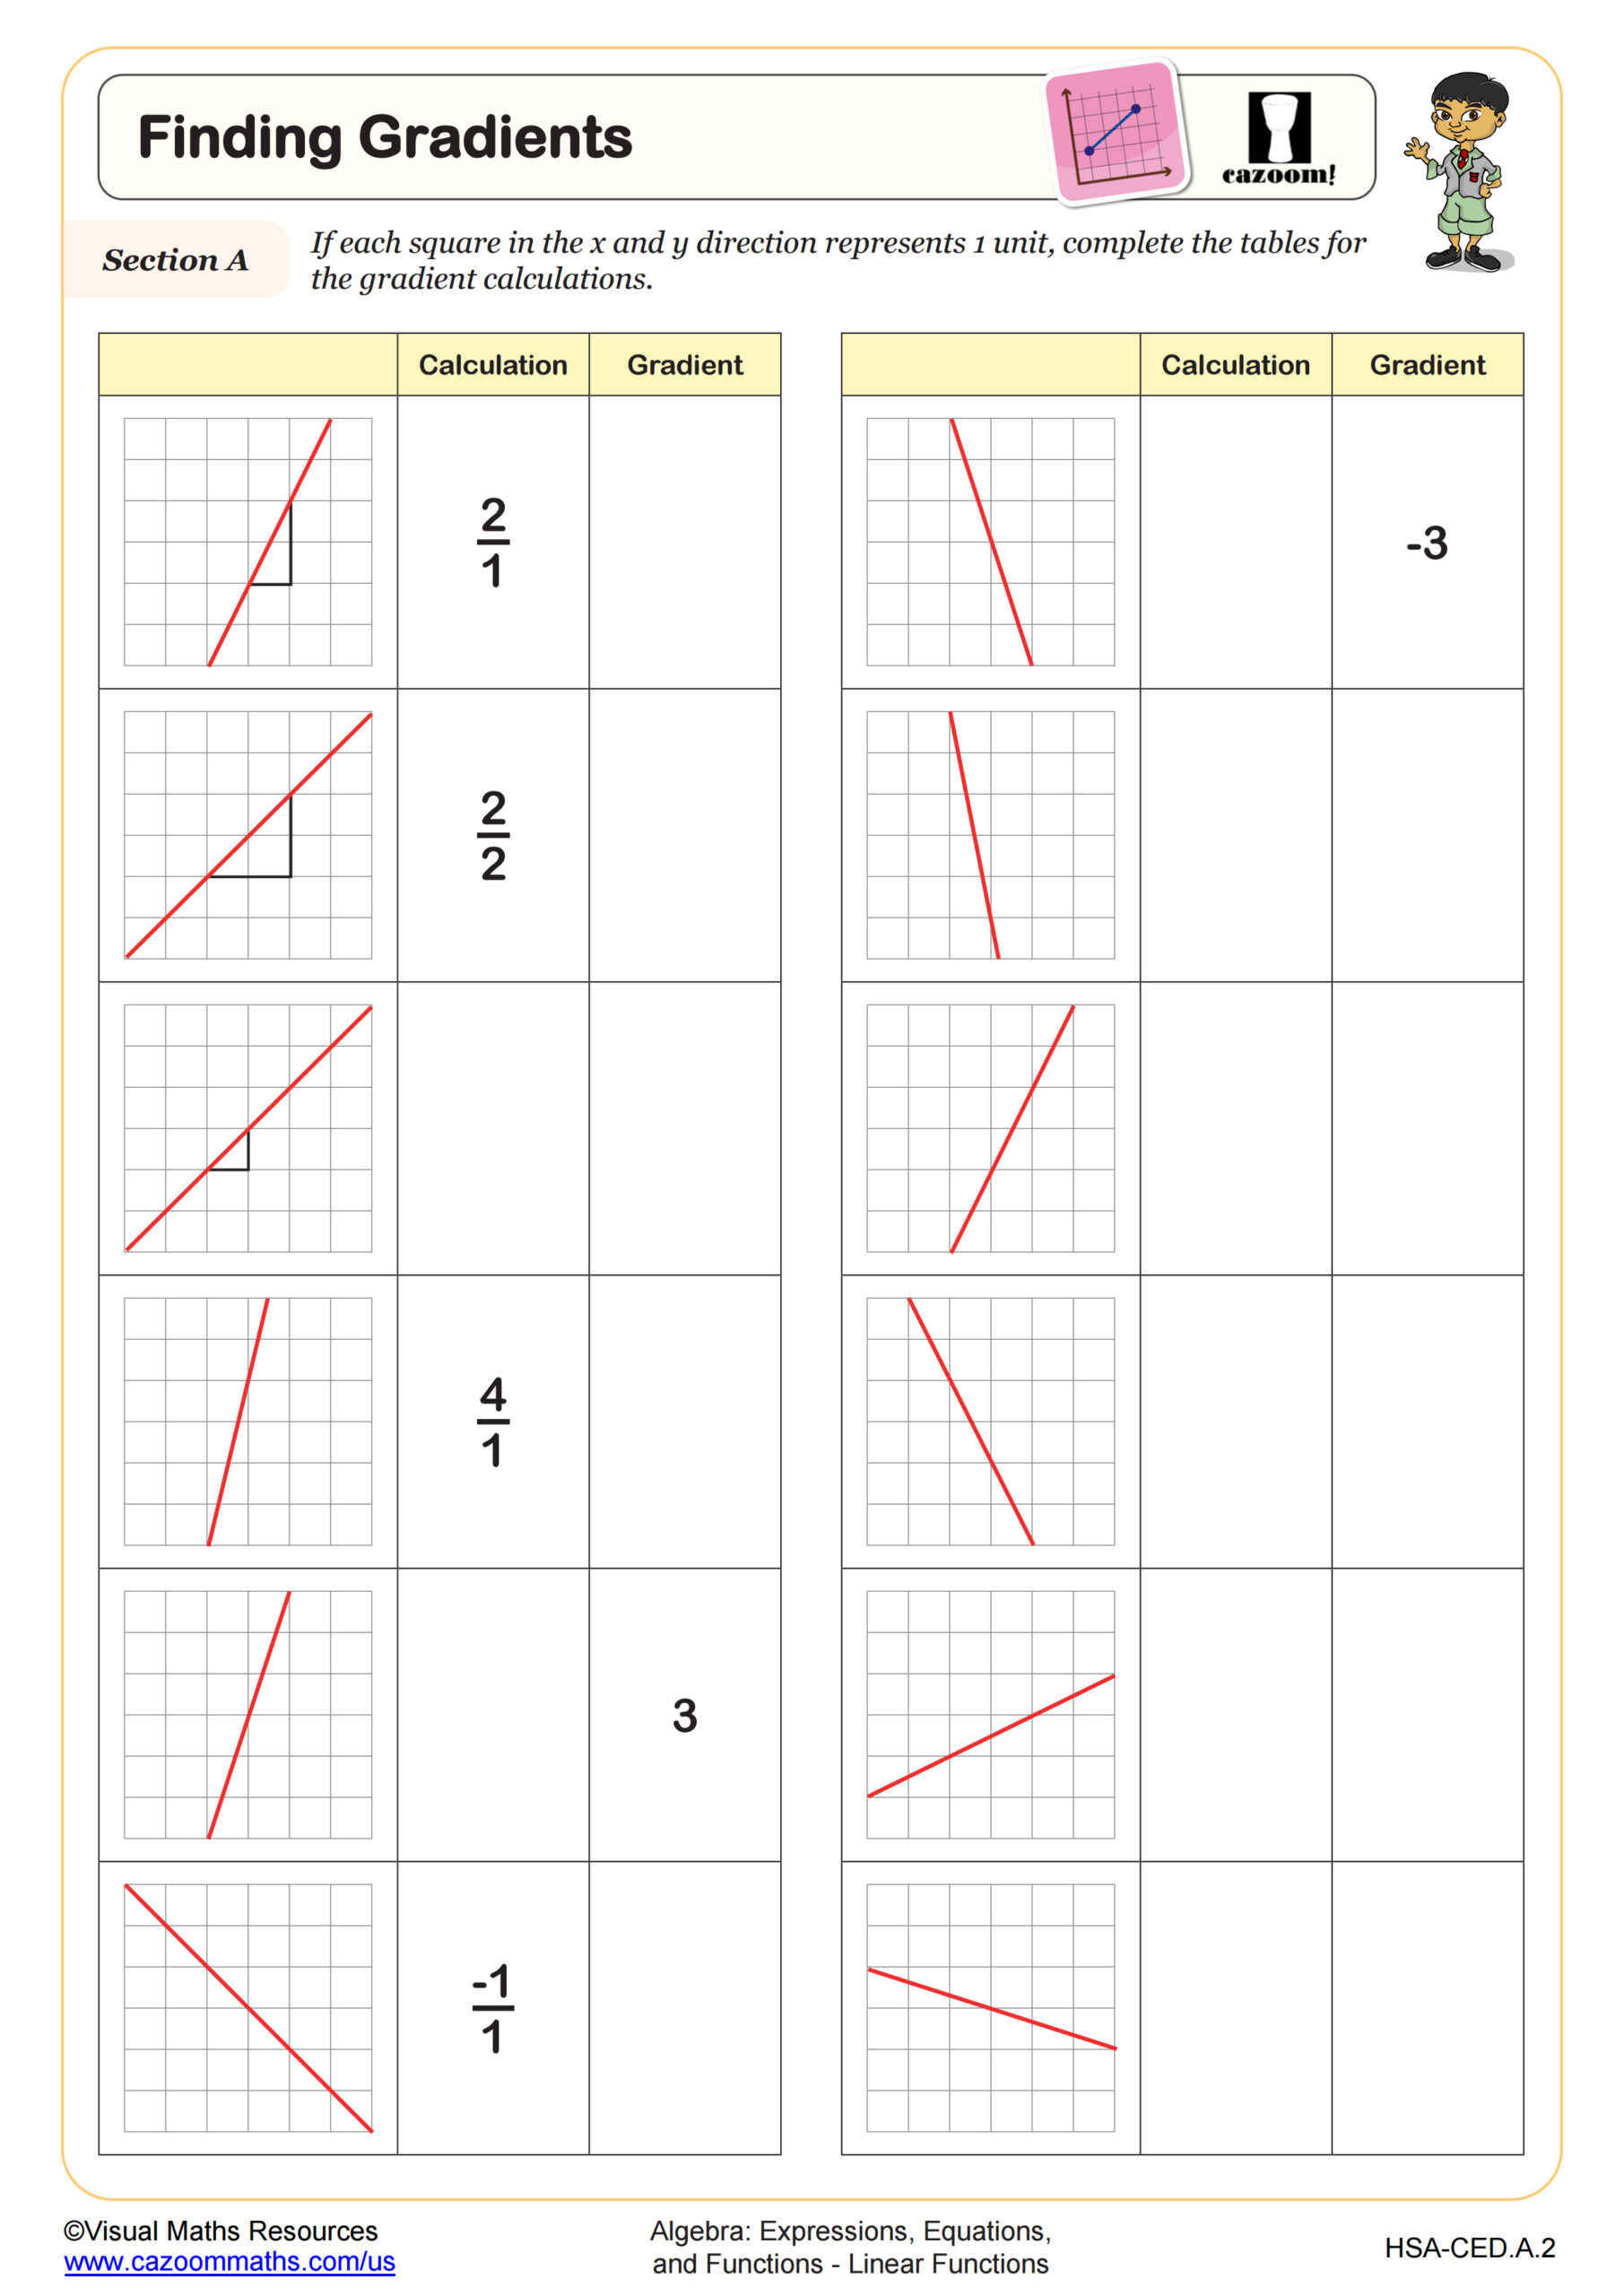
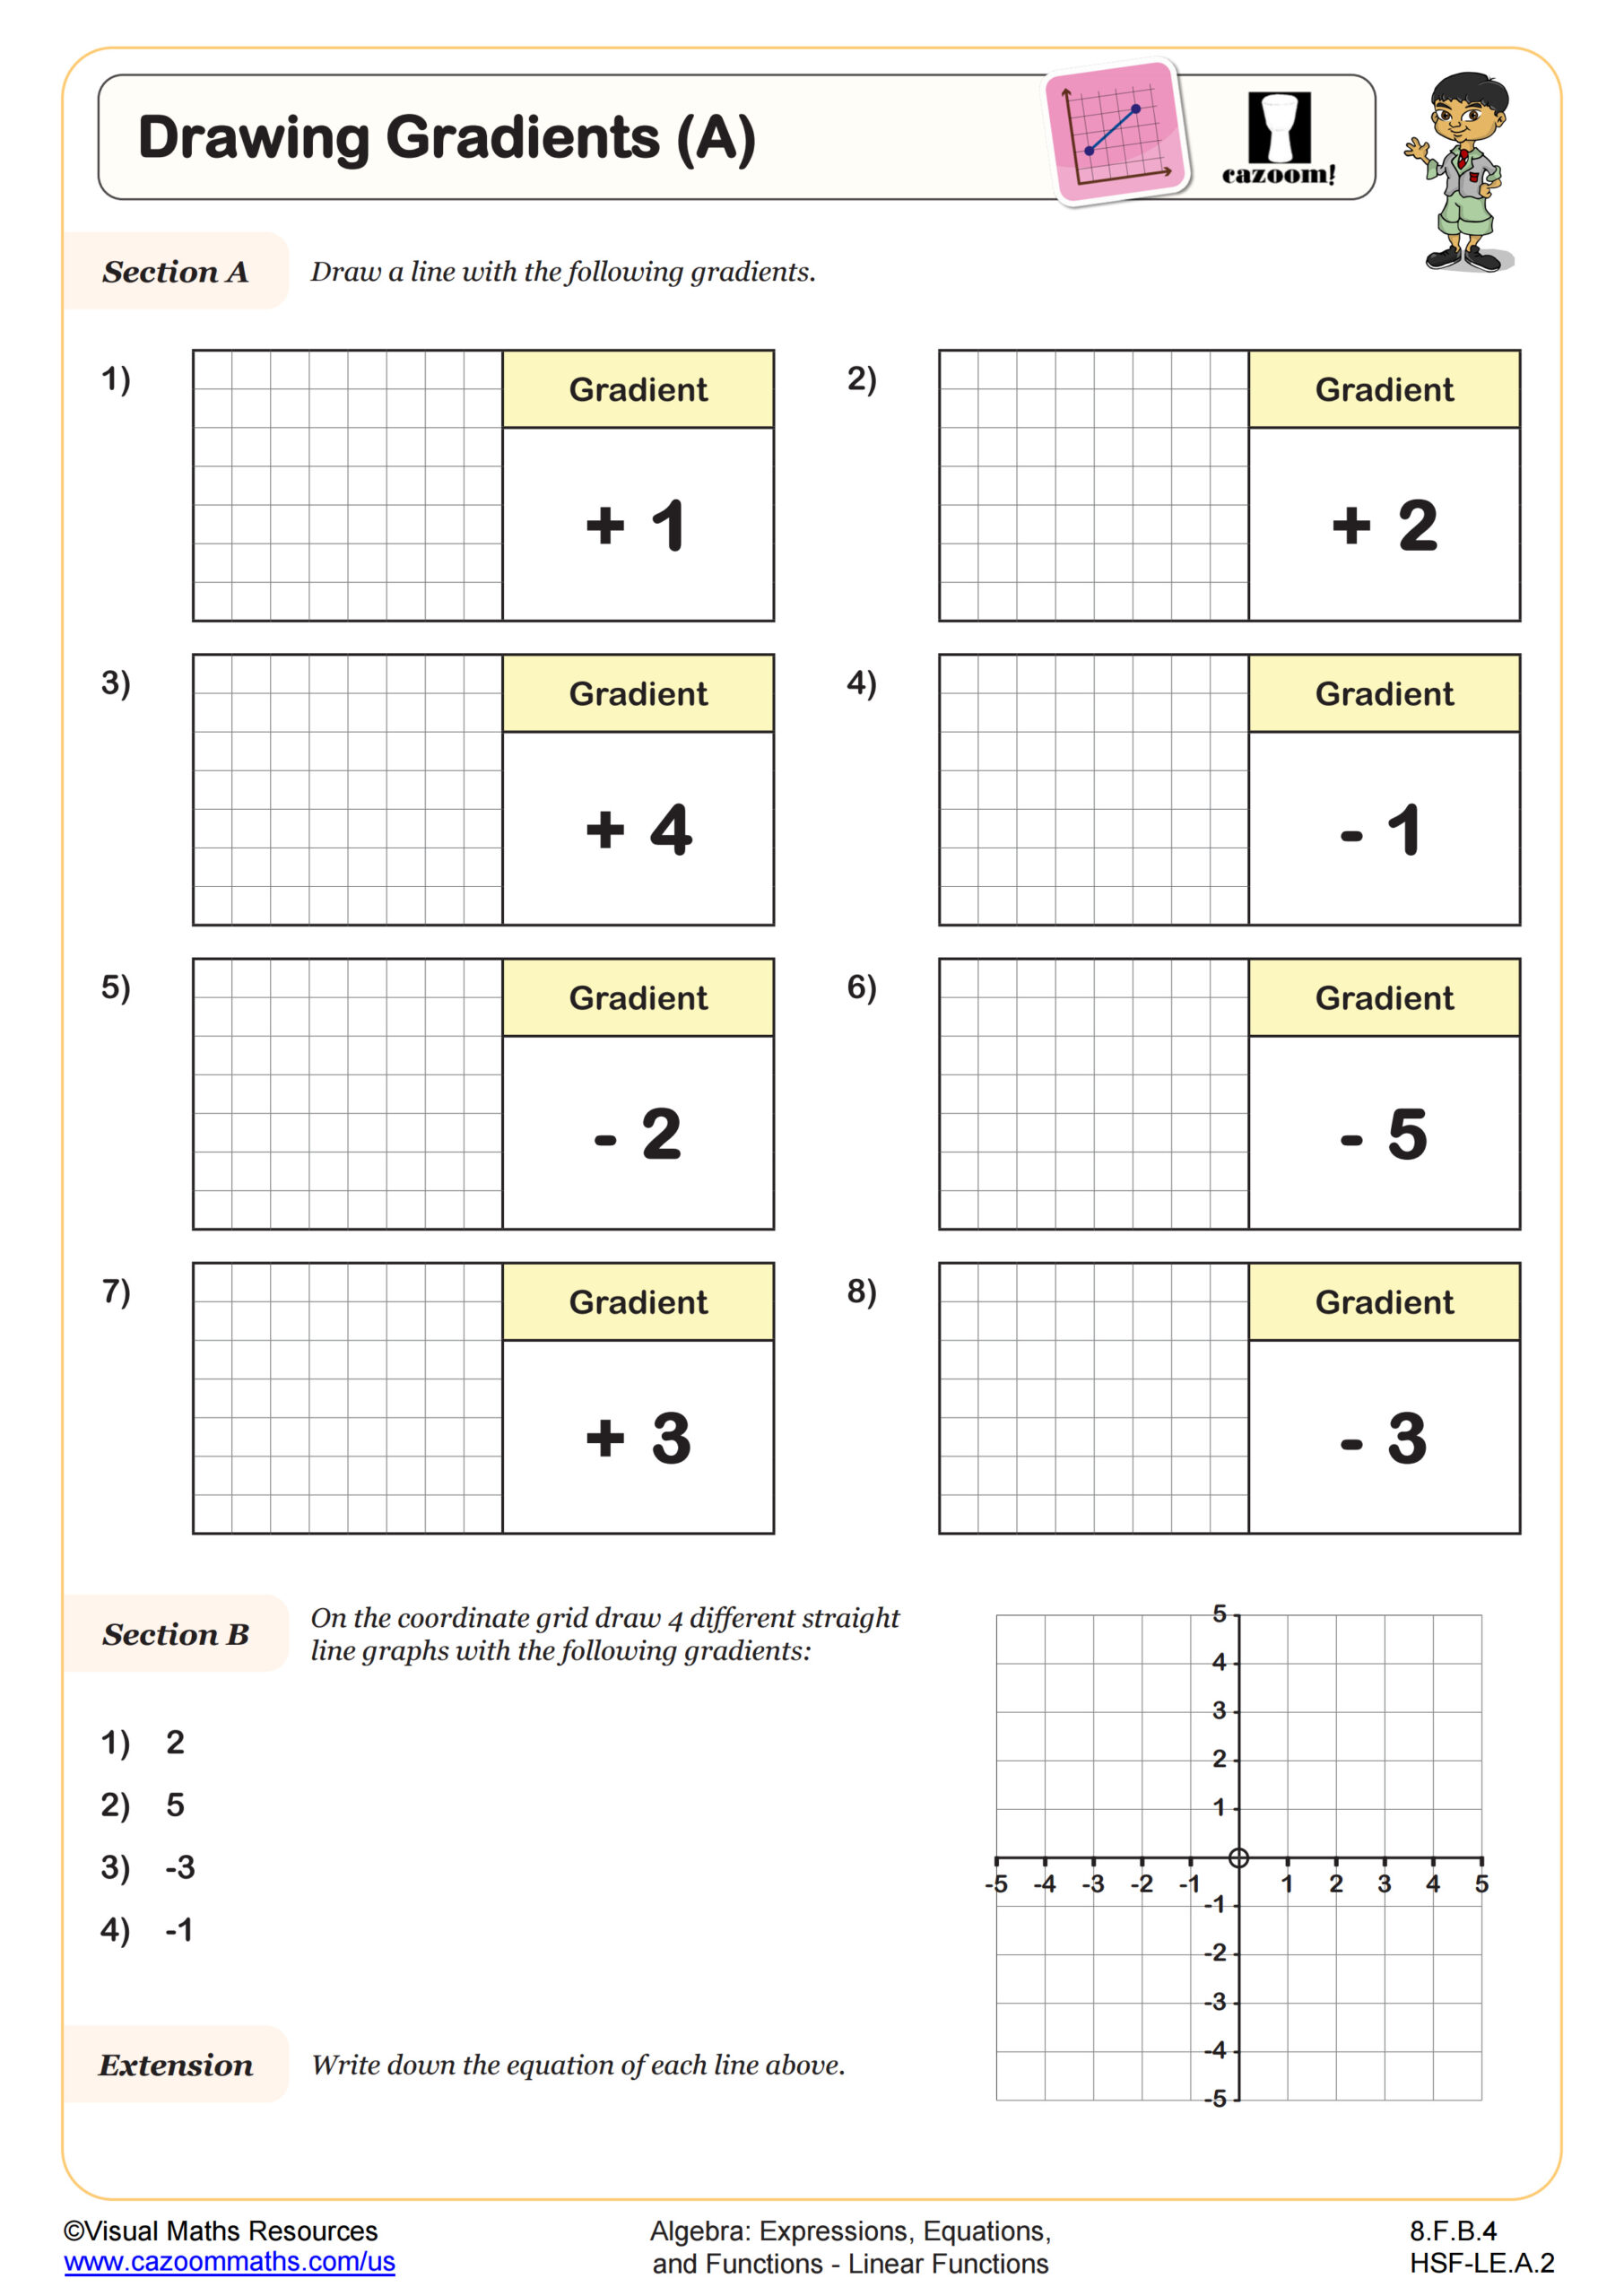
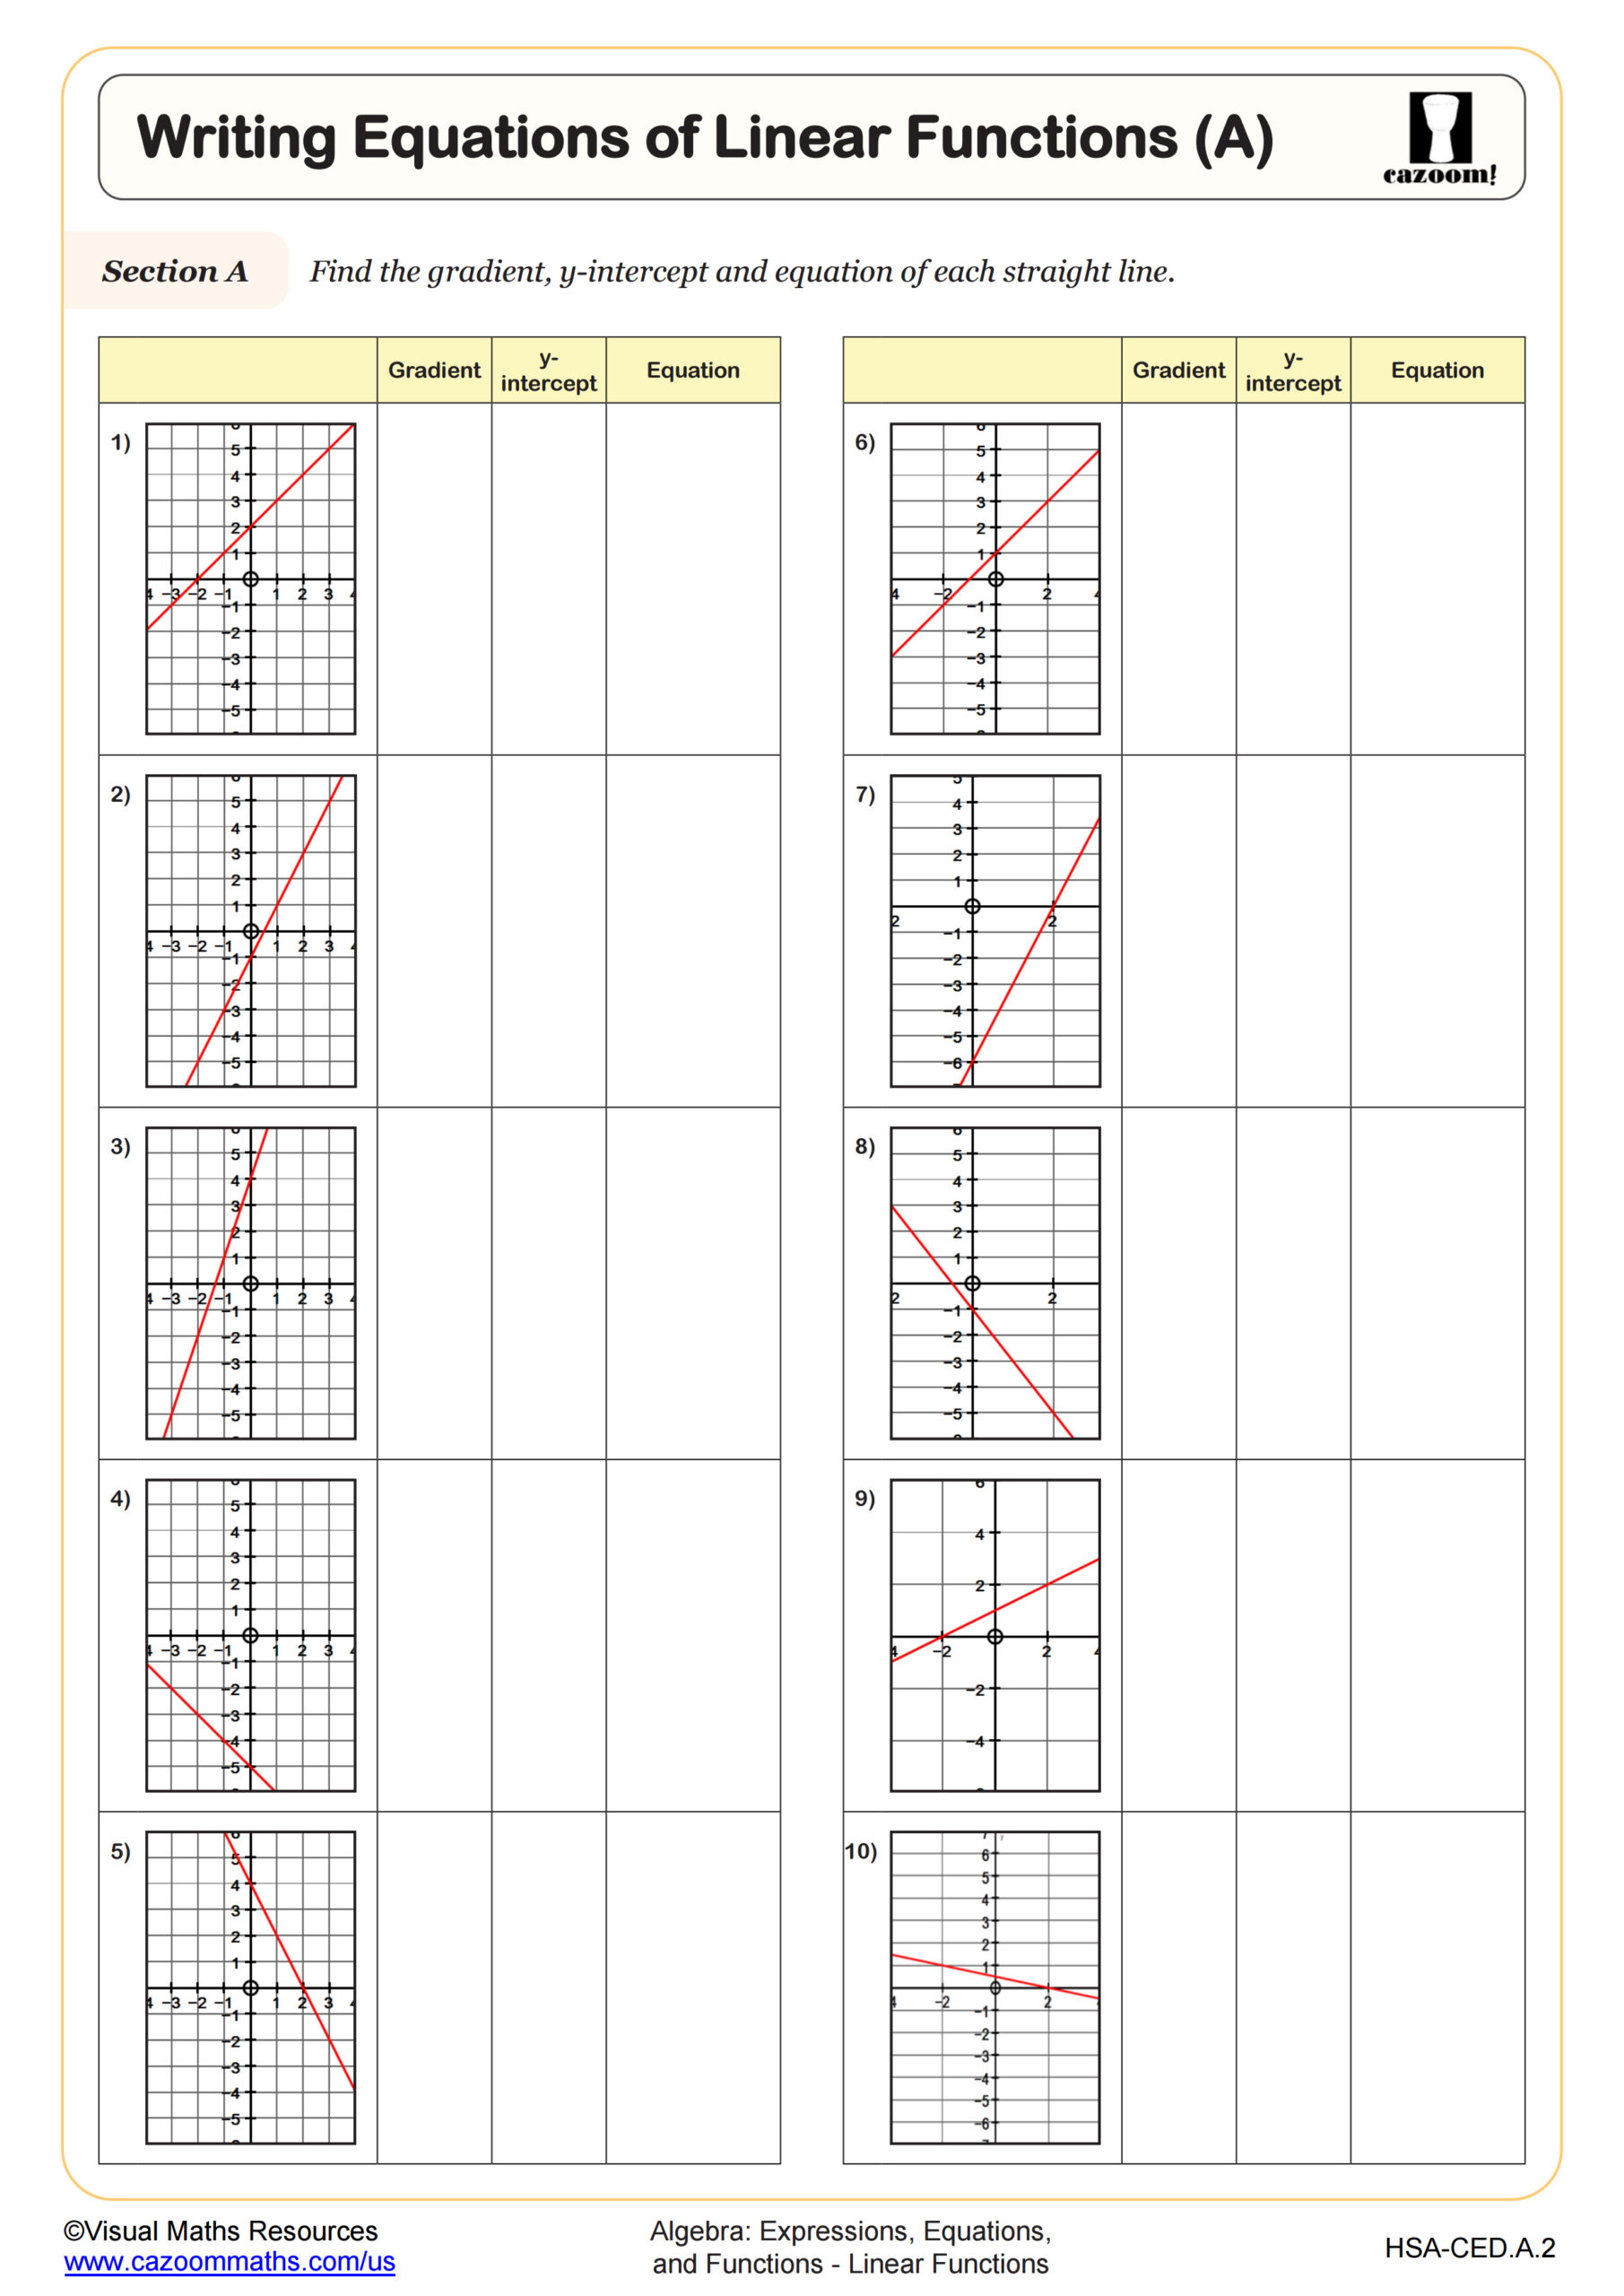
This worksheet focuses on drawing straight lines with positive and negative fractional slopes on square grids. Start your students here before moving on to drawing slopes on axes or plotting straight lines using the slope and y intercept.
Ensure students use a pencil and ruler as they draw eight straight lines on separate square grids in section A. Slopes are positive and negative and are in decimal and fraction form including 2/3 , -3.5, and more. In section B, learners will be introduced to perpendicular slopes. The extension investigates perpendicular lines further.
All worksheets are created by the team of experienced teachers at Cazoom Math.
 Worksheet")
RELATED TO Drawing Gradients (B) WORKSHEET
Frequently Asked Questions
This worksheet is designed for both 8th Grade and Algebra I students. The focus on fractional and decimal slopes, along with the introduction of perpendicular lines, aligns well with these grade levels where students are developing stronger algebraic thinking skills.