Back to:
Drawing Pictographs WORKSHEET
Suitable for Grades: 2nd Grade
CCSS: 2.MD.D.10
CCSS Description: Draw a picture graph and a bar graph (with single-unit scale) to represent a data set with up to four categories; solve simple put-together, take-apart, and compare problems using information presented in a bar graph.
Drawing Pictographs WORKSHEET DESCRIPTION
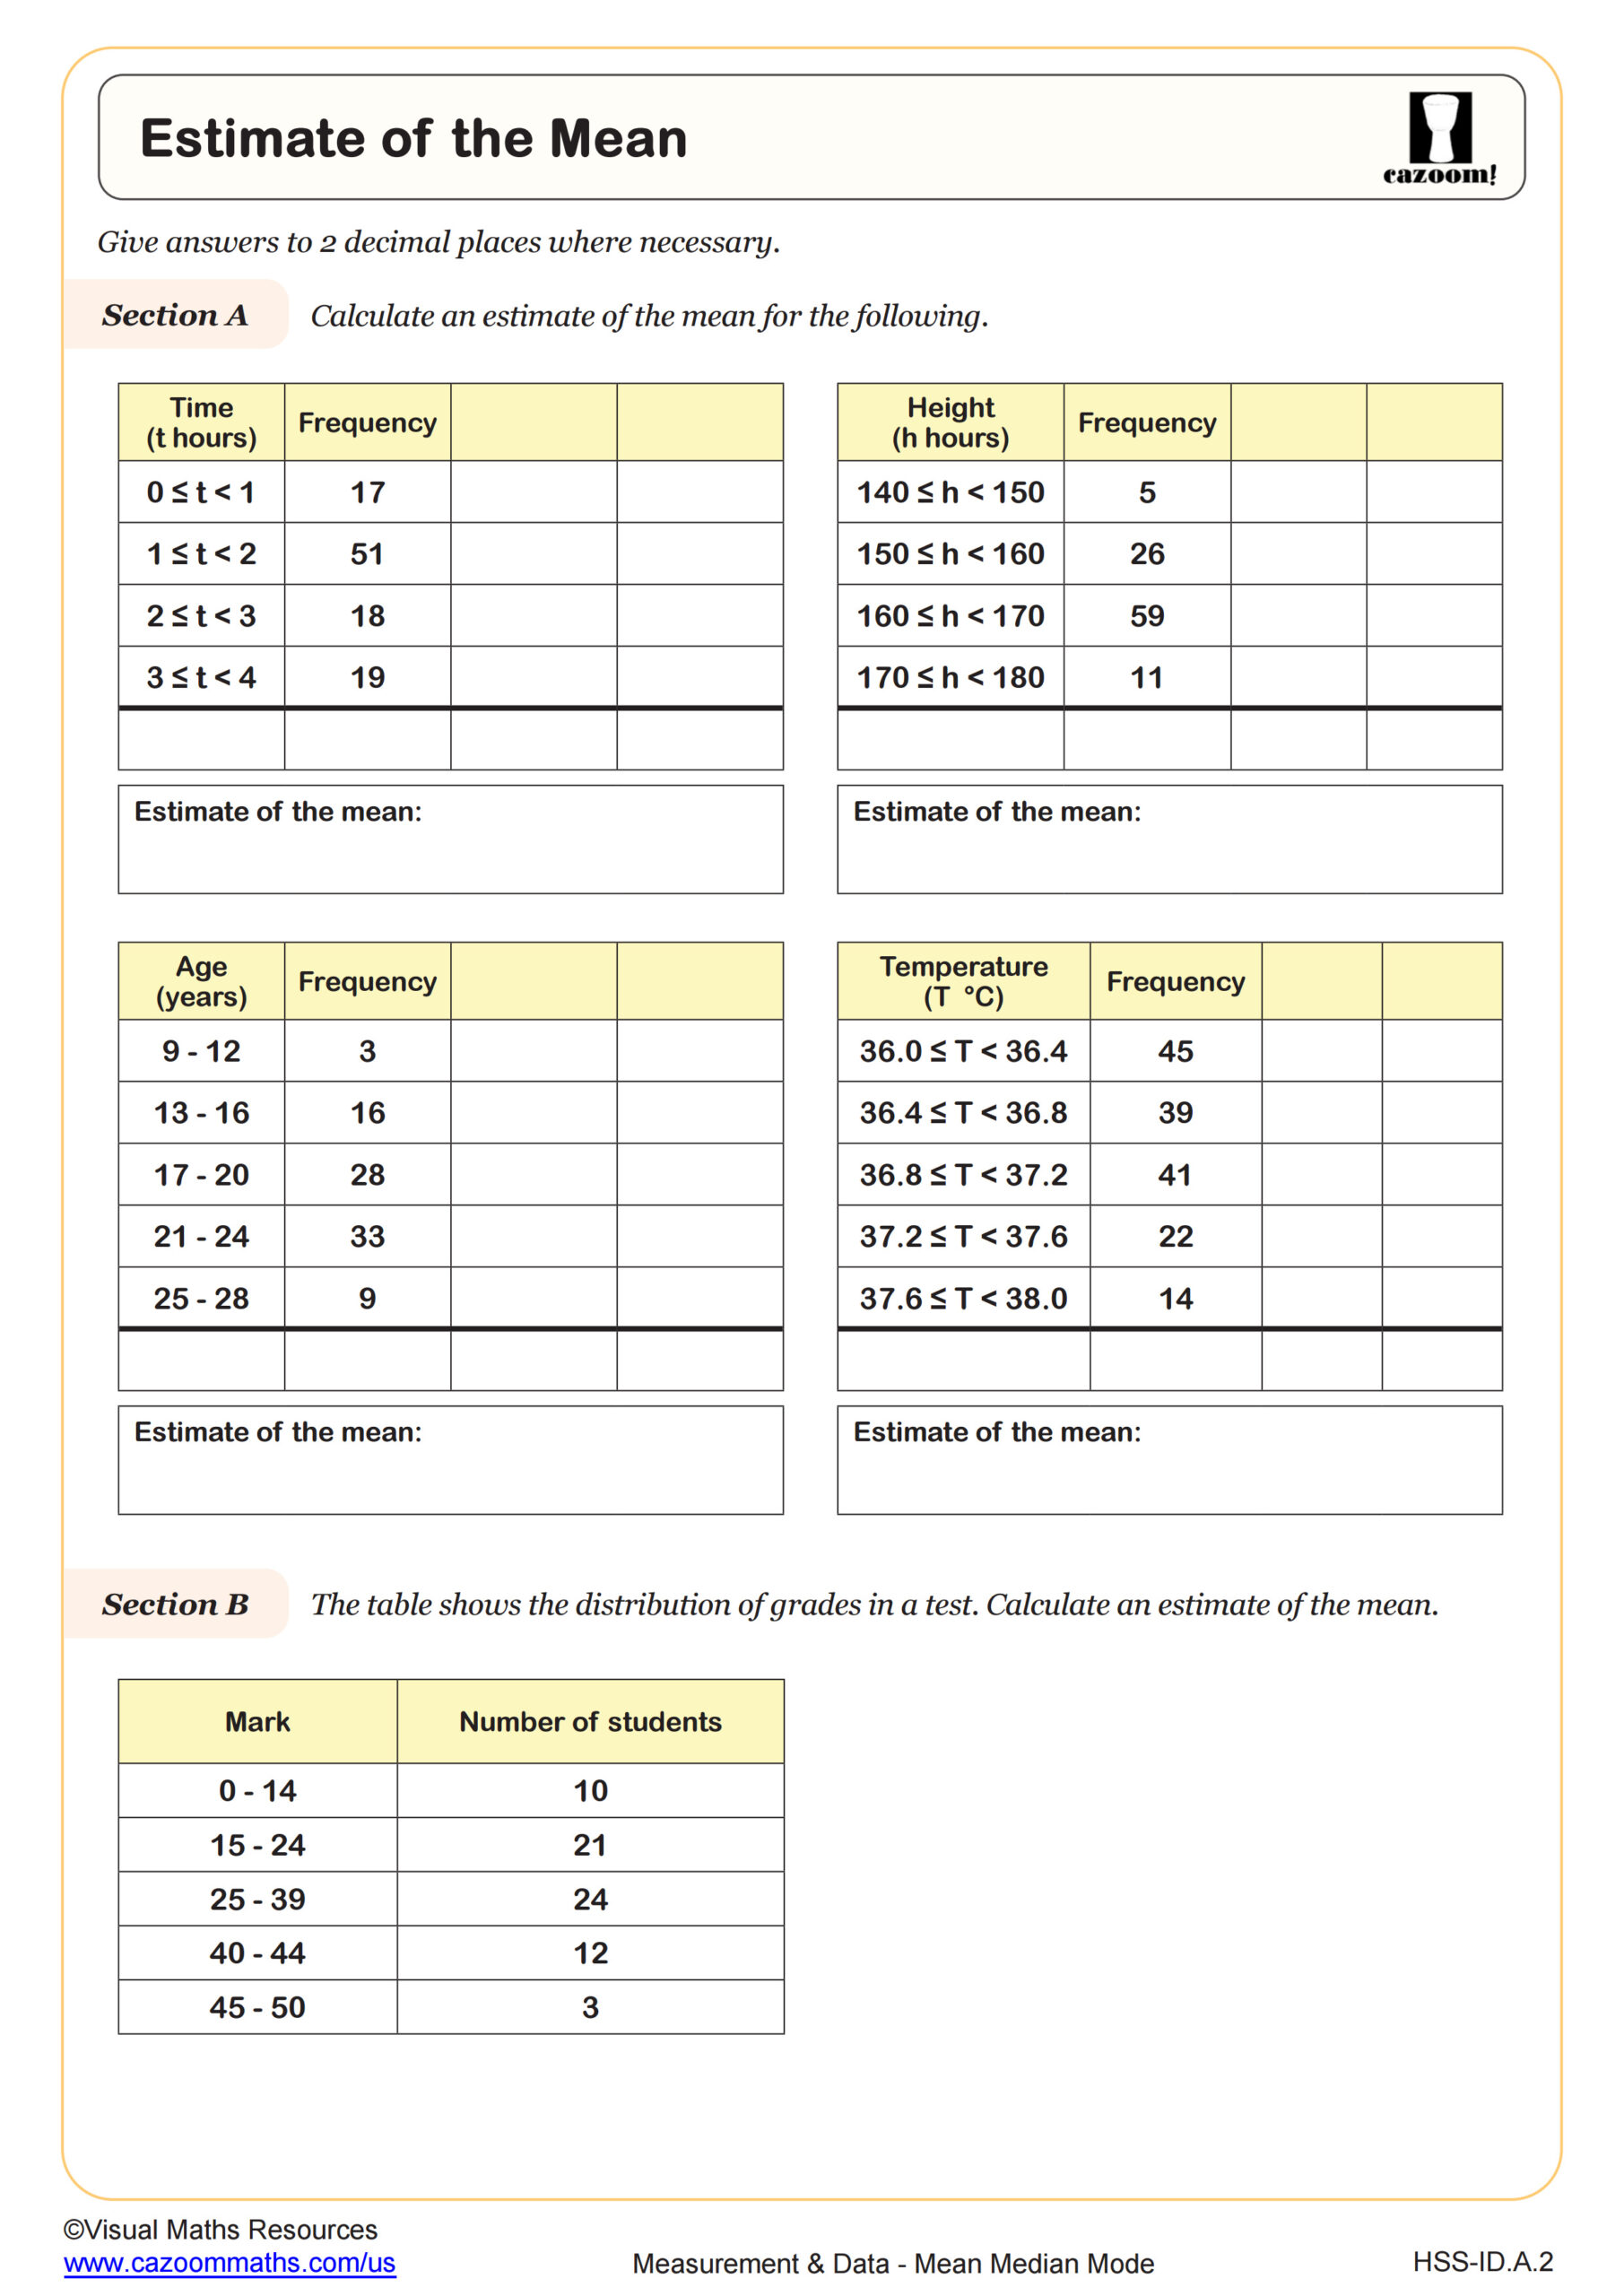
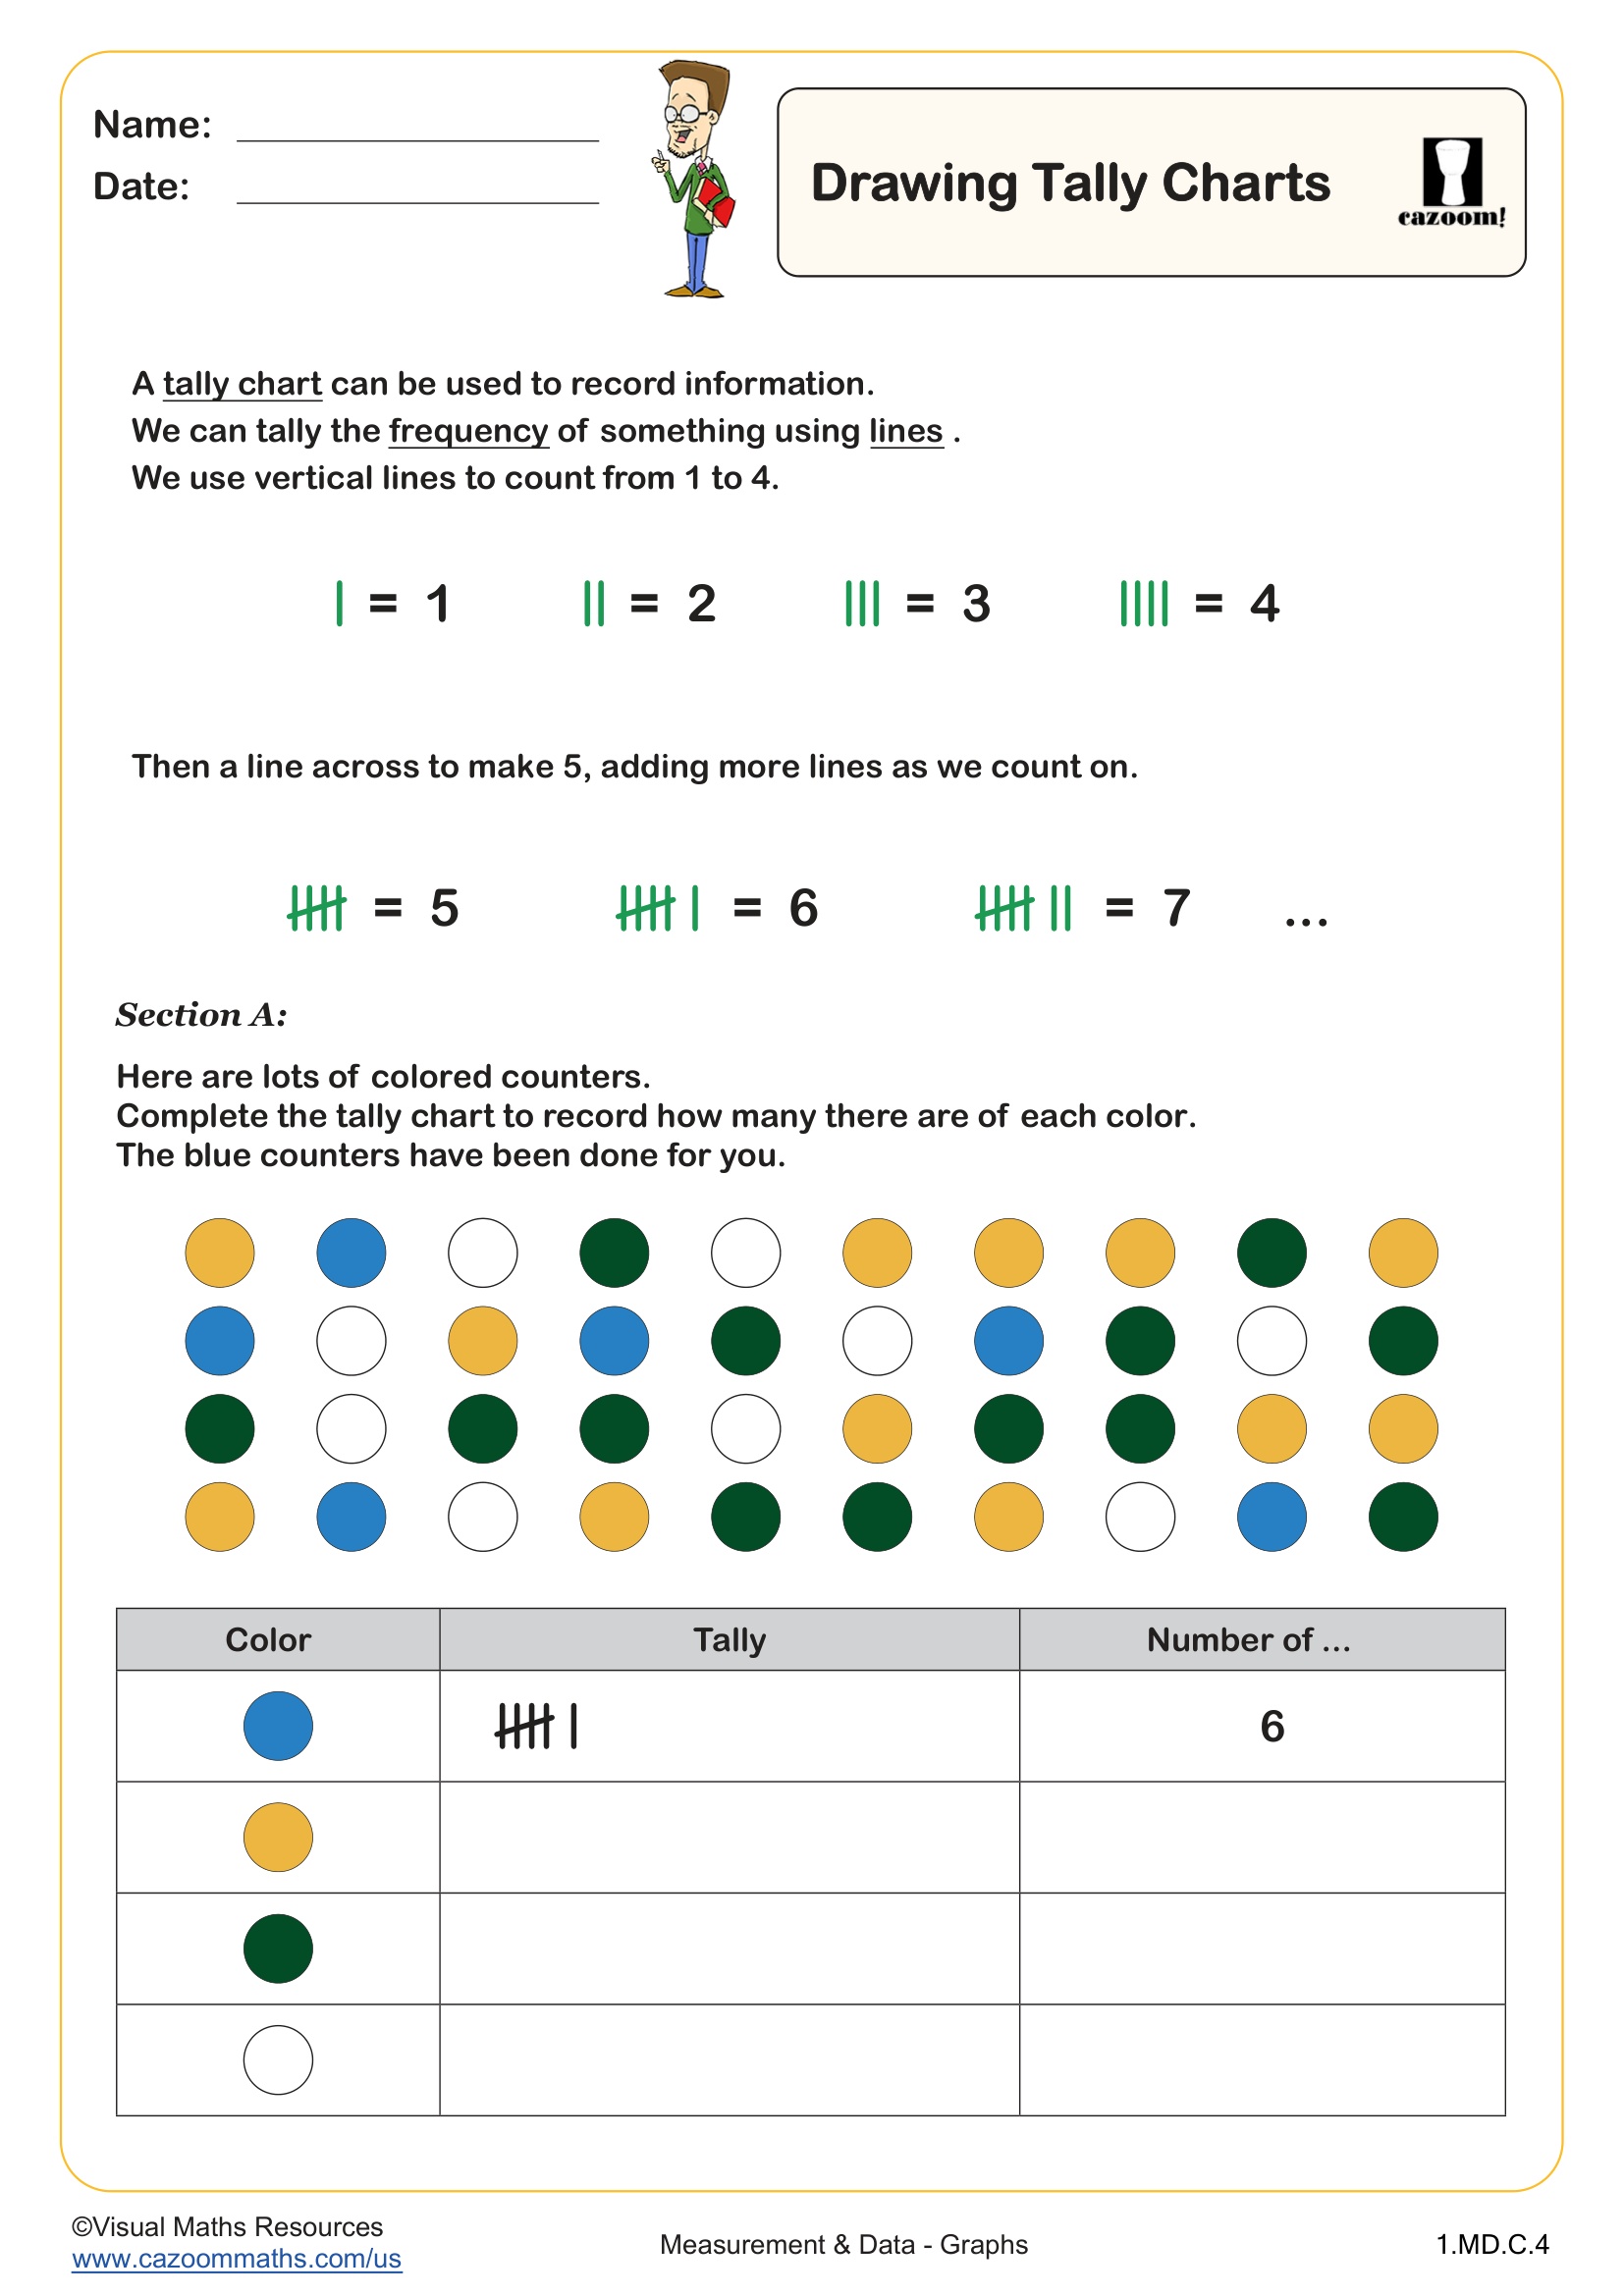
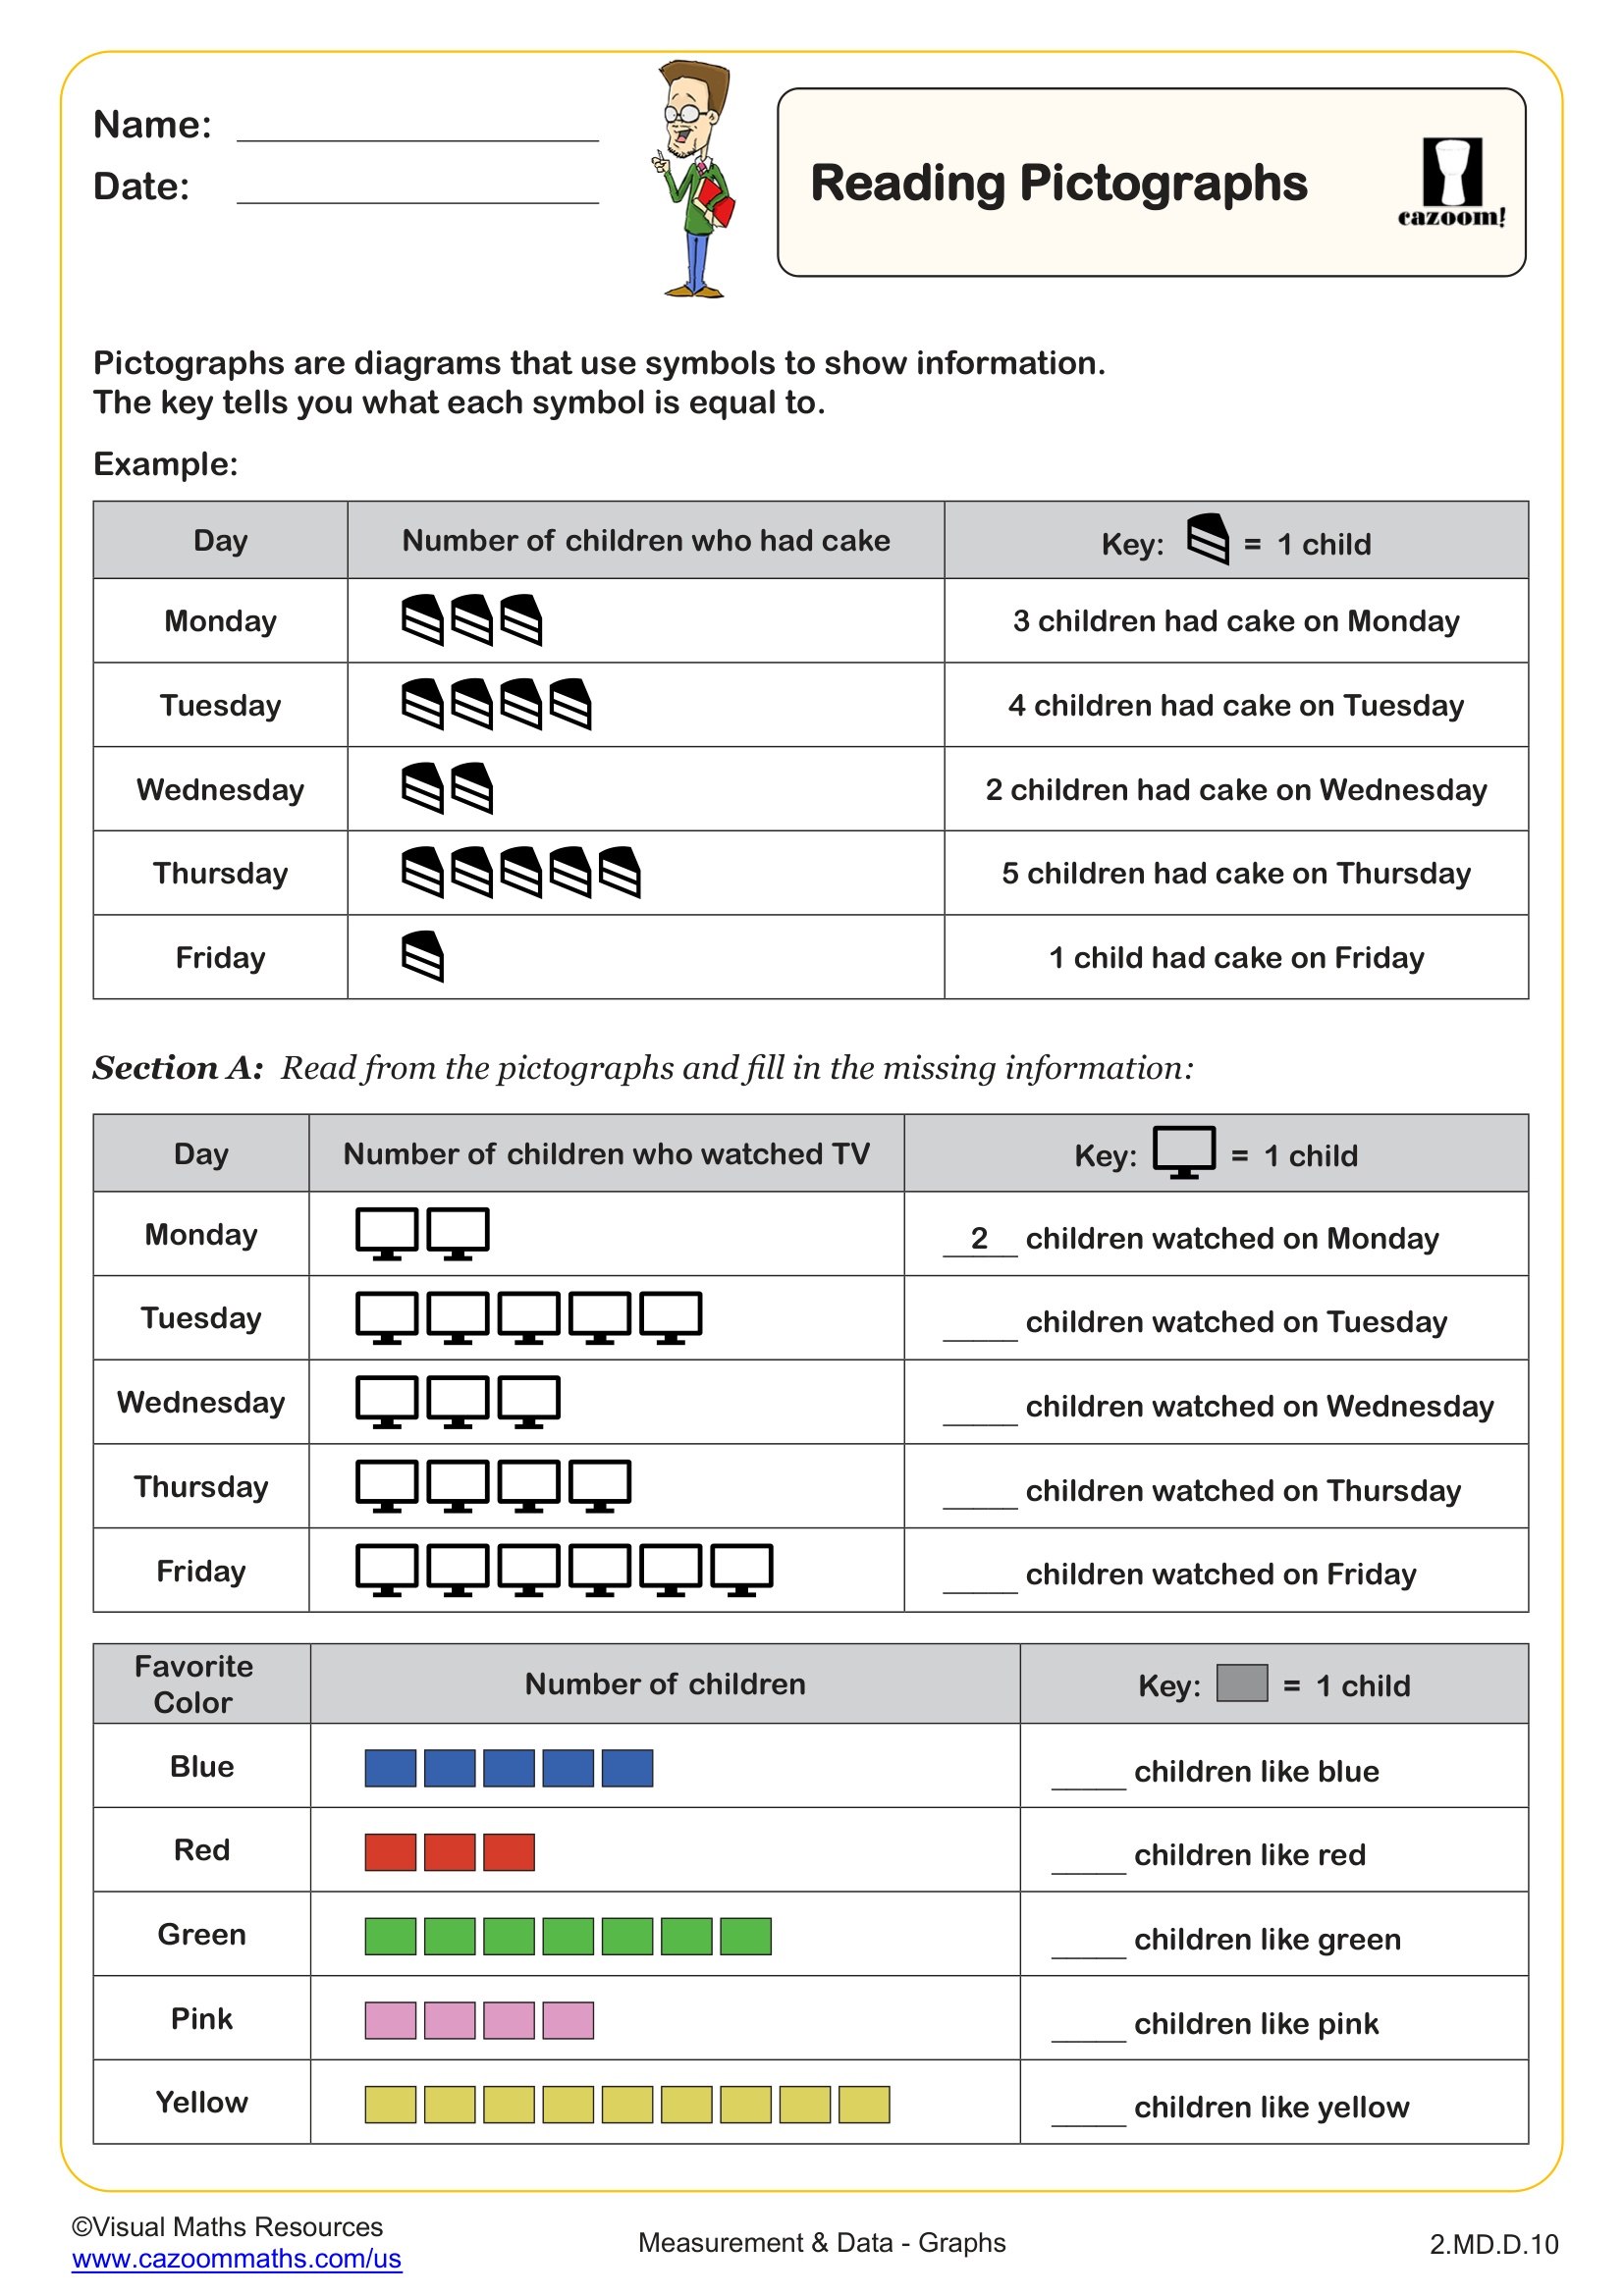
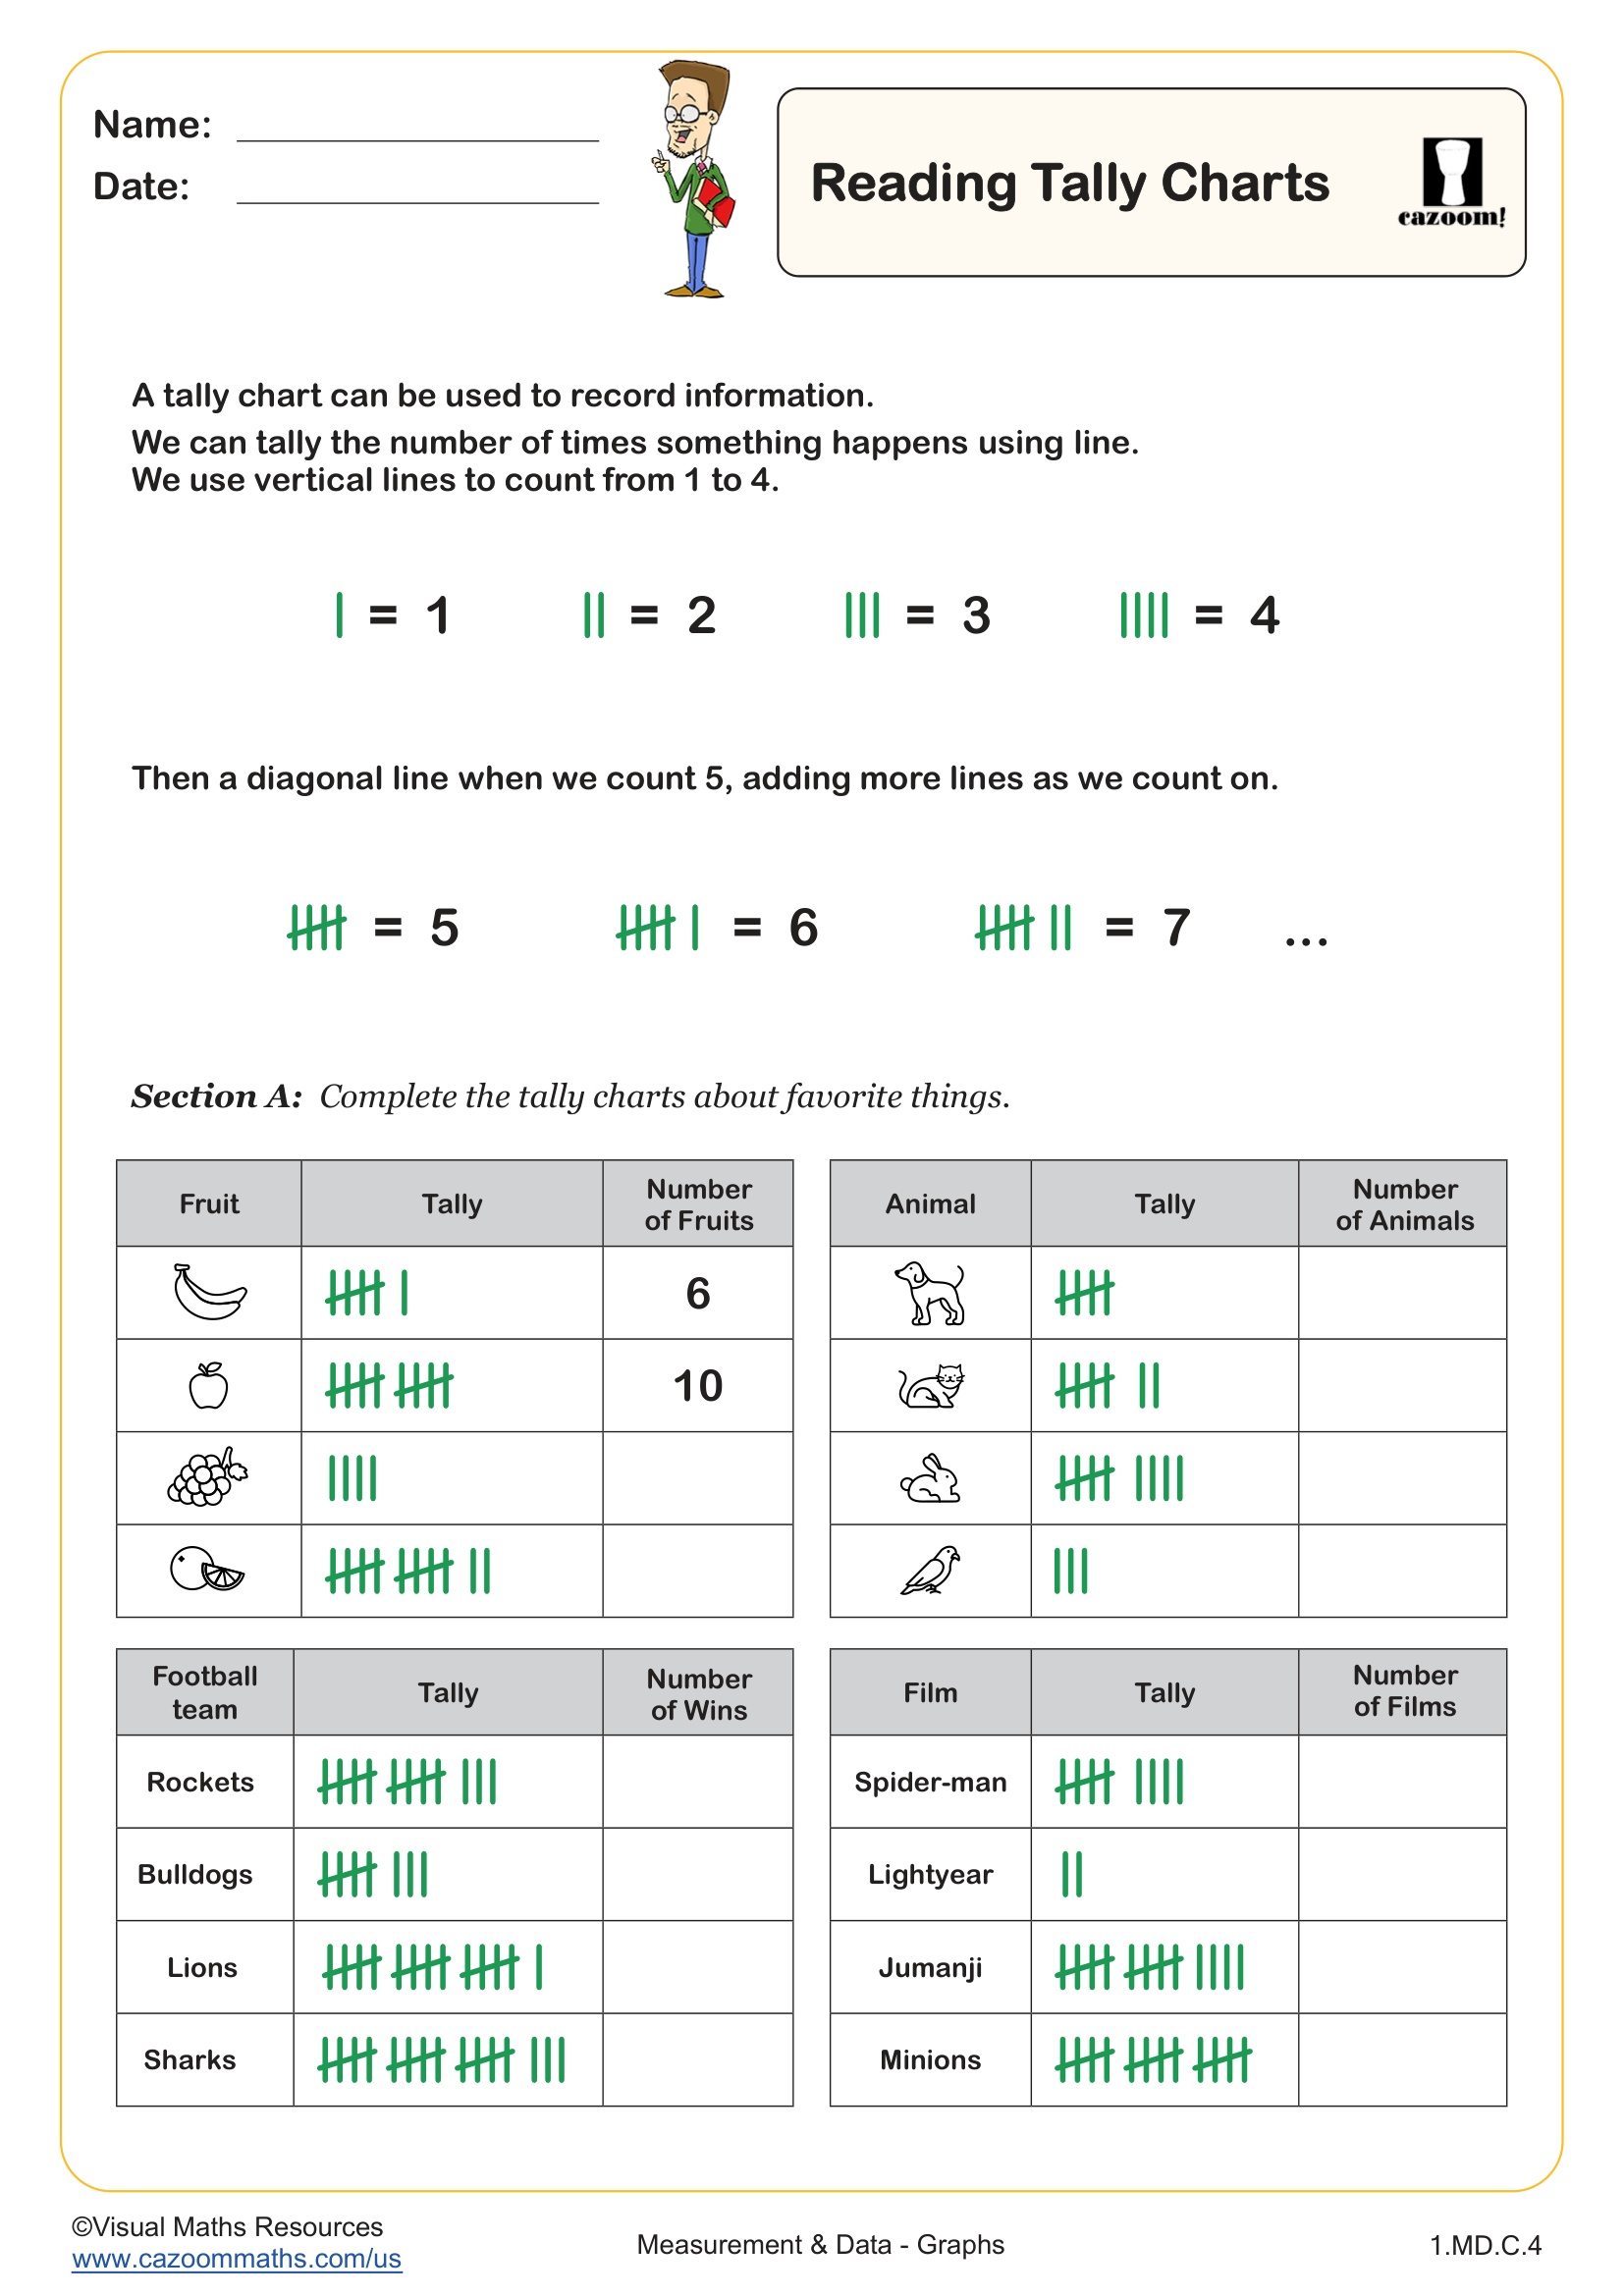
Students will start to represent data in the form of pictographs throughout this worksheet.
All symbols are 1-1 and then 2-1. We have also included a section for learners to create their own pictographs and they could collect data from their peers in order to do so.
All worksheets are created by the team of experienced teachers at Cazoom Math.

RELATED TO Drawing Pictographs WORKSHEET
Frequently Asked Questions
This worksheet is specifically designed for 2nd grade students who are beginning to learn about data representation. At this level, students are ready to understand how symbols can represent information in a visual format. The activities progress from simple one-to-one symbol matching to more complex two-to-one relationships, which is perfect for developing their mathematical reasoning skills.