Back to:
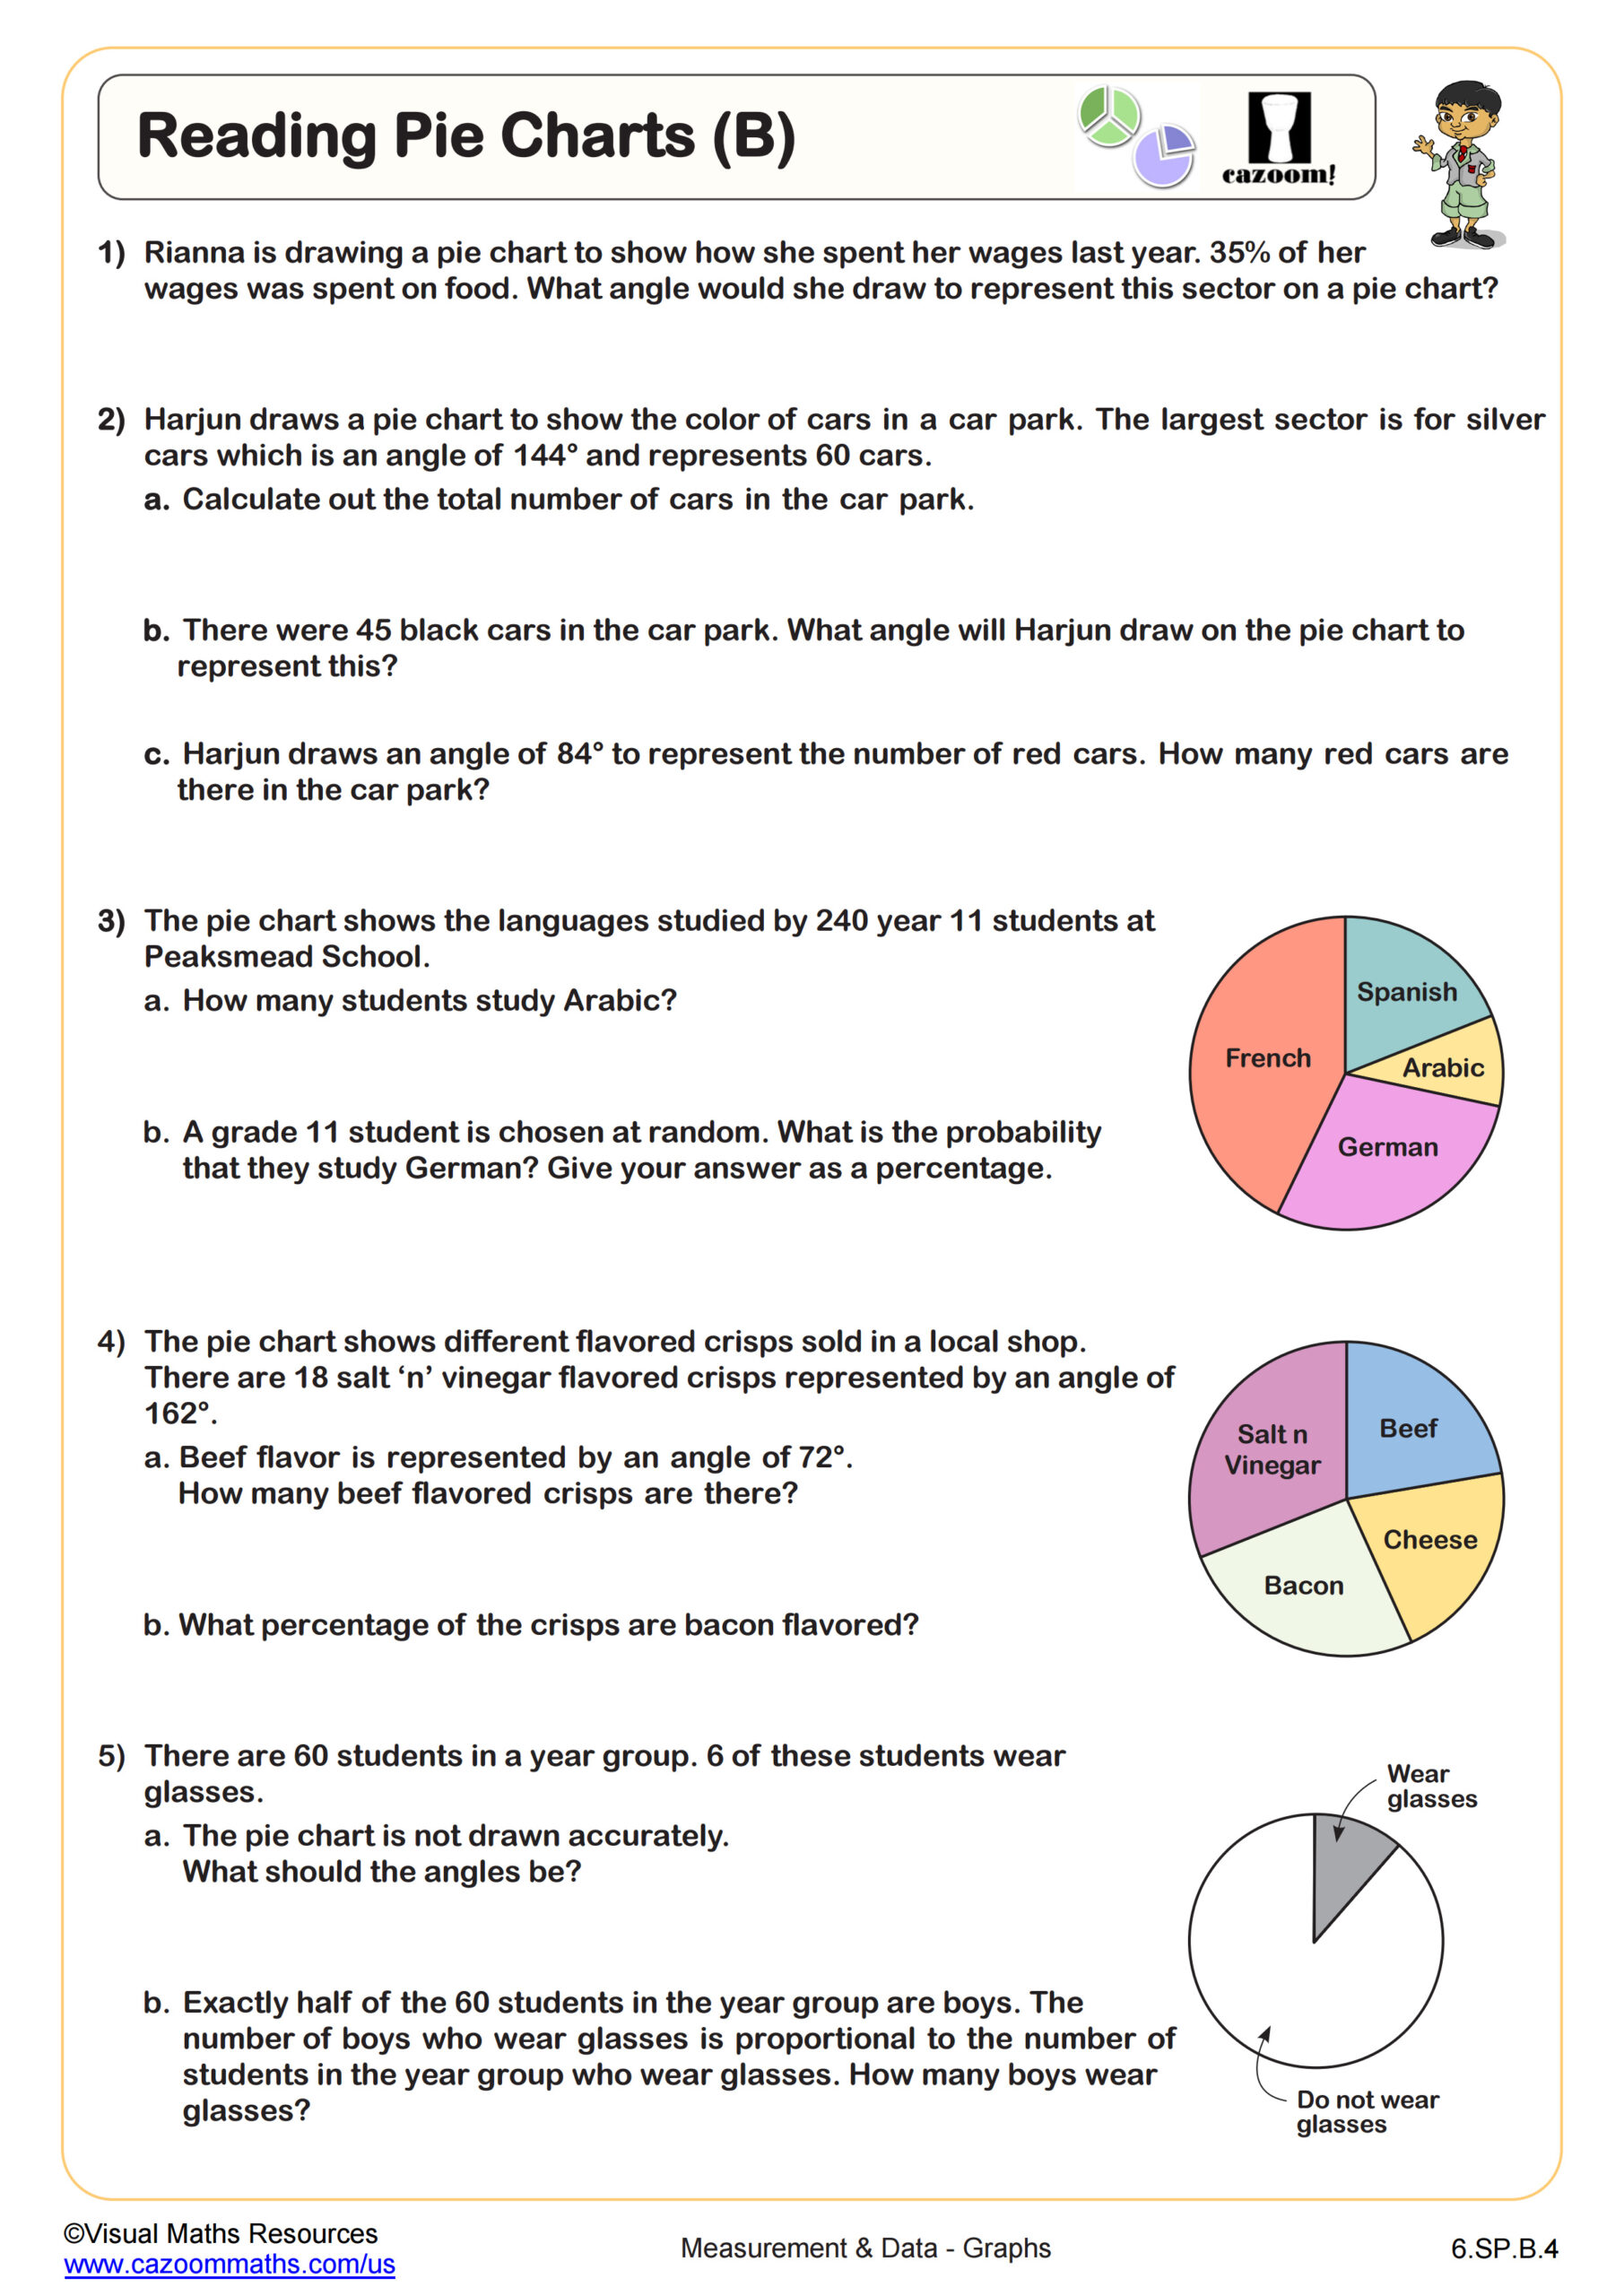
Drawing Pie Charts (B) WORKSHEET
Suitable for Grades: 6th Grade
CCSS: 6.SP.B.4
CCSS Description: Display numerical data in plots on a number line, including dot plots, histograms, and box plots.
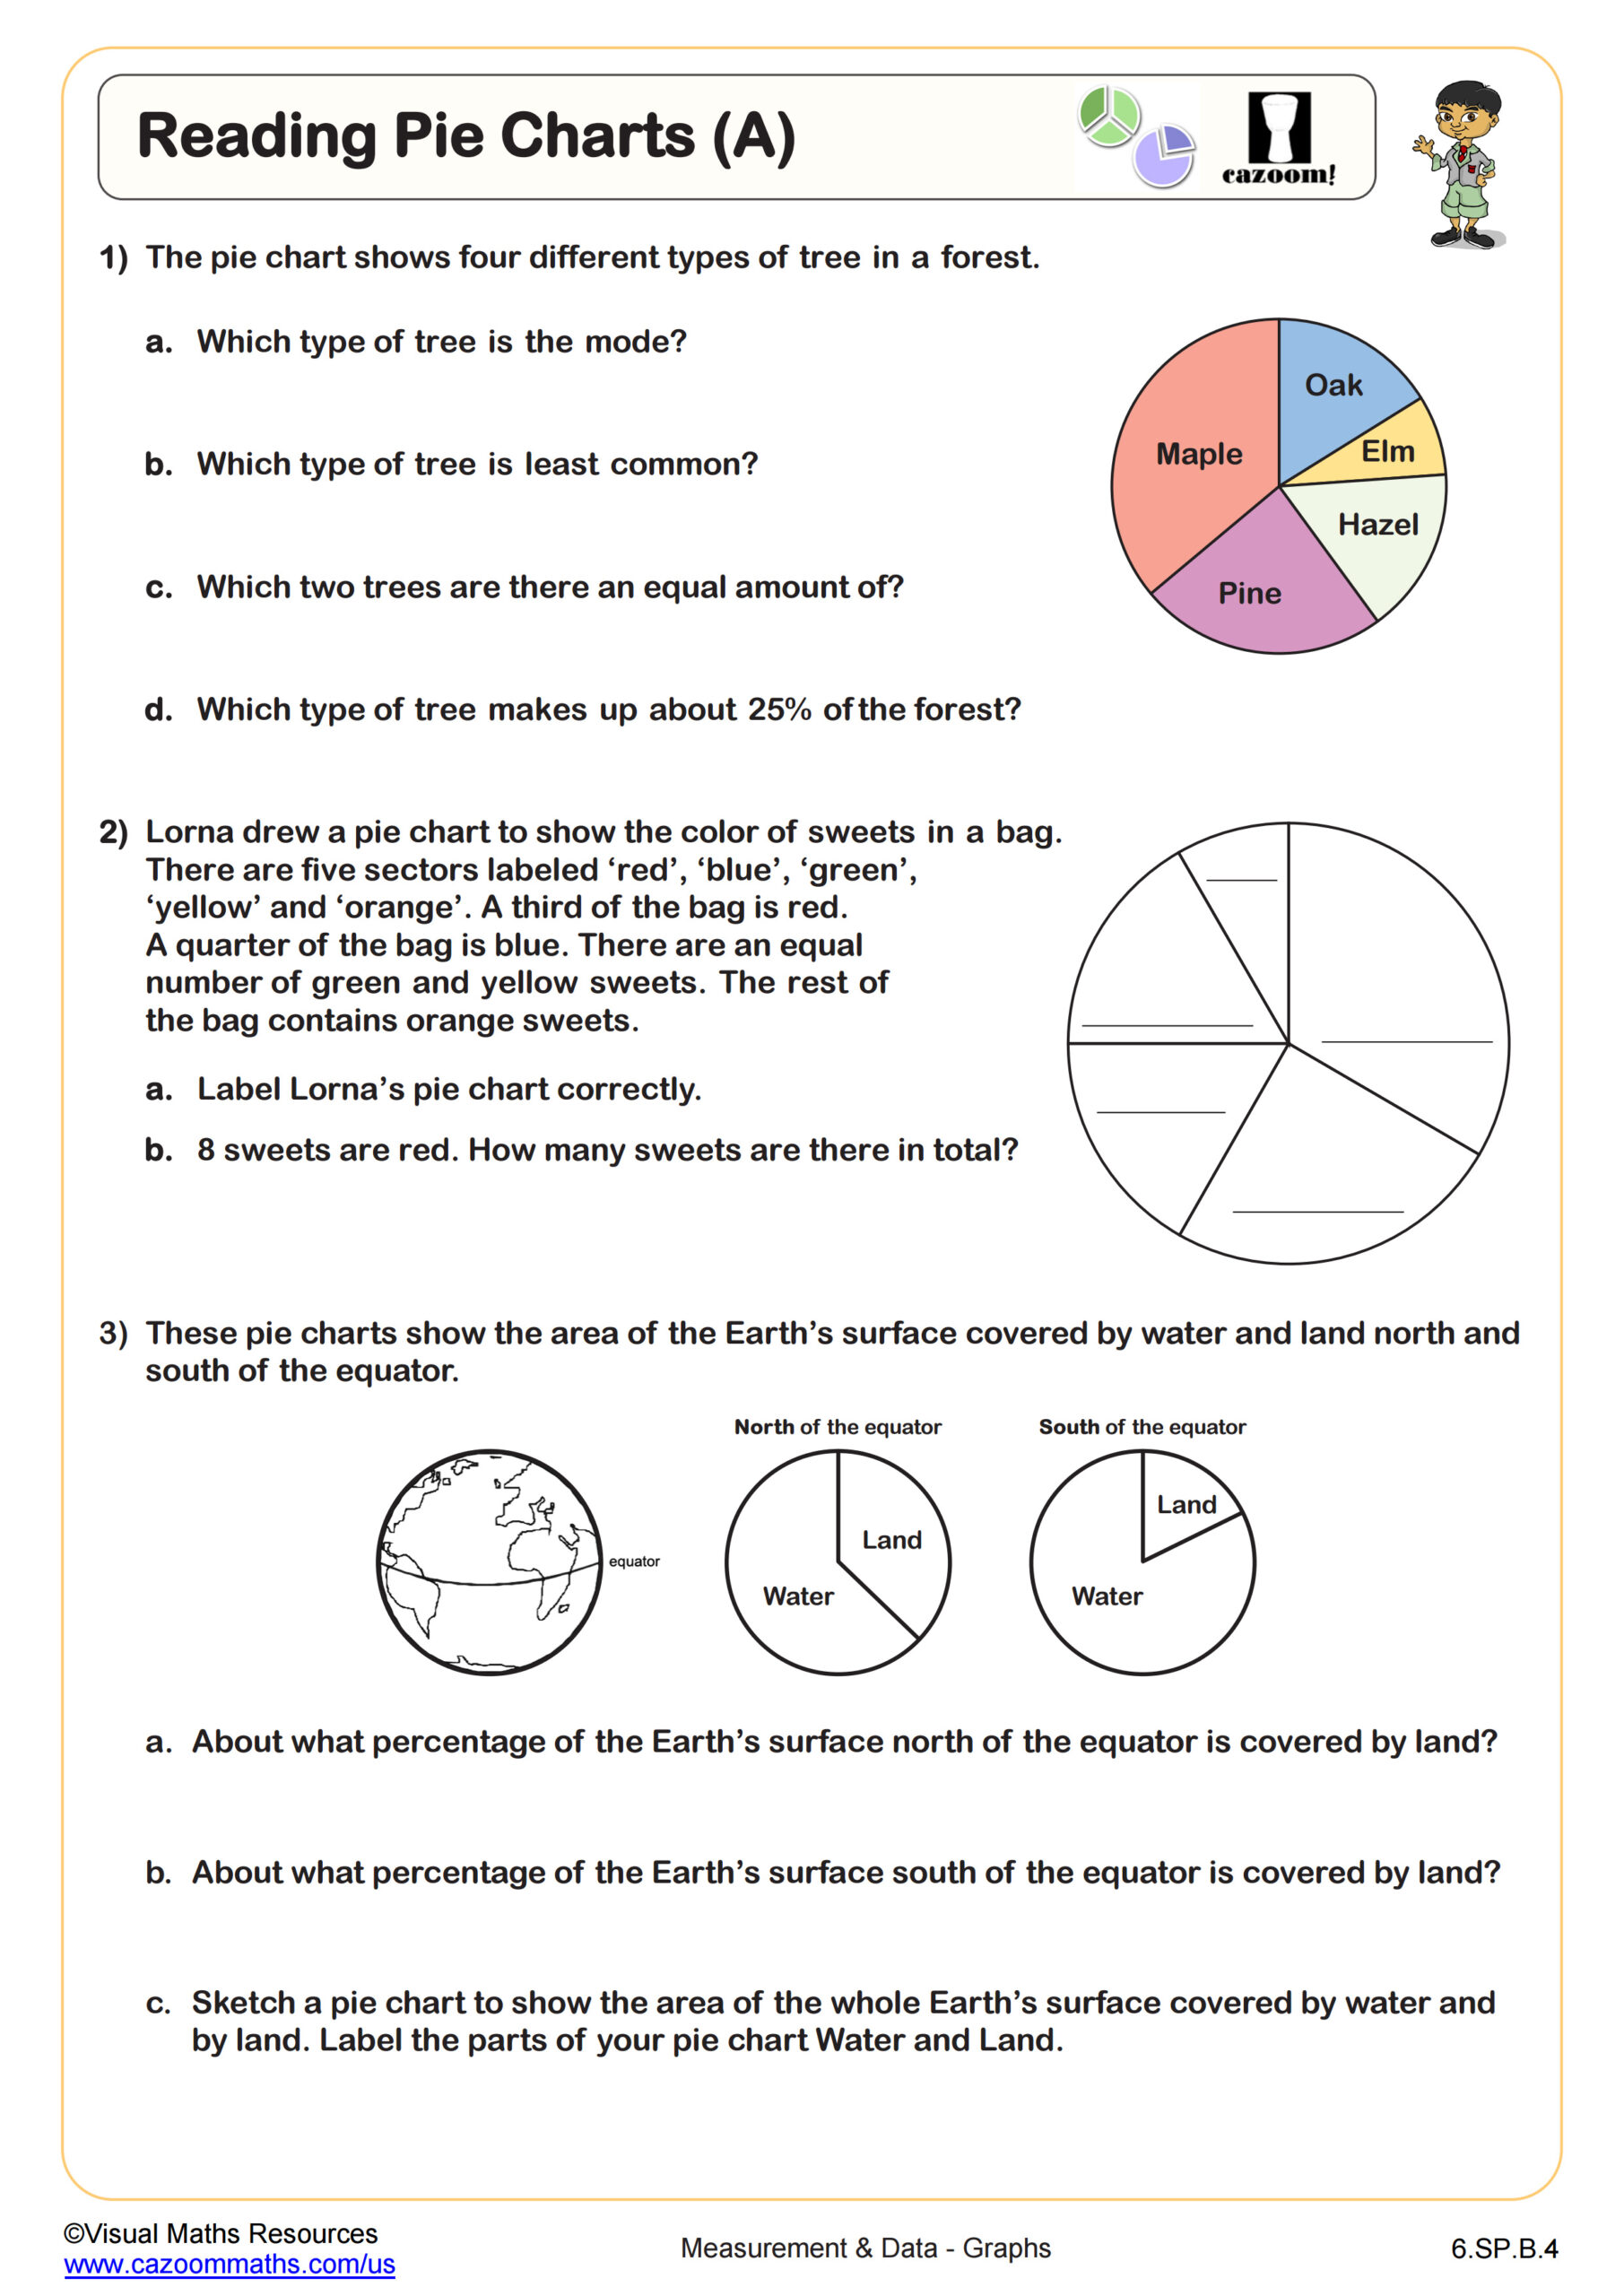
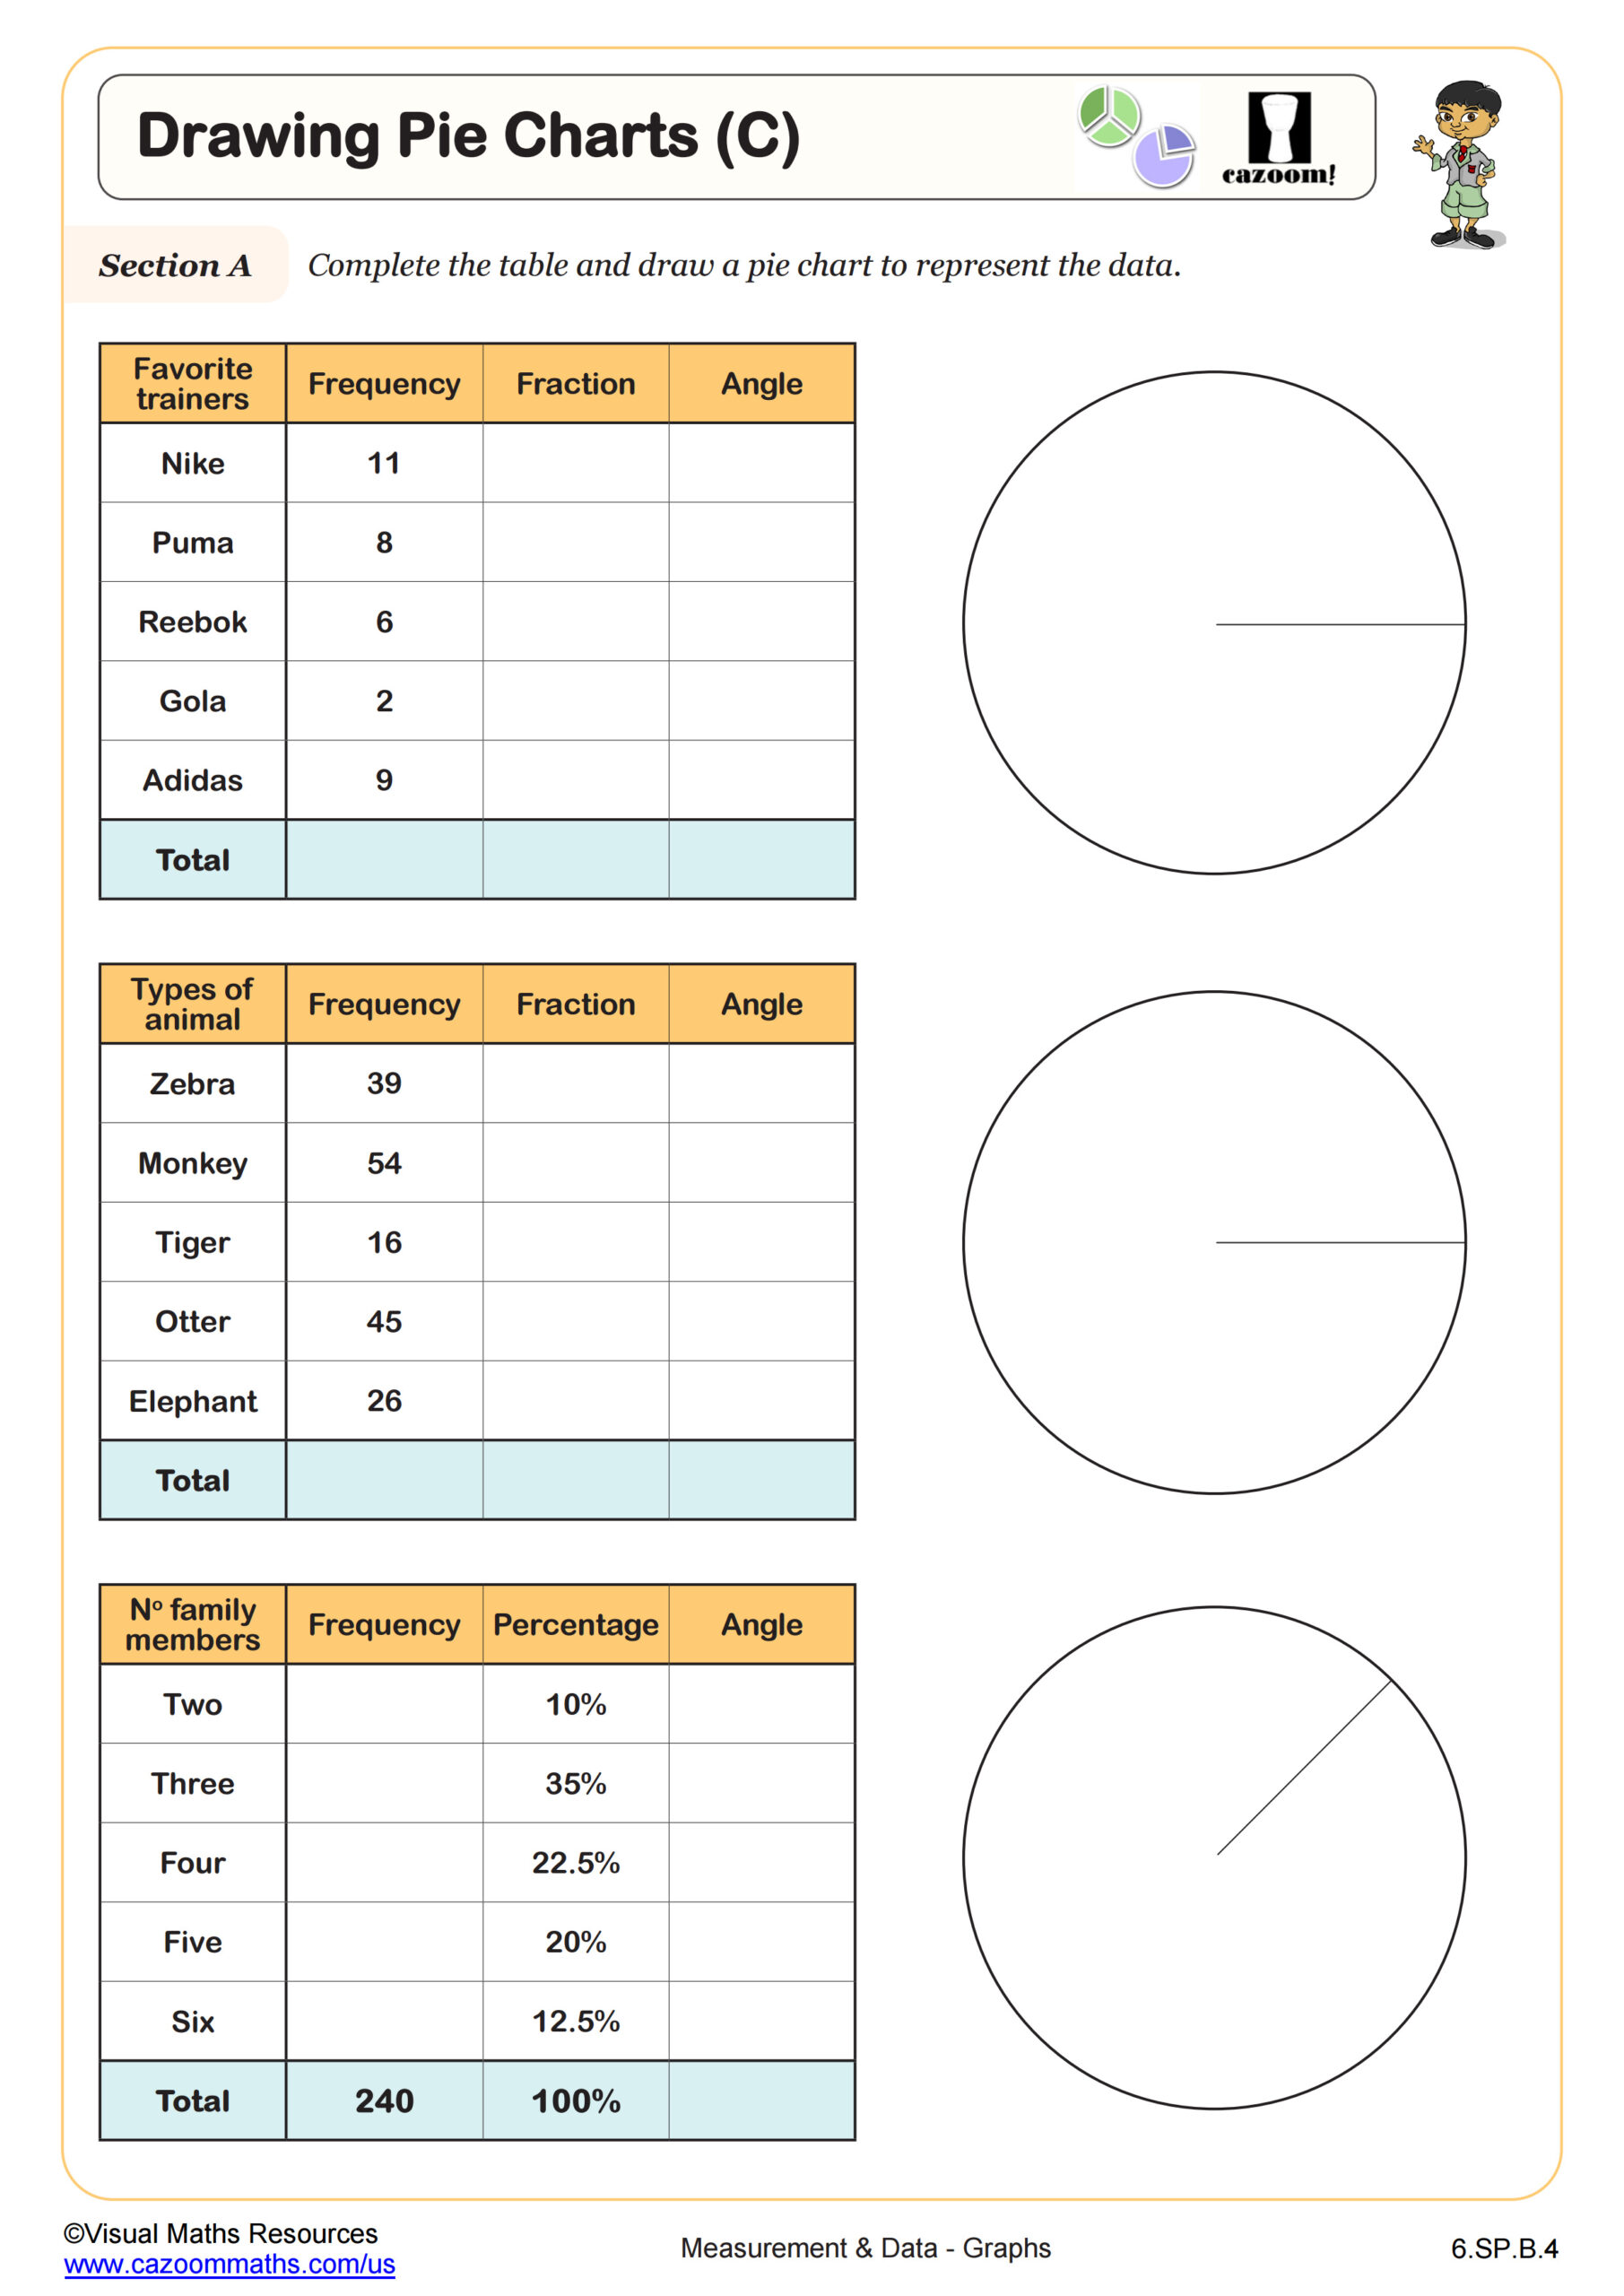
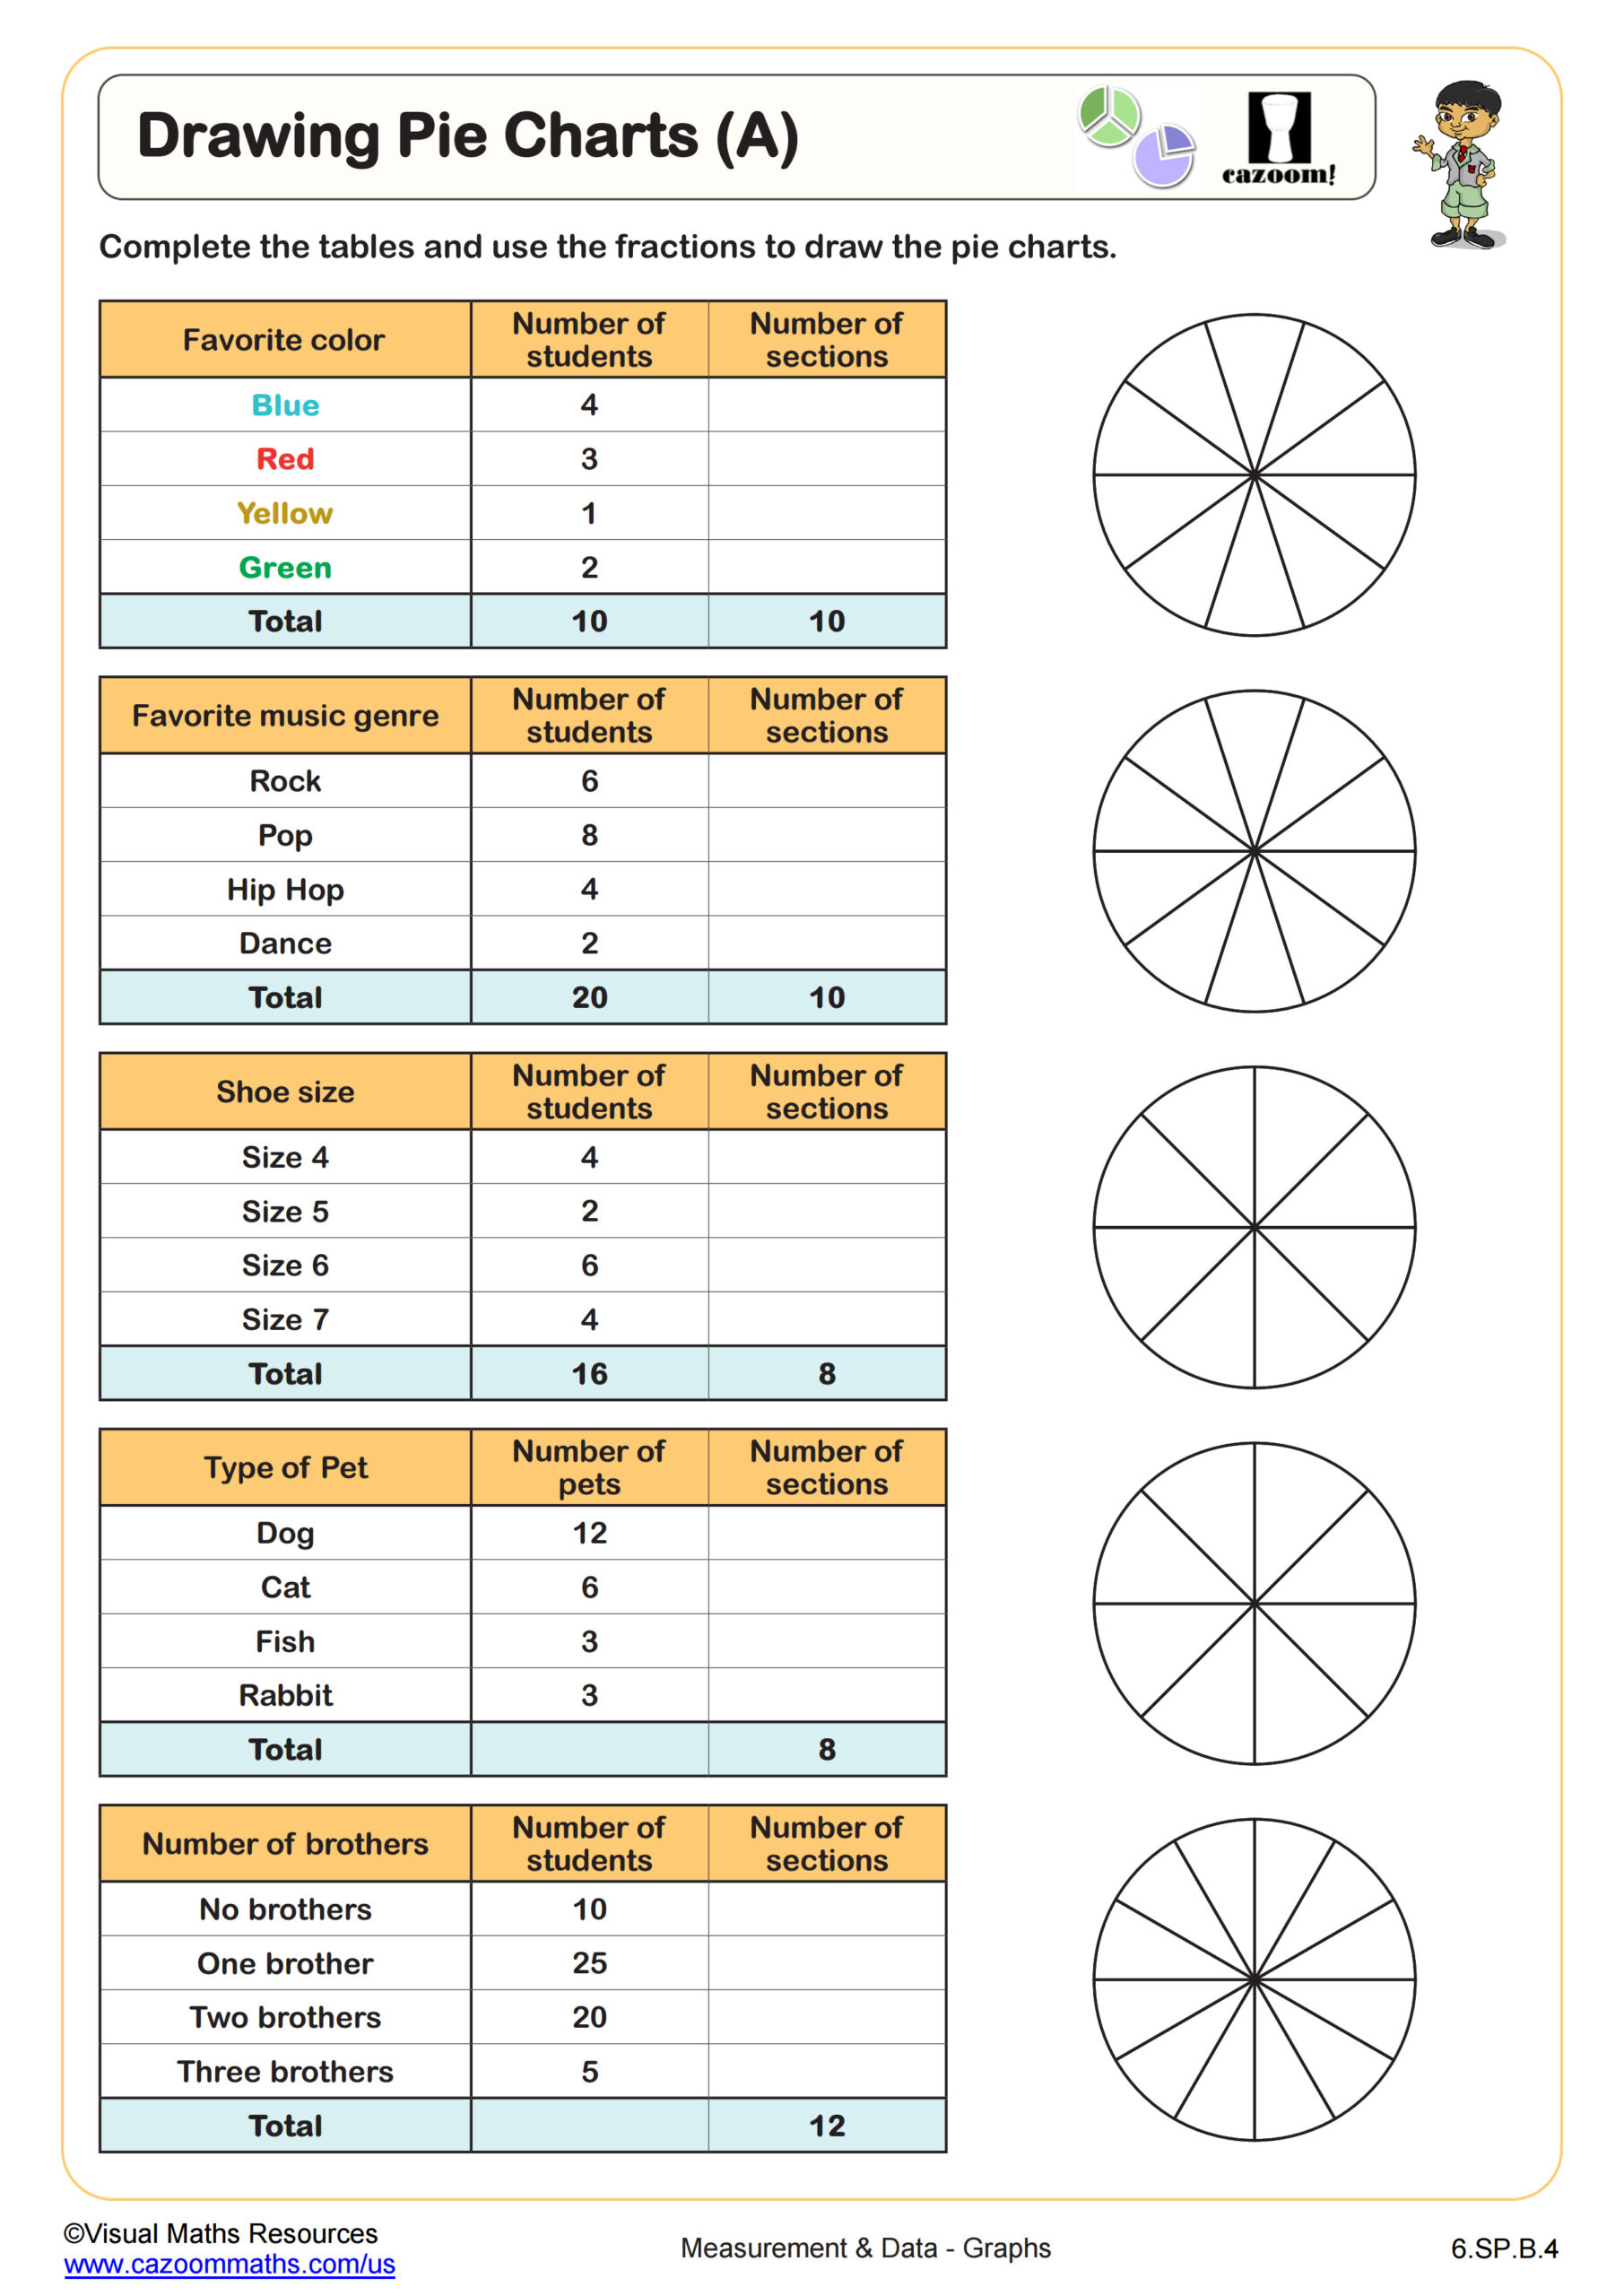
Drawing Pie Charts (B) WORKSHEET DESCRIPTION
This worksheet provides some tables of information that can be presented as pie charts by shading sectors. Each pie chart is split into tenths, and learners will need to work out the number of sections using percentages from the data in each table. This worksheet can be used after by Drawing Pie Charts (A).
All worksheets are created by the team of experienced teachers at Cazoom Math.
 Worksheet")
RELATED TO Drawing Pie Charts (B) WORKSHEET
Frequently Asked Questions
This drawing pie charts (b) worksheet is designed for students in 6th Grade and aligns with Common Core State Standards.