Back to:
Drawing Pie Charts (C) WORKSHEET
Suitable for Grades: 6th Grade
CCSS: 6.SP.B.4
CCSS Description: Display numerical data in plots on a number line, including dot plots, histograms, and box plots.
Drawing Pie Charts (C) WORKSHEET DESCRIPTION
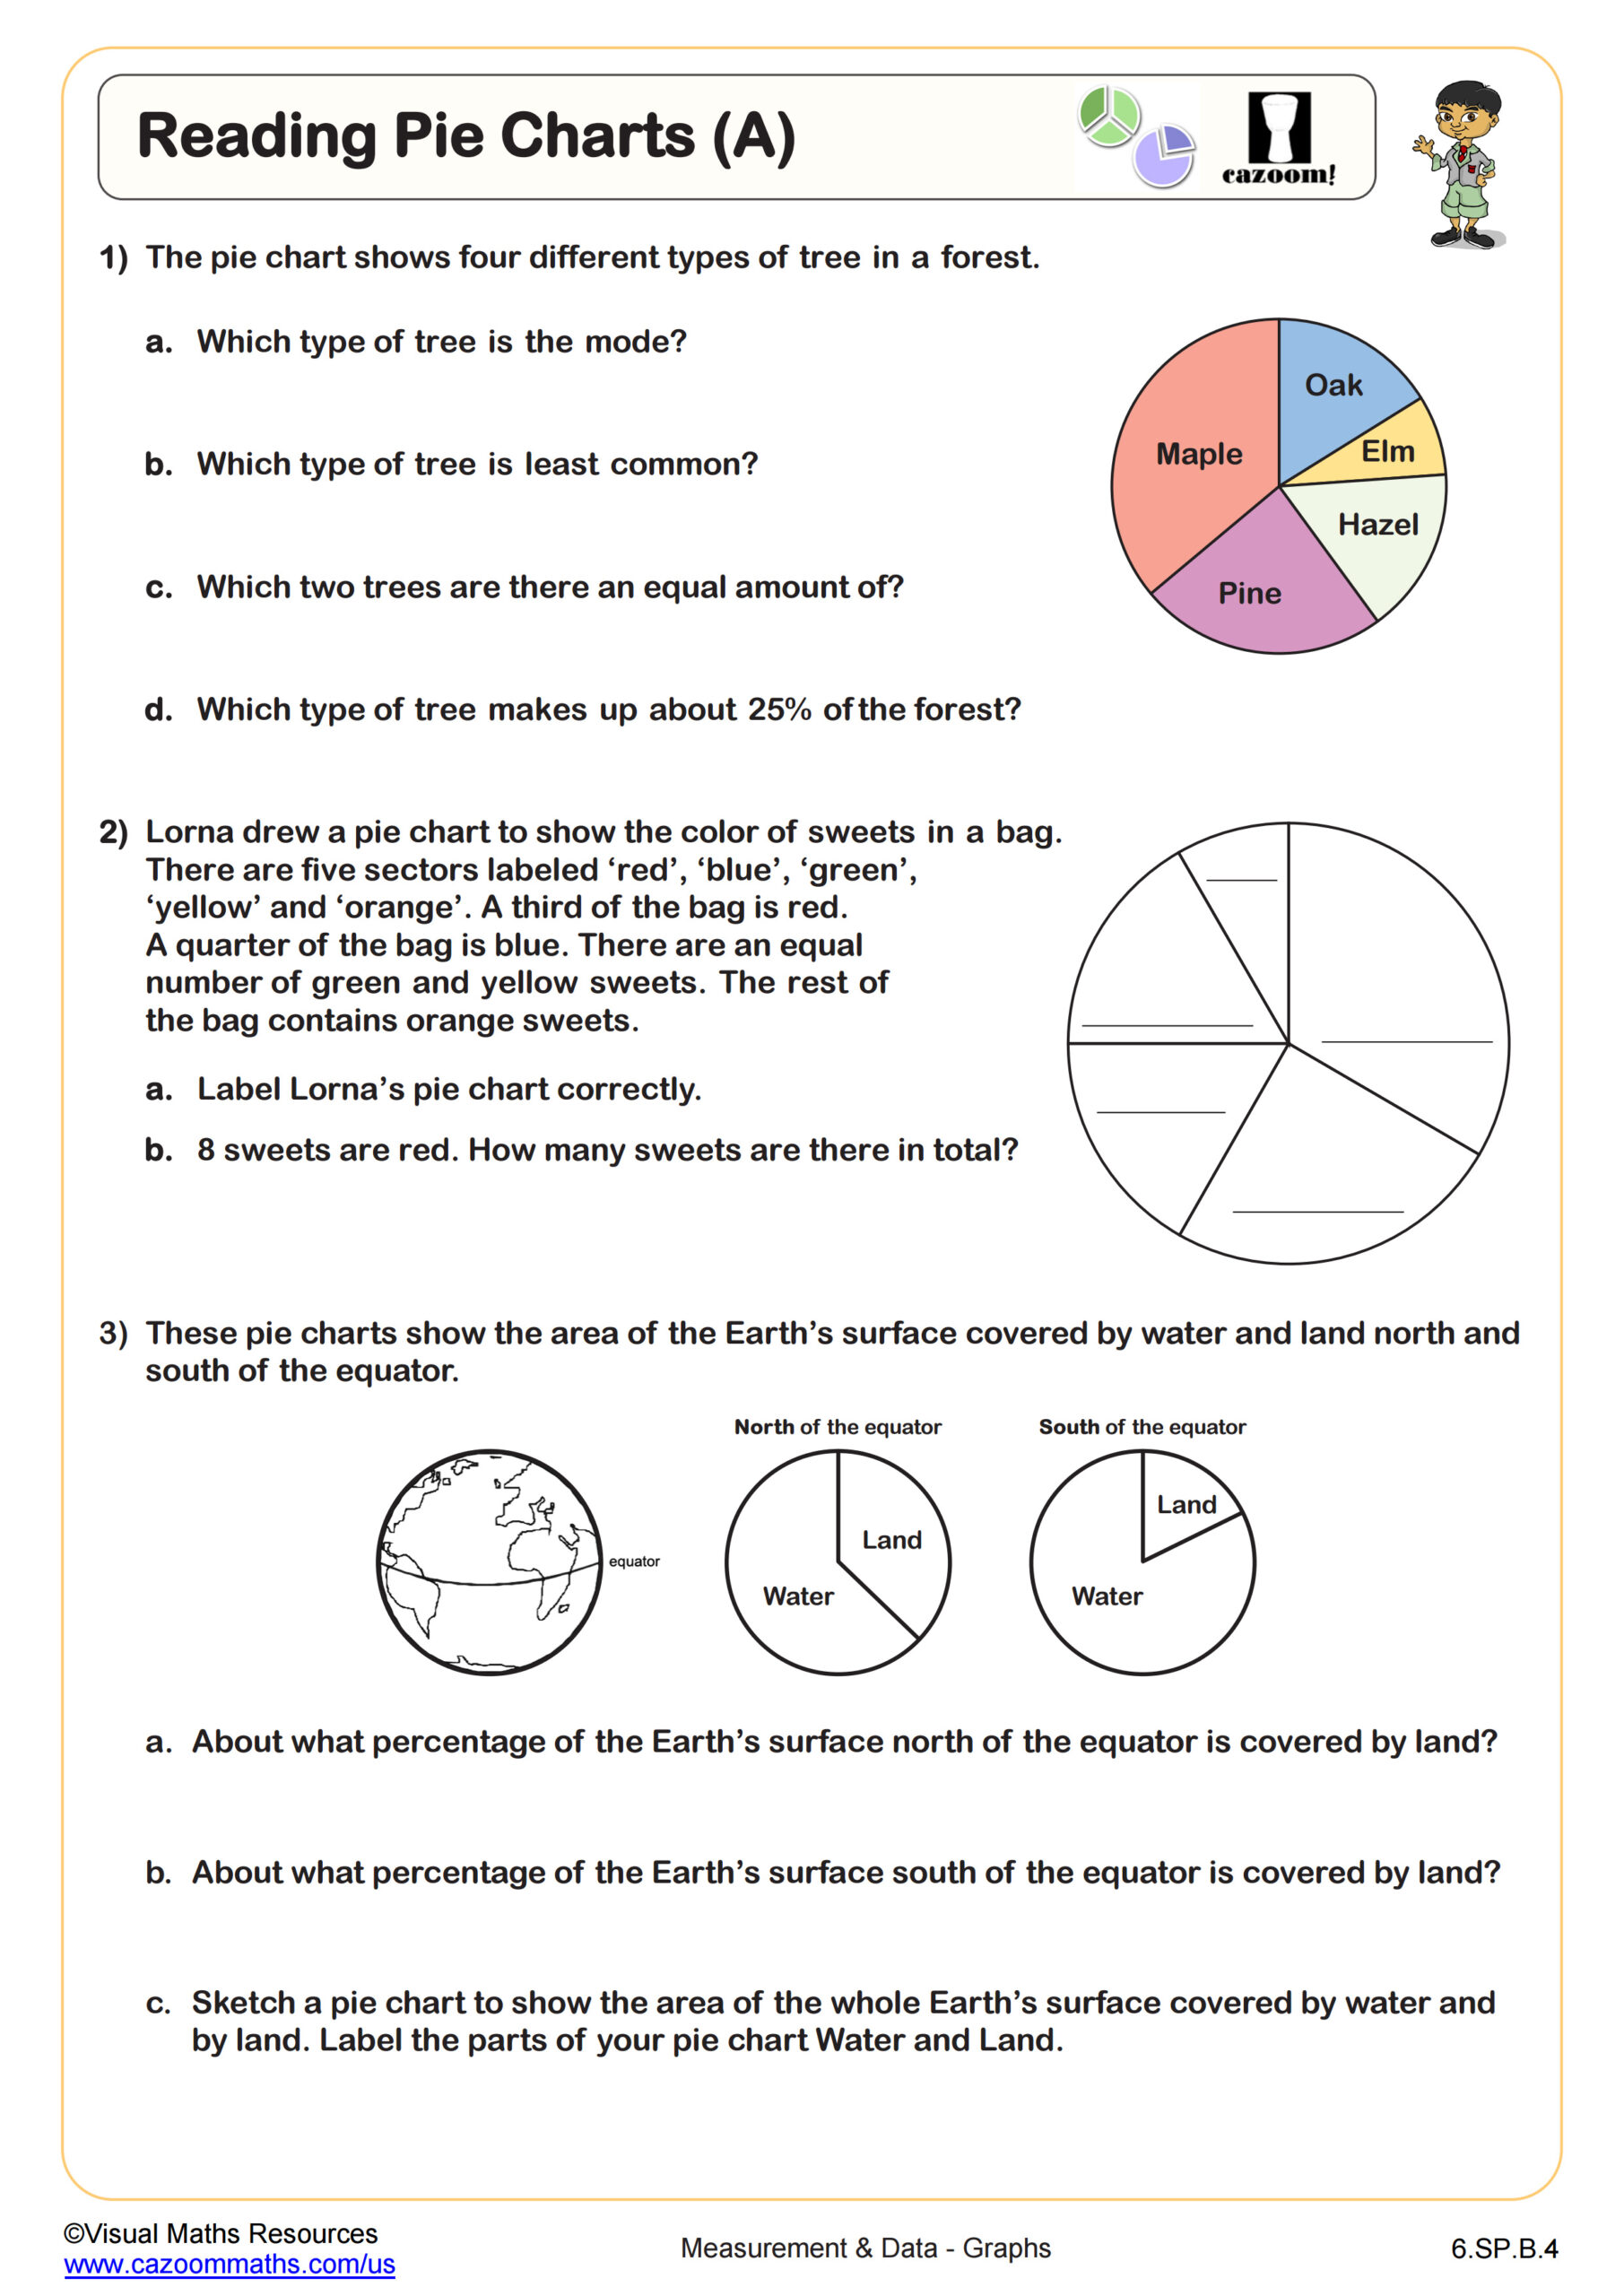
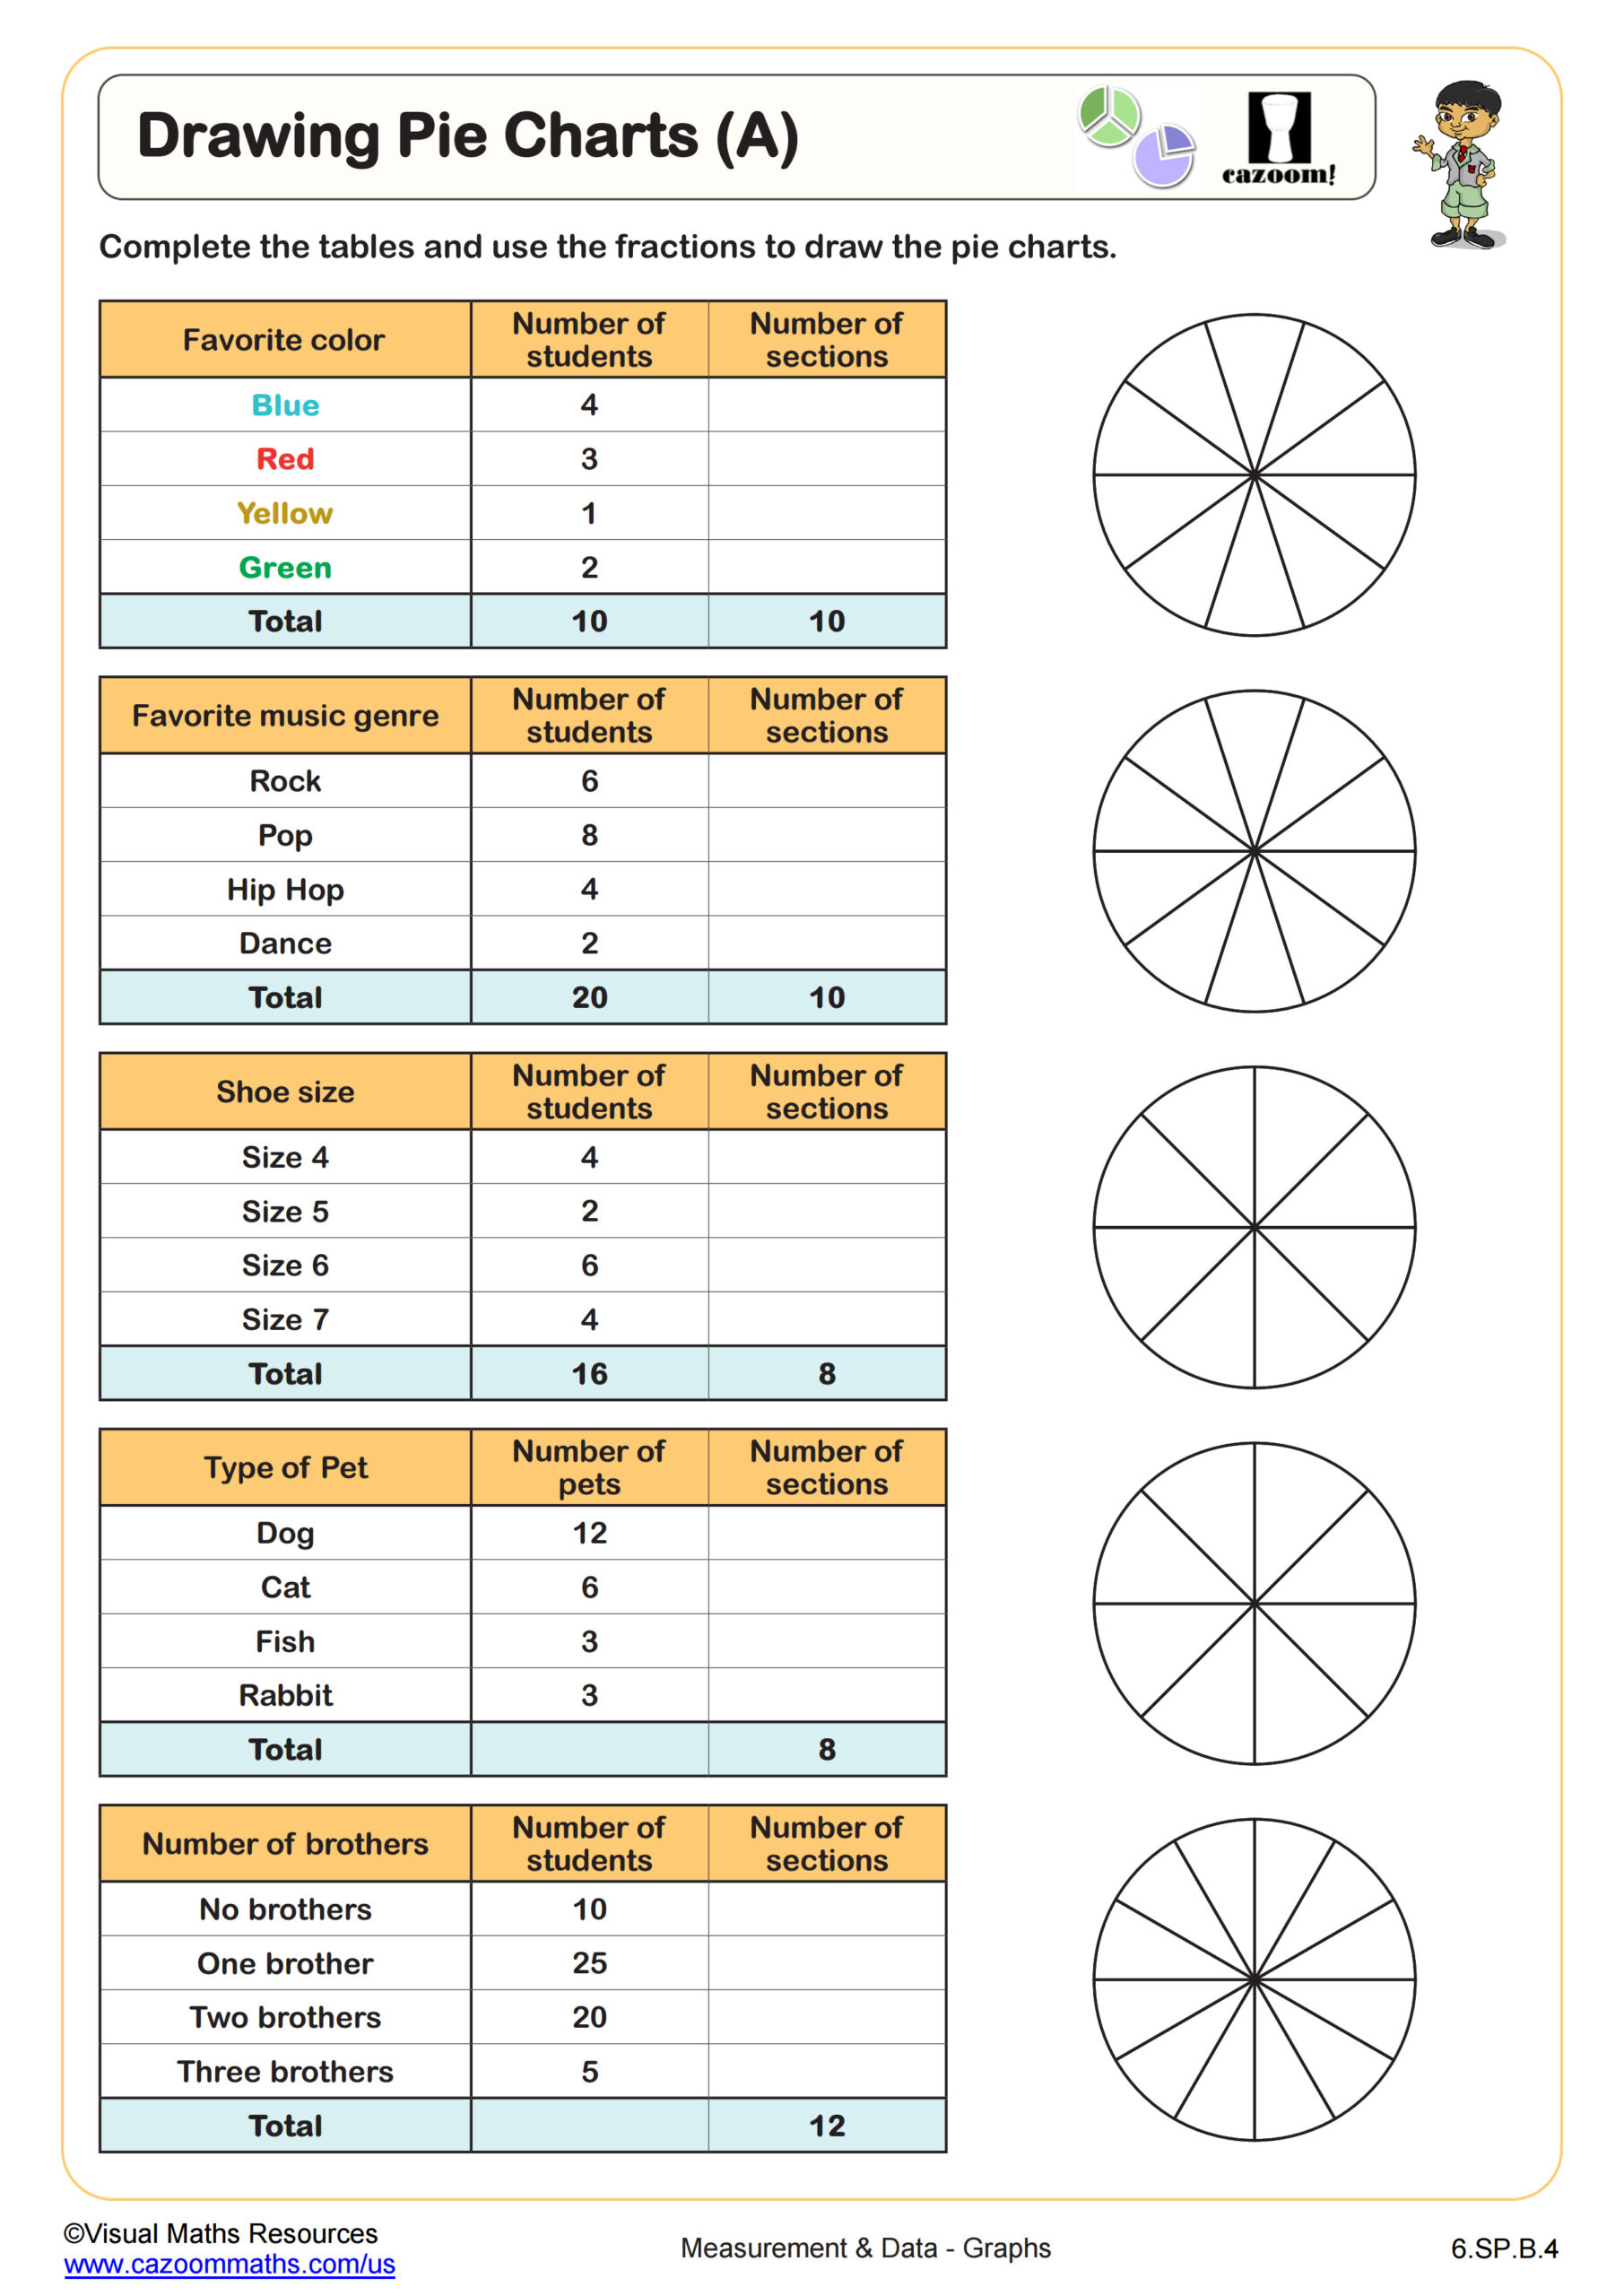
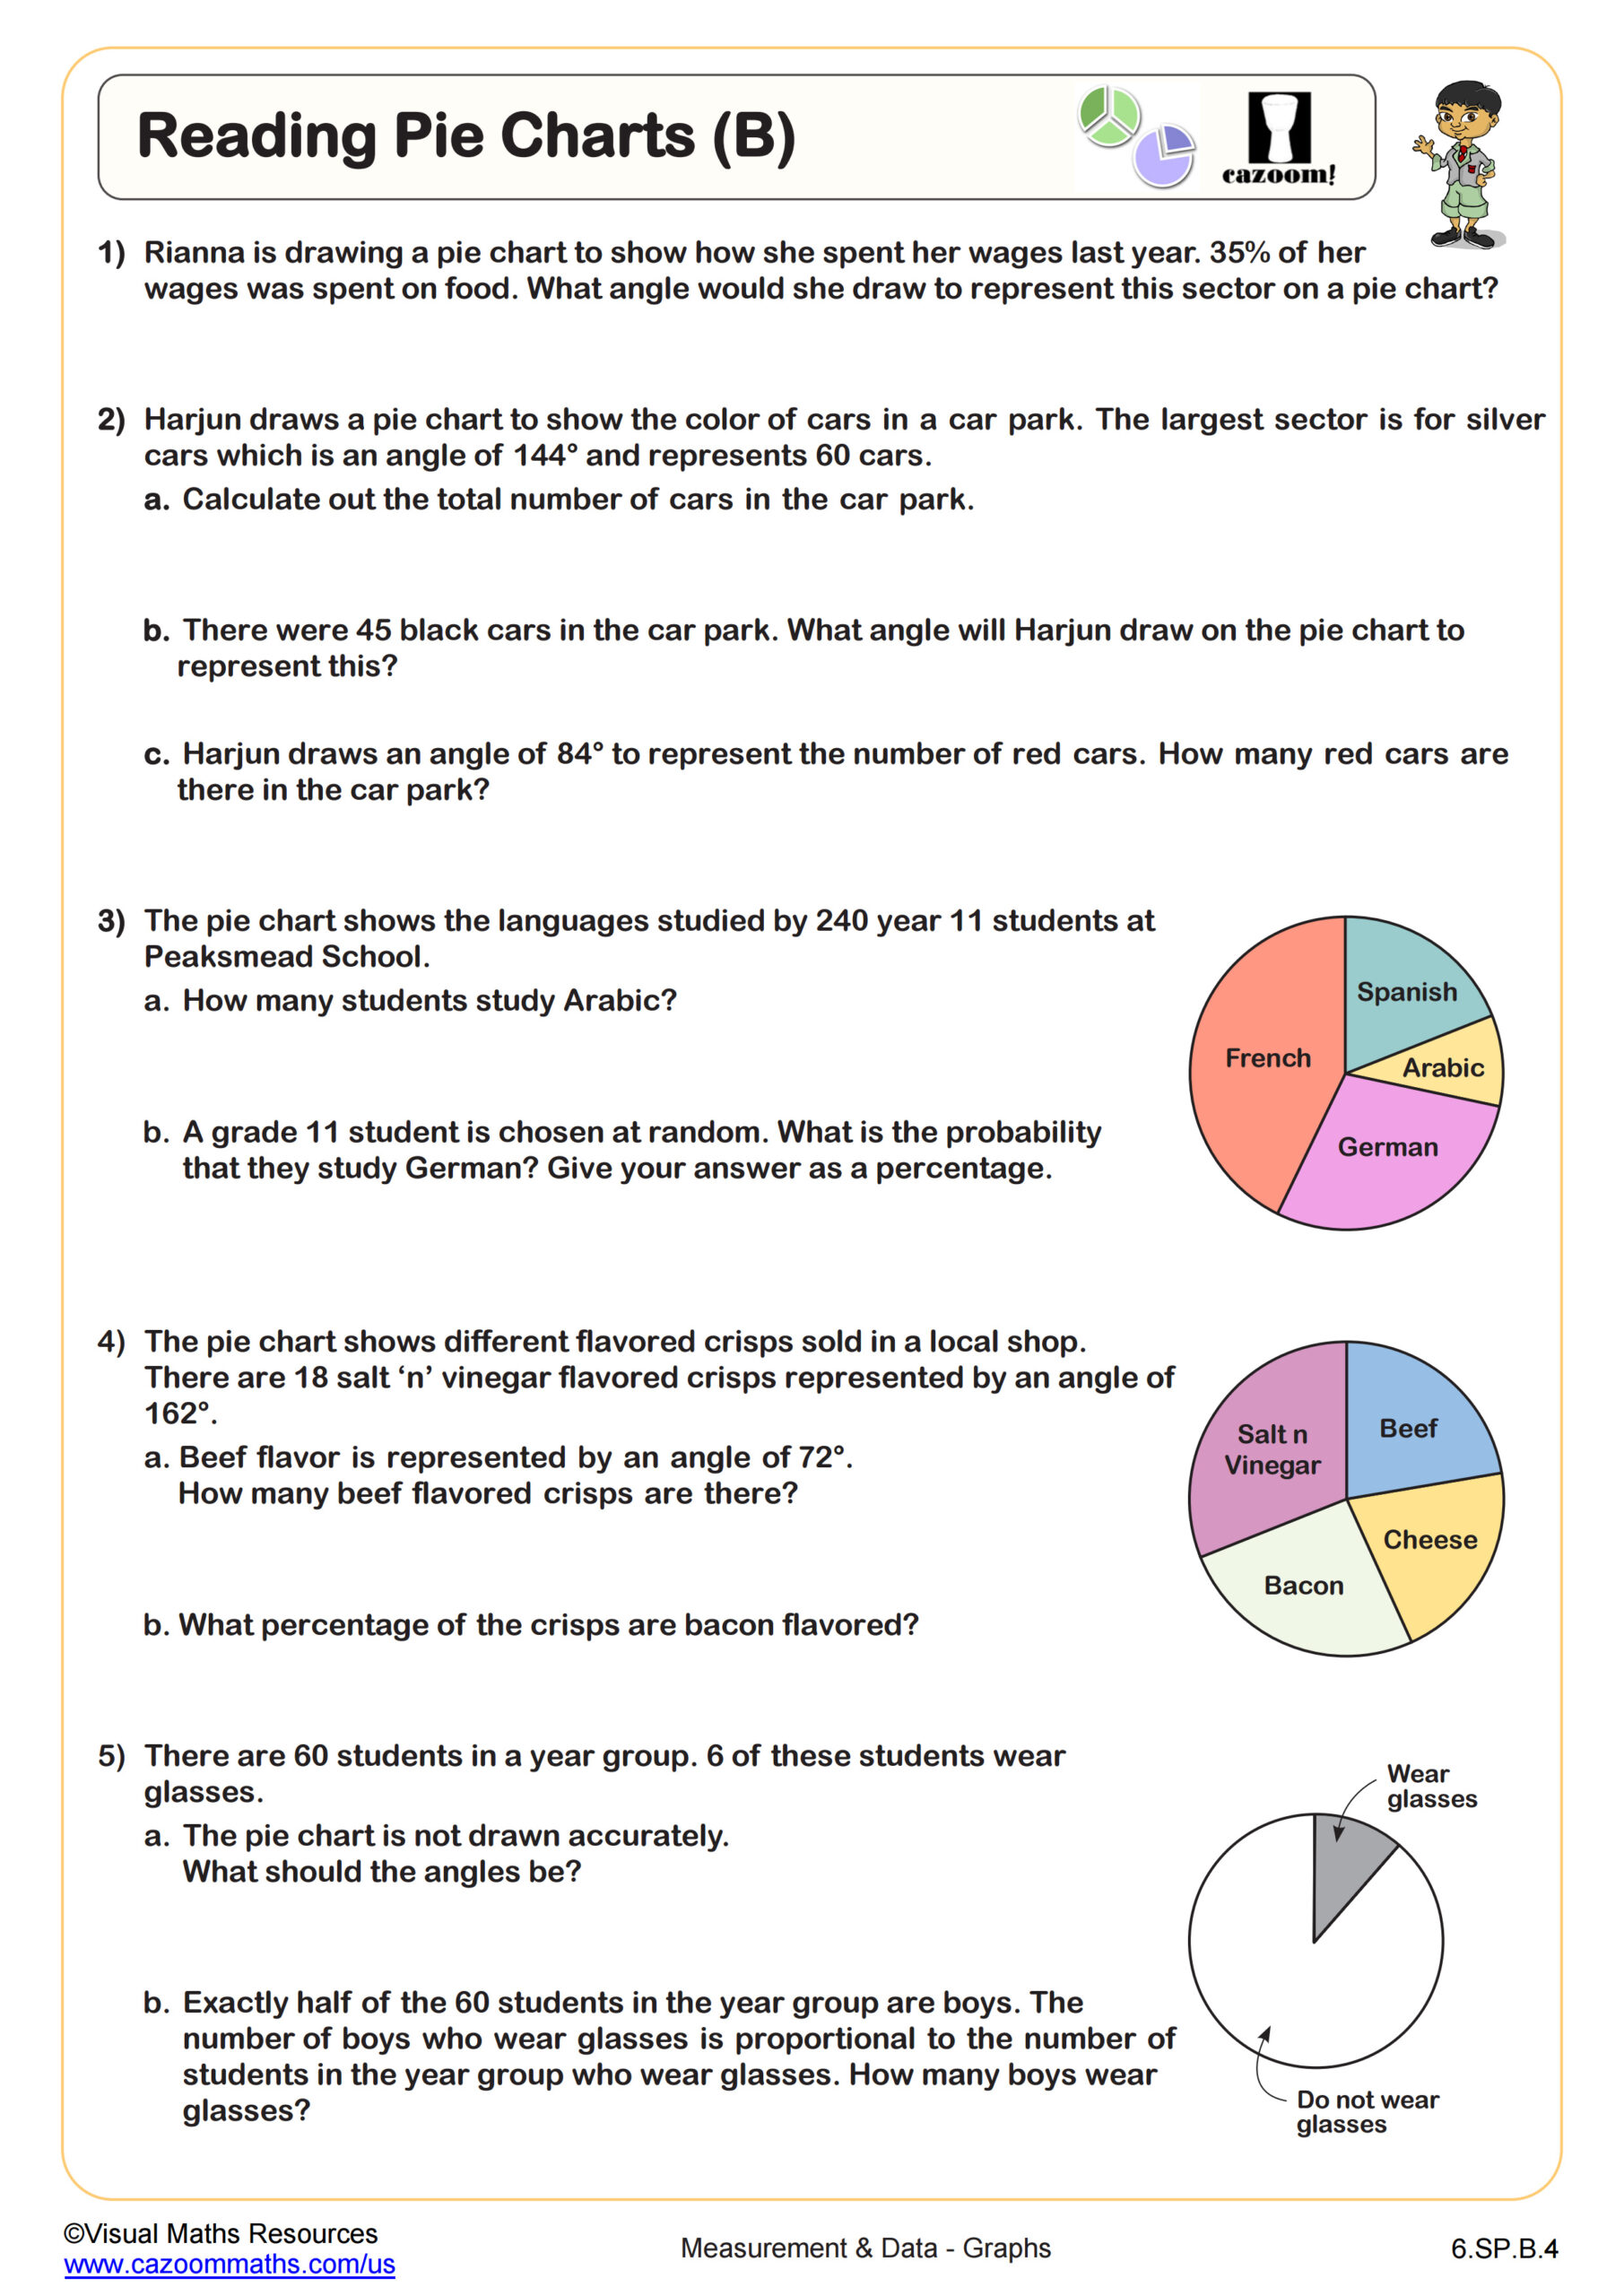
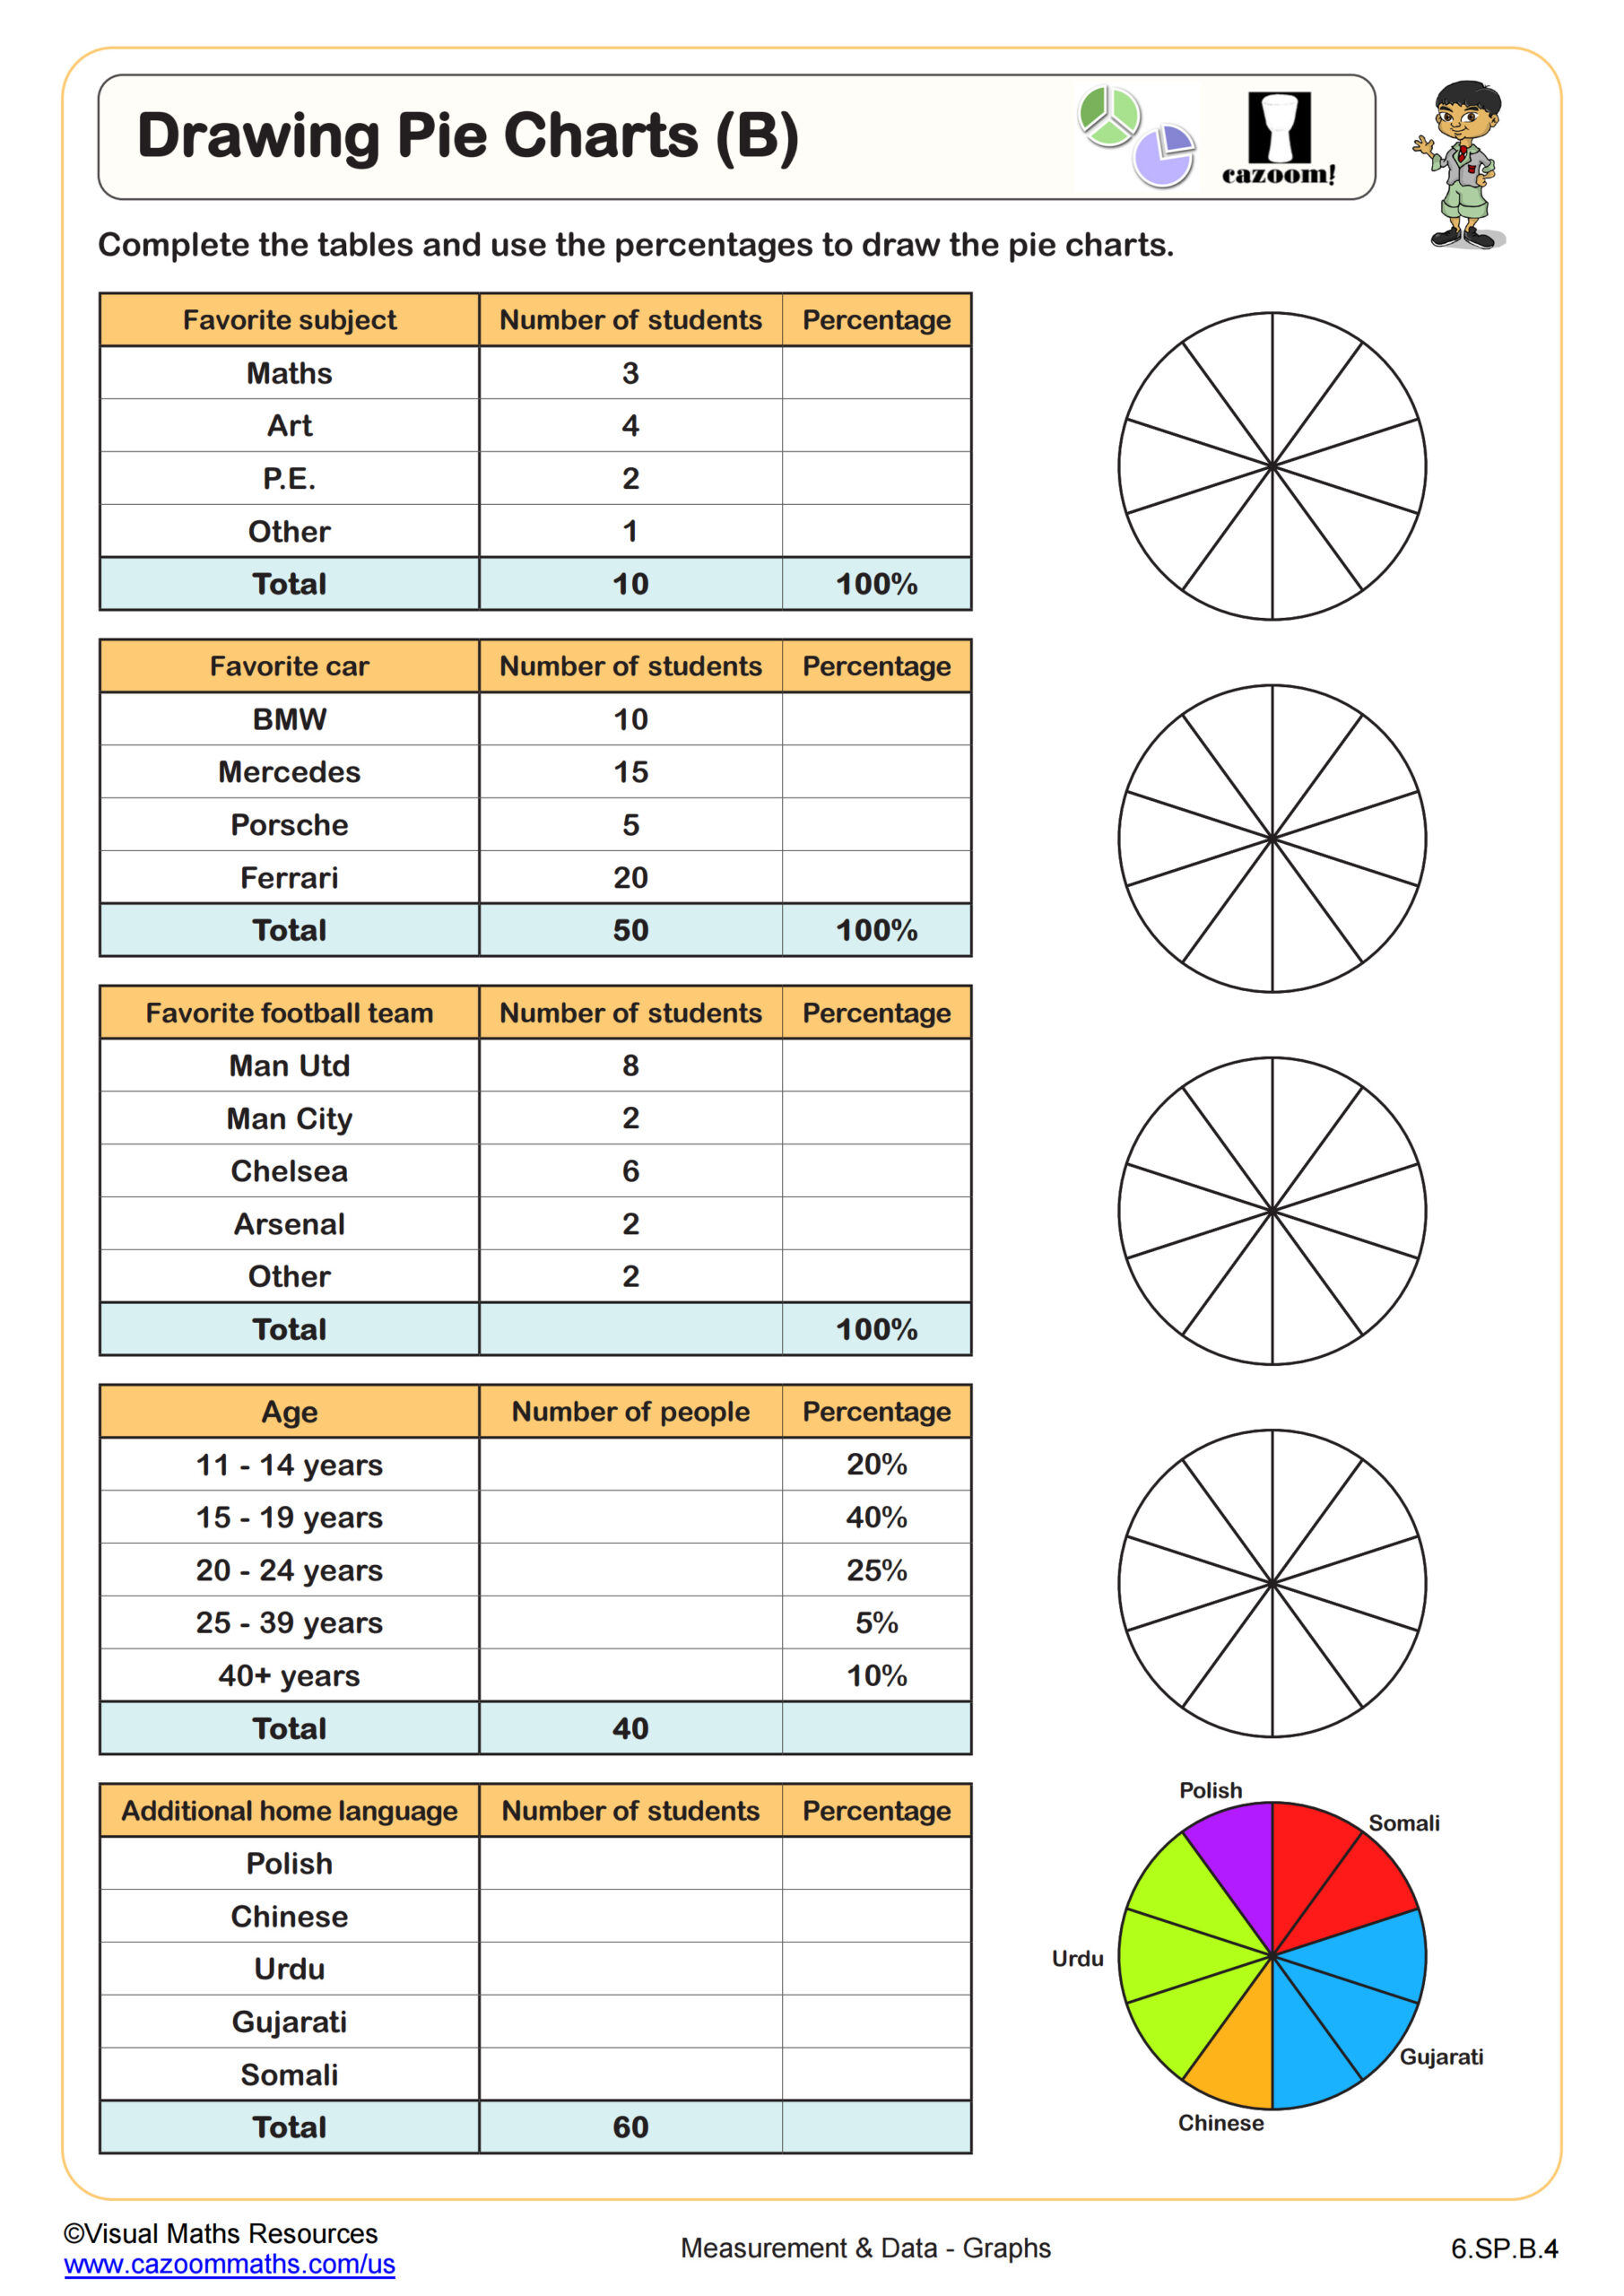
This worksheet follows Drawing Pie Charts (A) and Drawing Pie Charts (B), and now asks learners to calculate the angle given the frequency or percentage. Circles and an initial line are provided for each pie chart. Follow this worksheet with Completing Tables from Pie Charts.
All worksheets are created by the team of experienced teachers at Cazoom Math.
 Worksheet")
RELATED TO Drawing Pie Charts (C) WORKSHEET
Frequently Asked Questions
Students should be comfortable with basic multiplication and division since they'll need to convert frequencies and percentages into the corresponding angles for each sector. They should also understand that a complete circle contains 360 degrees and know how to work with fractions or decimals when calculating proportional relationships.