Back to:
Drawing Speed-Time Graphs WORKSHEET
Suitable for Grades: 8th Grade
CCSS: 8.F.B.5
CCSS Description: Describe qualitatively the functional relationship between two quantities by analyzing a graph (e.g., where the function is increasing or decreasing, linear or nonlinear). Sketch a graph that exhibits the qualitative features of a function that has been described verbally.
Drawing Speed-Time Graphs WORKSHEET DESCRIPTION
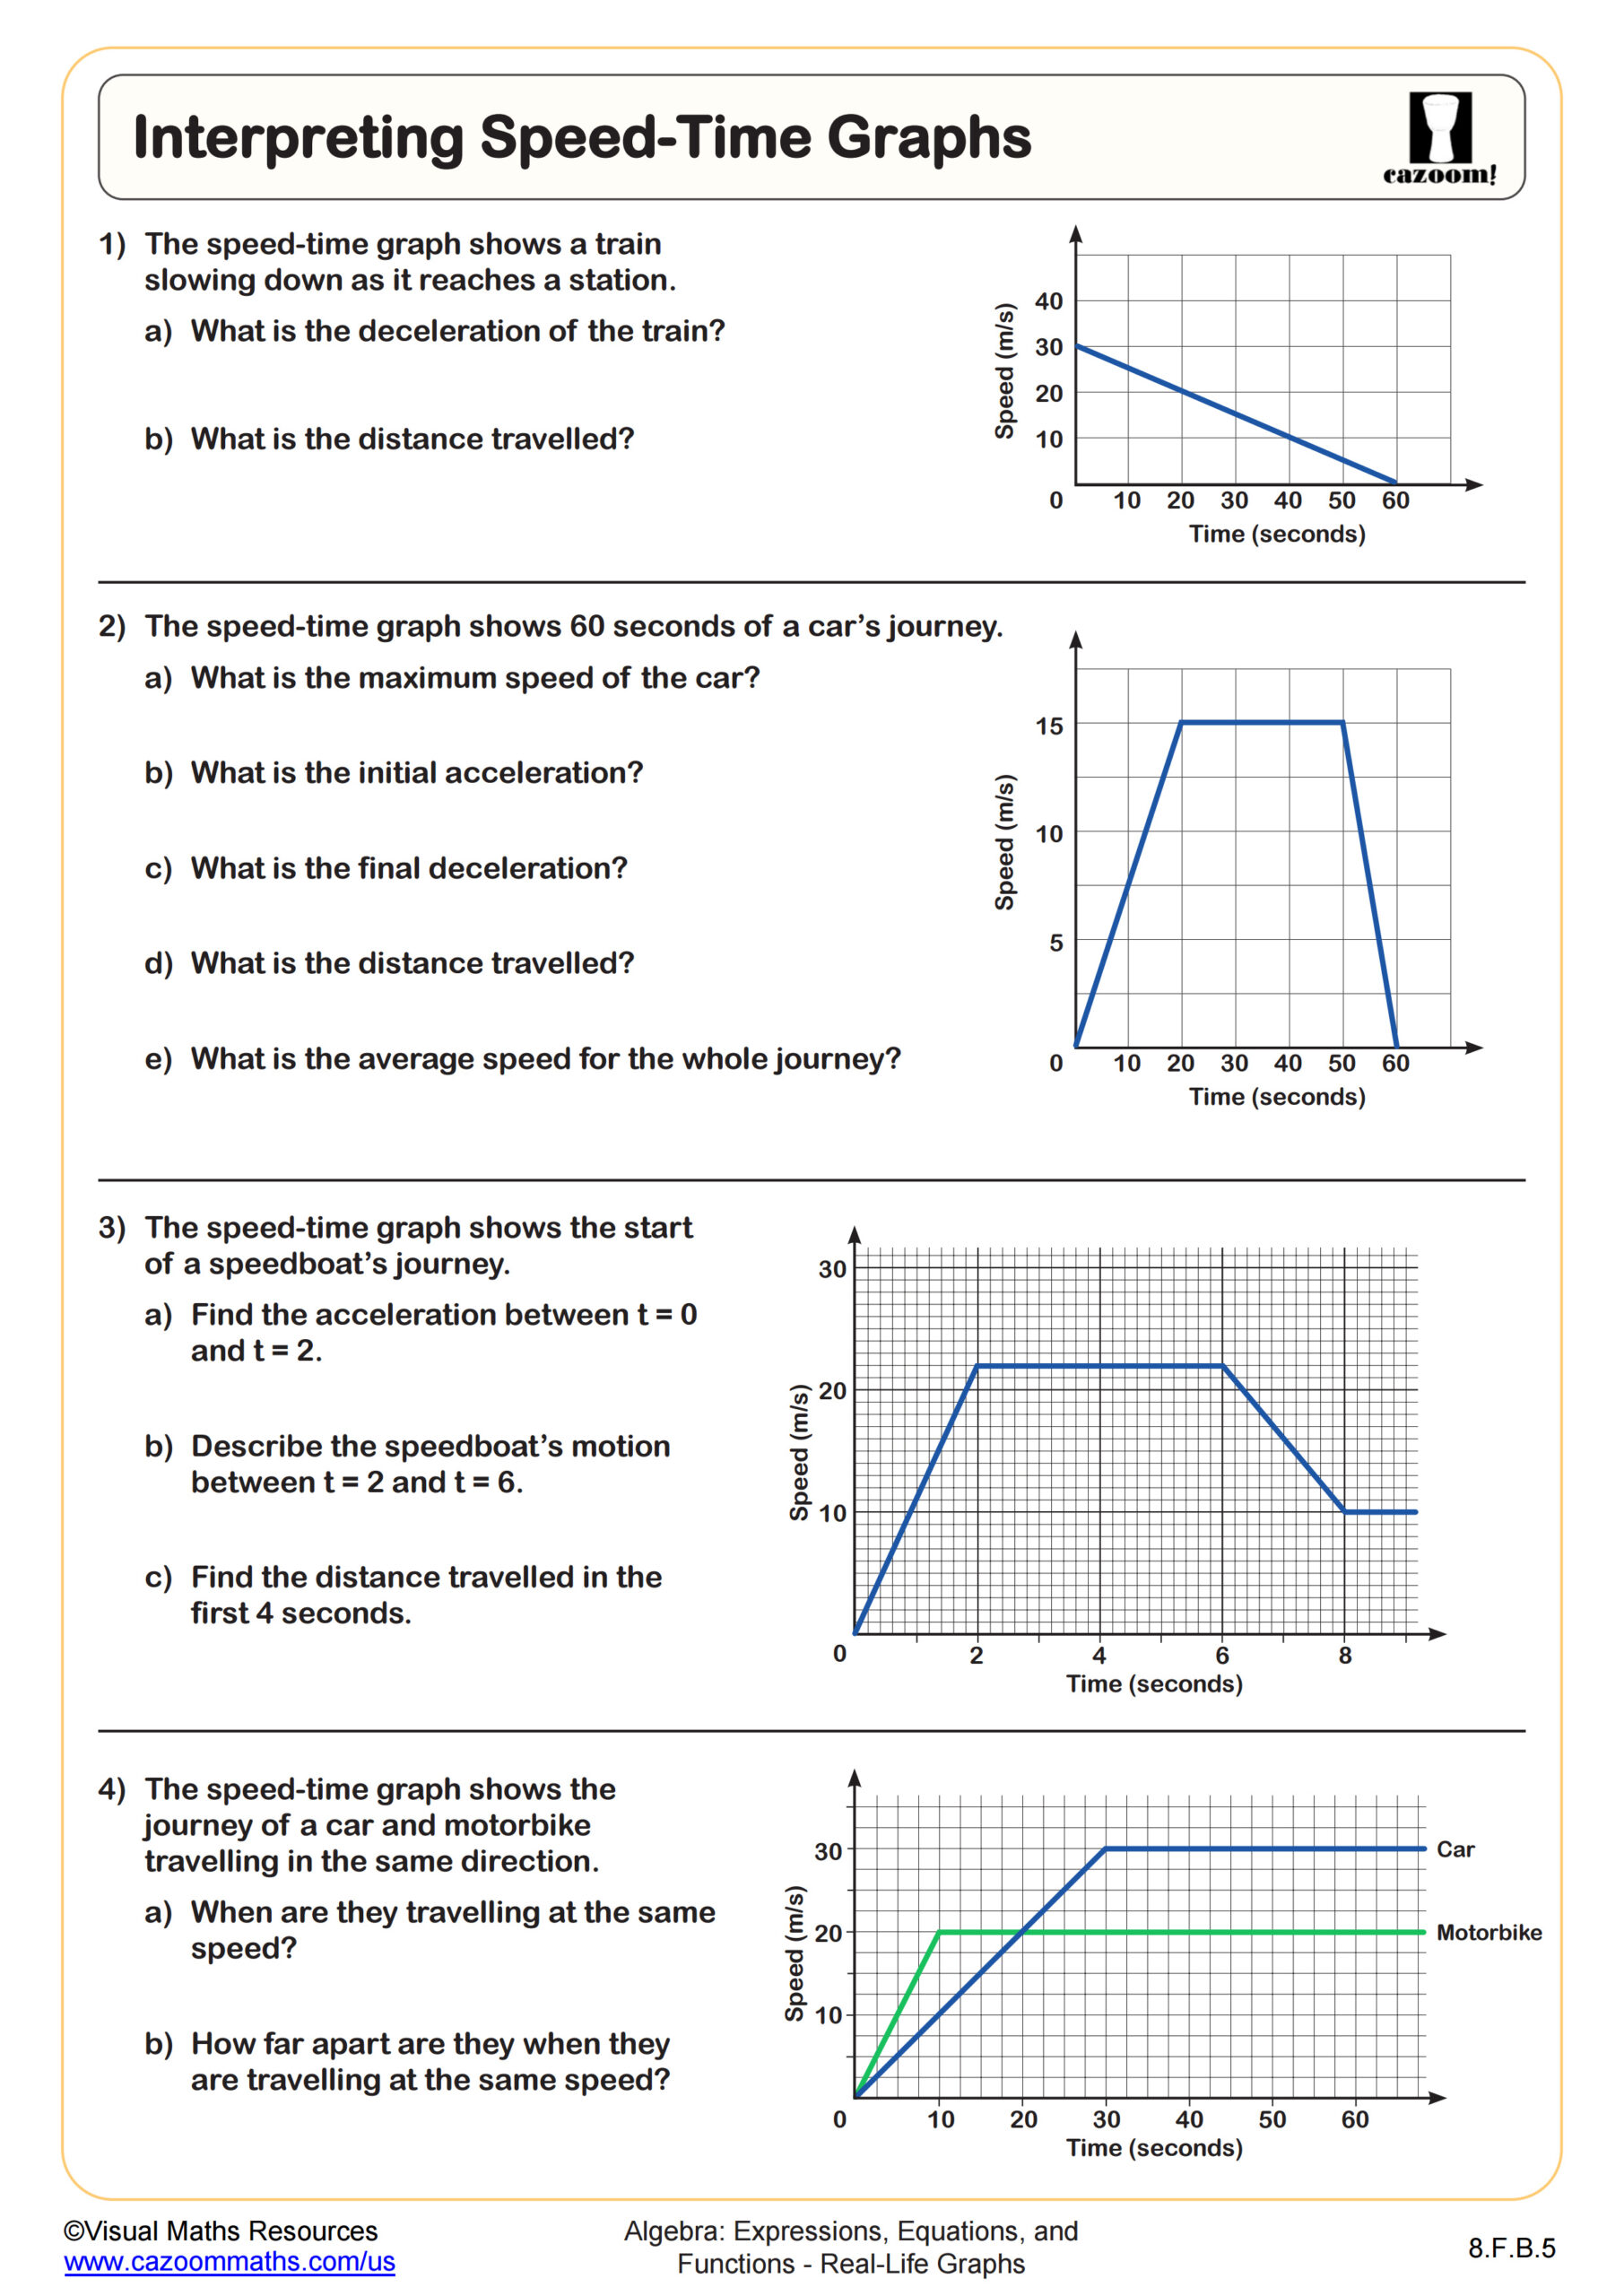
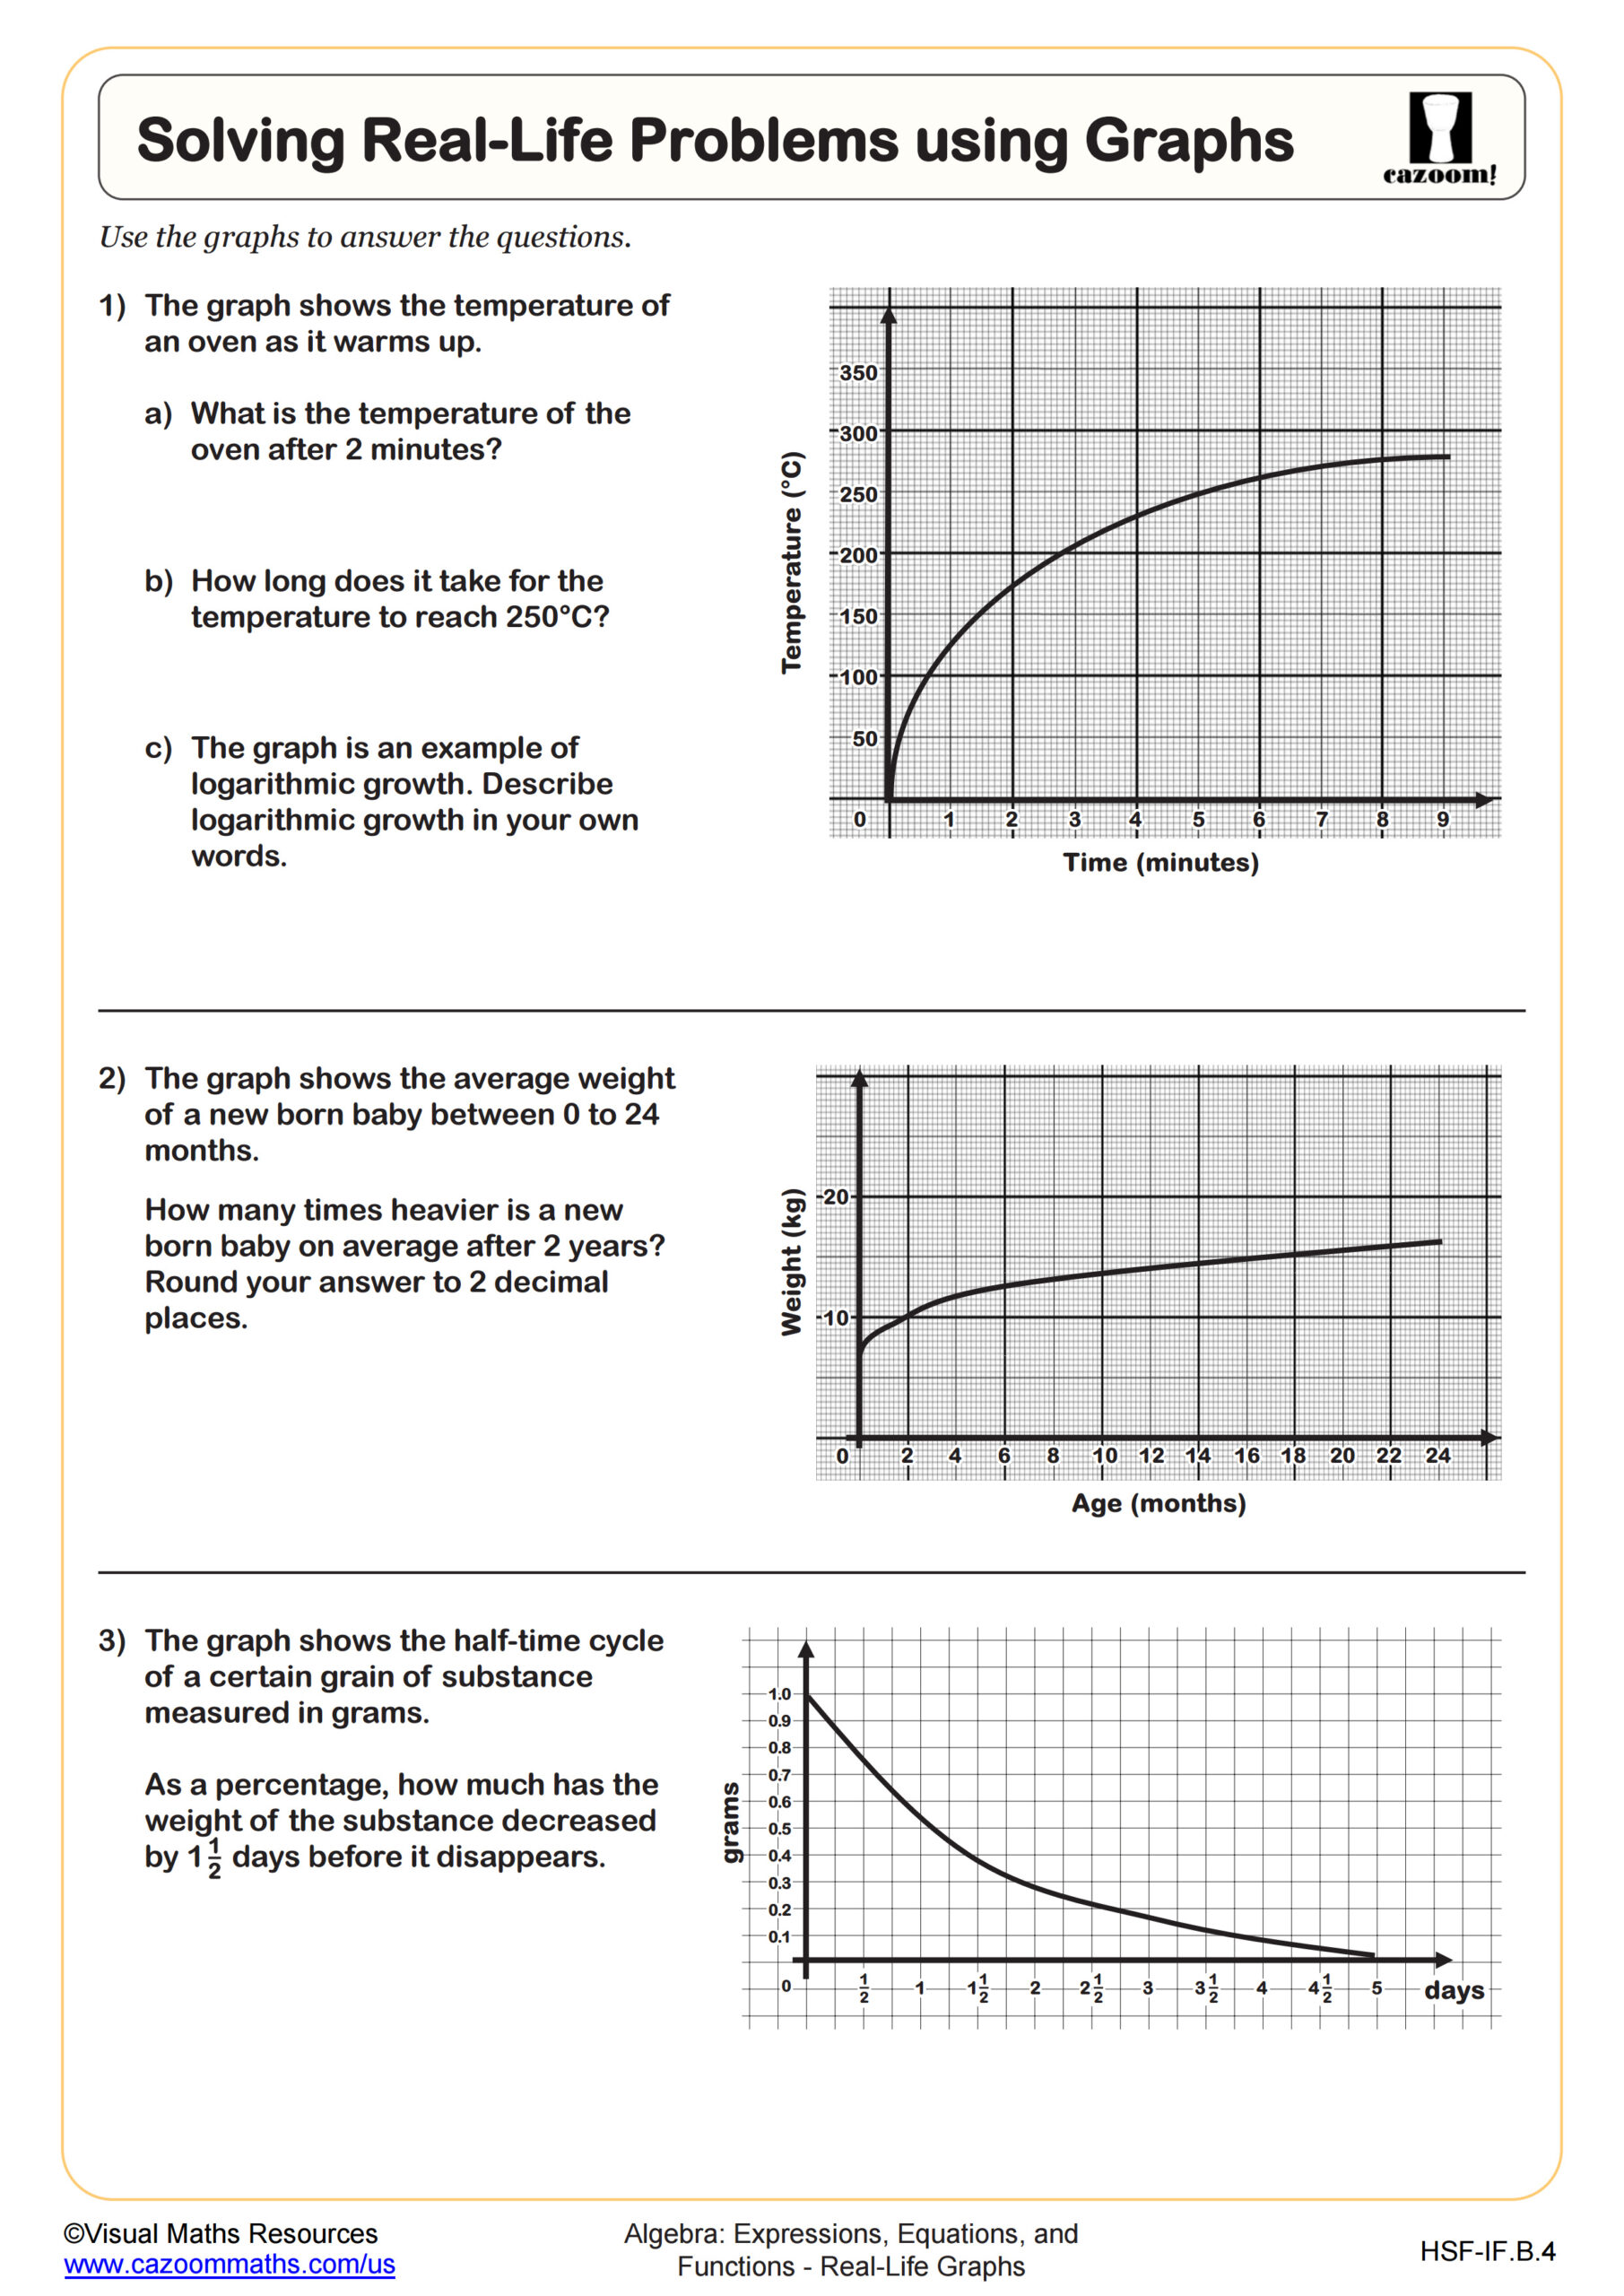
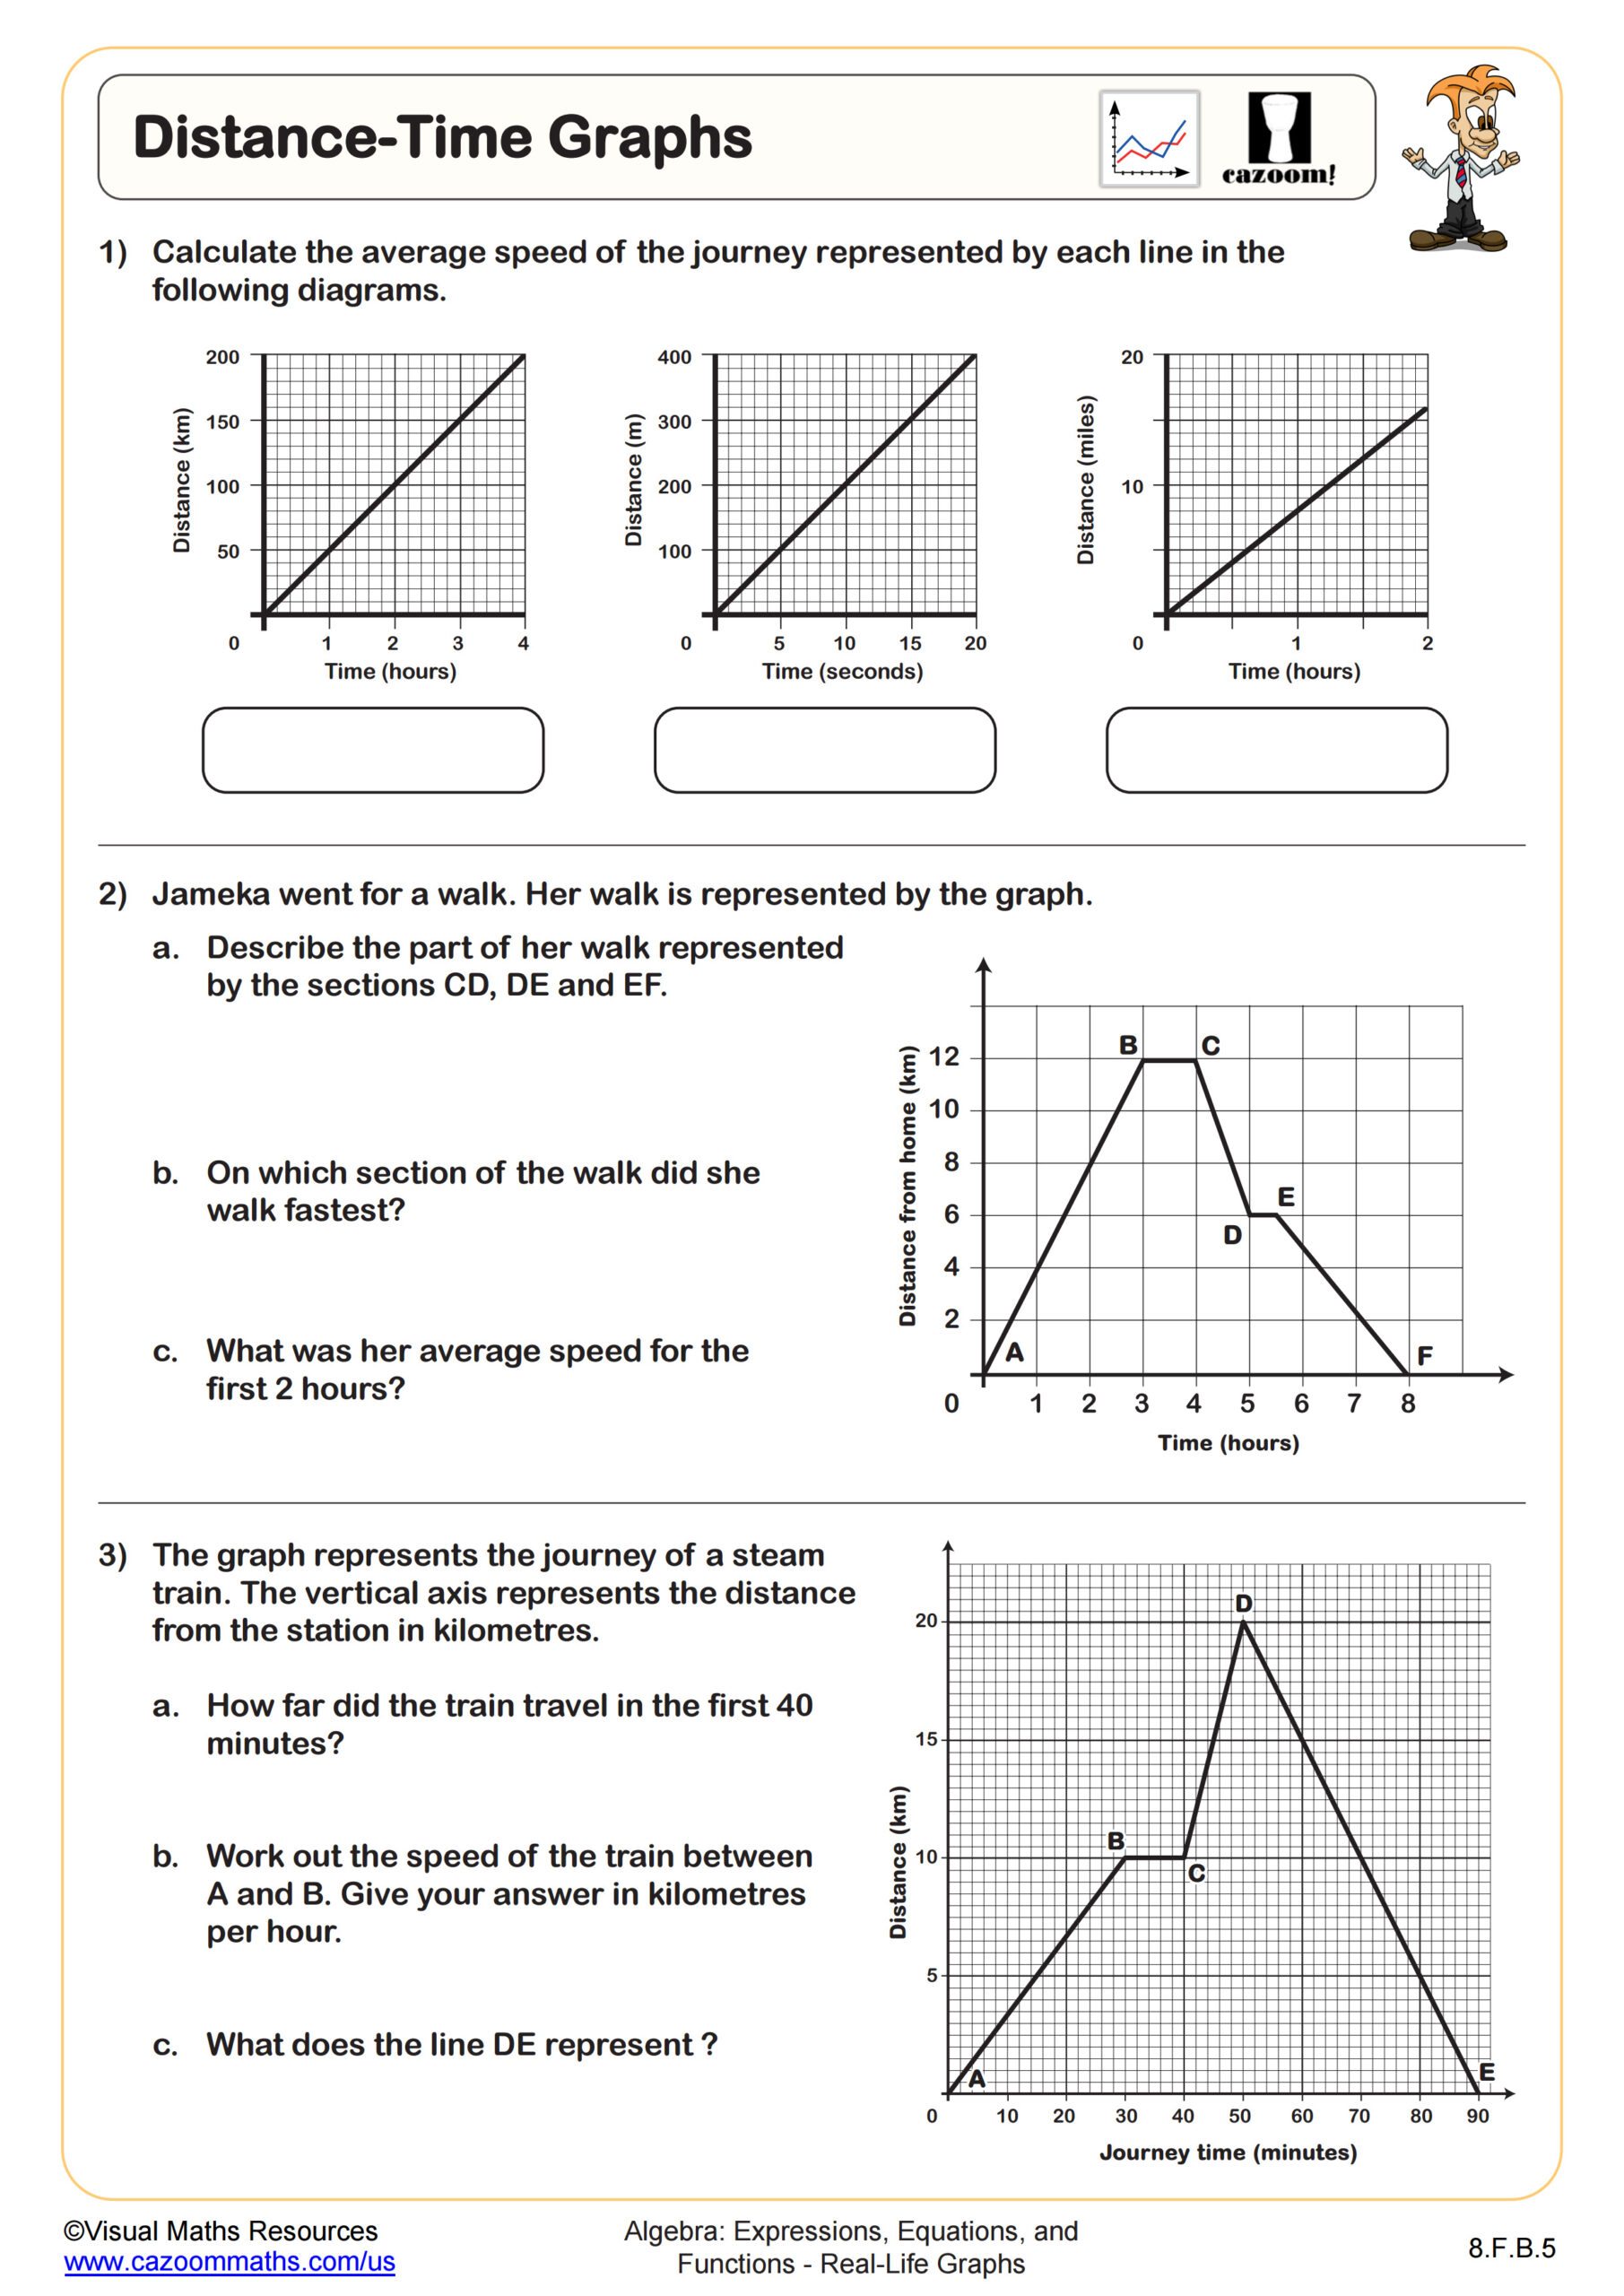
This worksheet gives some practice or drawing speed-time graphs on given axes. Learners will be provided with information such as acceleration, periods of constant speed or distance travelled in a given time, and will have to complete the graphs for described journeys.
All worksheets are created by the team of experienced teachers at Cazoom Math.

RELATED TO Drawing Speed-Time Graphs WORKSHEET
Frequently Asked Questions
This worksheet is designed for 8th grade students who are developing their understanding of real life graphs. At this level, students are ready to interpret motion scenarios and translate them into visual representations. The skills practiced here build a foundation for more advanced physics and algebra concepts they'll encounter in high school.