Back to:
Equation of the Line of Best Fit WORKSHEET
Suitable for Grades: Algebra I, IM 1
CCSS: 8.SP.A.3, HSS.ID.B.6
CCSS Description: Use the equation of a linear model to solve problems in the context of bivariate measurement data, interpreting the slope and intercept. For example, in a linear model for a biology experiment, interpret a slope of 1.5 cm/hr as meaning that an additional hour of sunlight each day is associated with an additional 1.5 cm in mature plant height.
Represent data on two quantitative variables on a scatter plot, and describe how the variables are related. a. Fit a function to the data; use functions fitted to data to solve problems in the context of the data. Use given functions or choose a function suggested by the context. Emphasize linear, quadratic, and exponential models. b. Informally assess the fit of a function by plotting and analyzing residuals. c. Fit a linear function for a scatter plot that suggests a linear association.
Represent data on two quantitative variables on a scatter plot, and describe how the variables are related. a. Fit a function to the data; use functions fitted to data to solve problems in the context of the data. Use given functions or choose a function suggested by the context. Emphasize linear, quadratic, and exponential models. b. Informally assess the fit of a function by plotting and analyzing residuals. c. Fit a linear function for a scatter plot that suggests a linear association.
Equation of the Line of Best Fit WORKSHEET DESCRIPTION
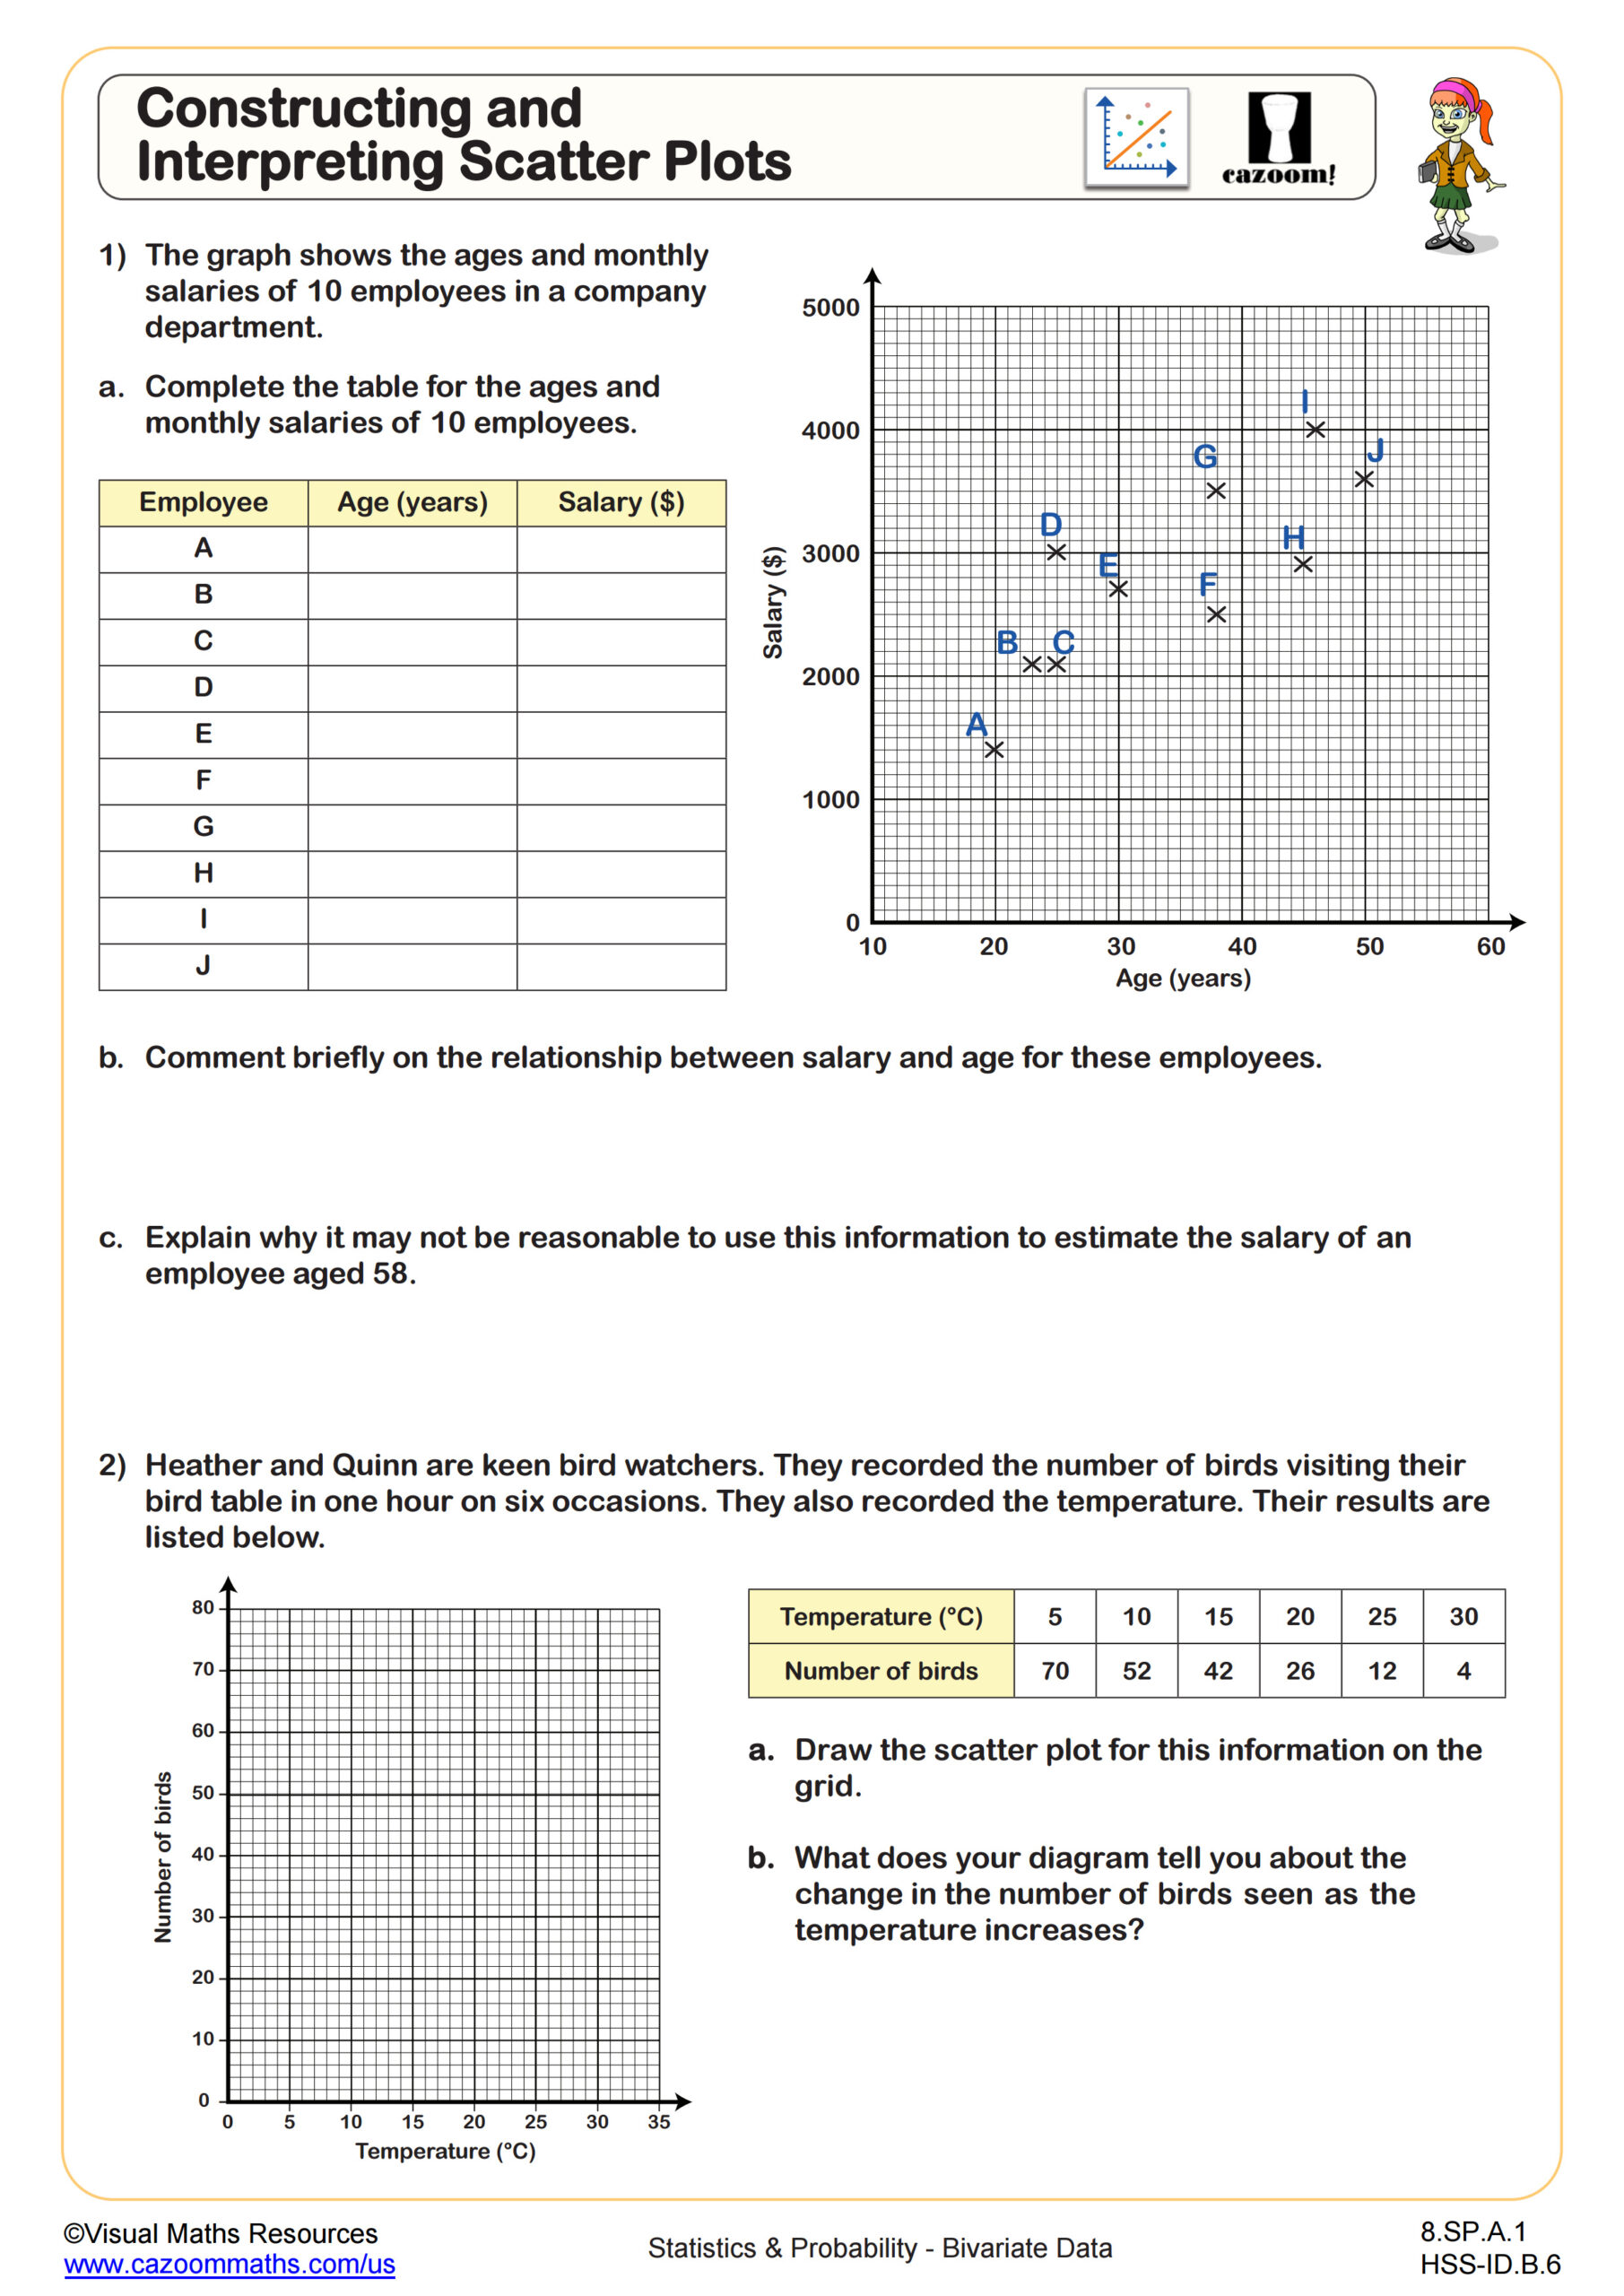
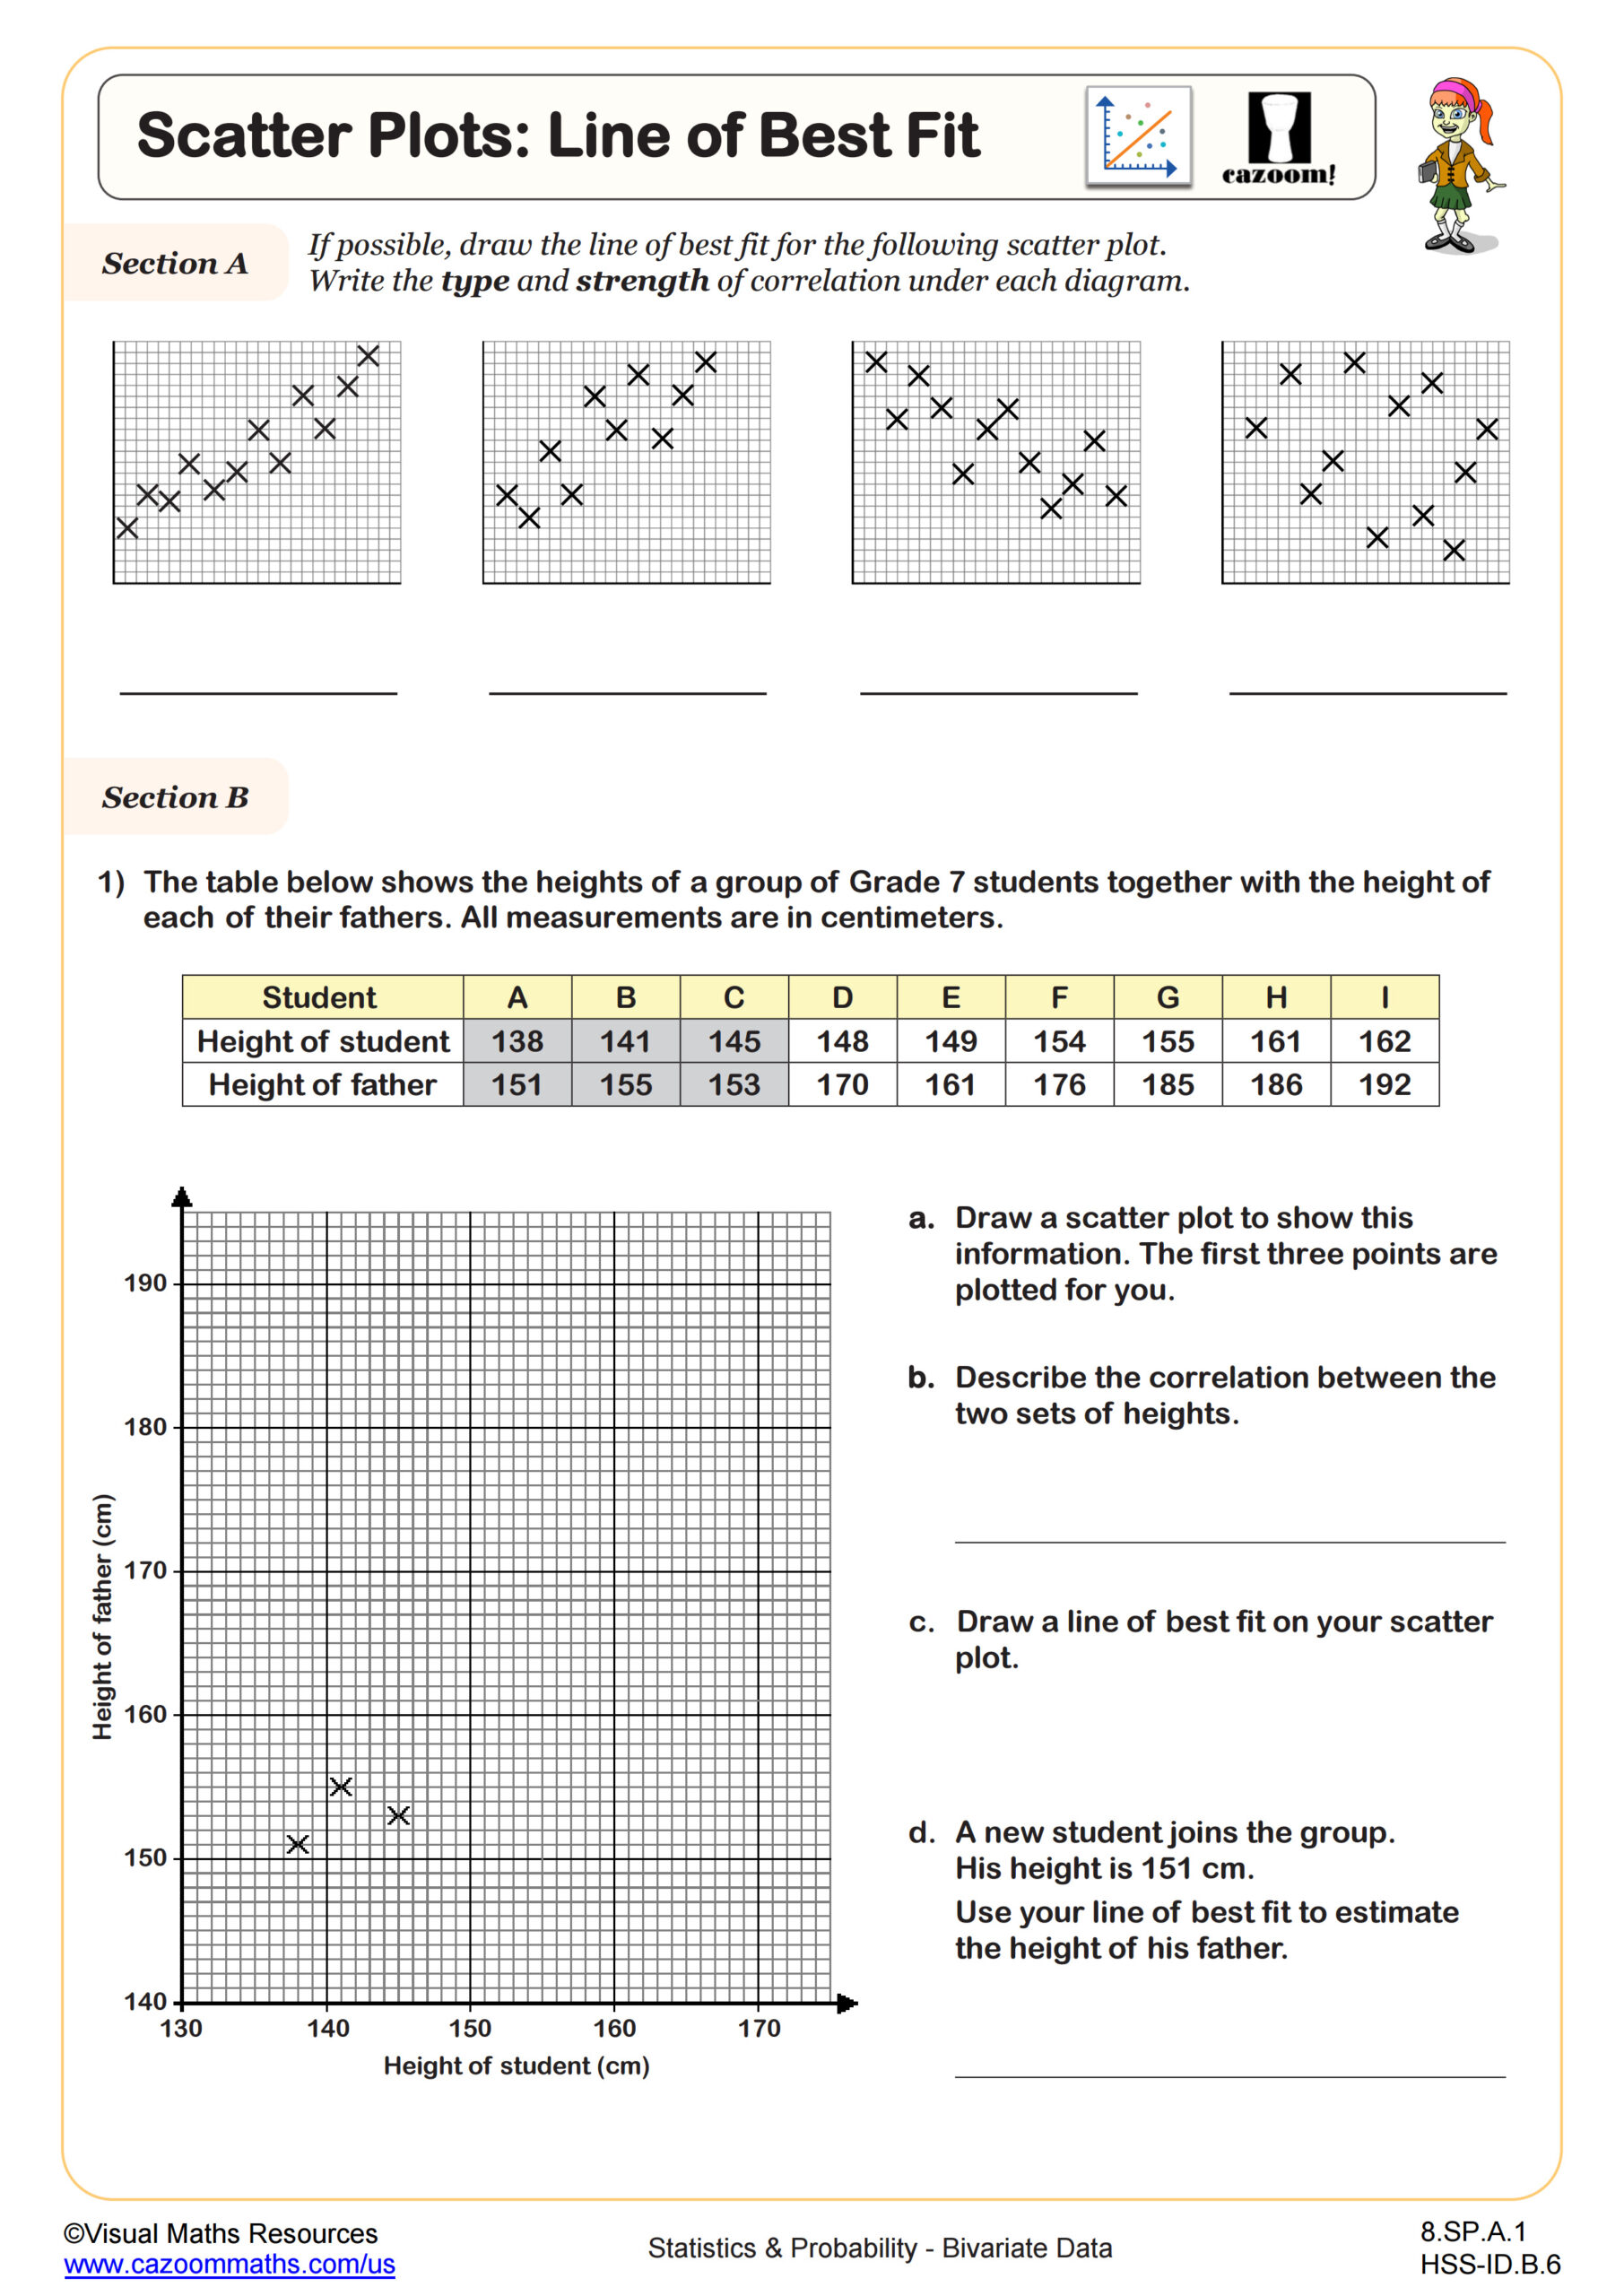
This worksheet helps students practice drawing and interpreting lines of best fit on scatter graphs.
In Section A, students plot a line of best fit, select two suitable points, and use these to calculate the equation in the form y = mx + c. They are encouraged to think carefully about choosing an appropriate level of accuracy for their gradient and intercept values.
Section B builds on this by asking students to use their equations to make estimates and predictions, applying both interpolation and extrapolation.
Realistic contexts such as student study hours compared with grades, and a baby’s growth over time, make the questions engaging and relatable. By working through these activities, learners strengthen their skills in handling data, deepen their understanding of correlation, and gain confidence with straight line equations in statistical settings.
All worksheets are created by the team of experienced teachers at Cazoom Math.

RELATED TO Equation of the Line of Best Fit WORKSHEET
Frequently Asked Questions
This worksheet is designed for IM 1 and Algebra I students who are ready to work with linear equations in statistical contexts. These grade levels typically have the foundational skills needed to calculate slope and y-intercept from coordinate points, then apply those equations to make meaningful predictions from real-world data.