Graphing Cubic Functions WORKSHEET
Construct linear and exponential functions, including arithmetic and geometric sequences, given a graph, a description of a relationship, or two input‑output pairs (include reading these from a table).
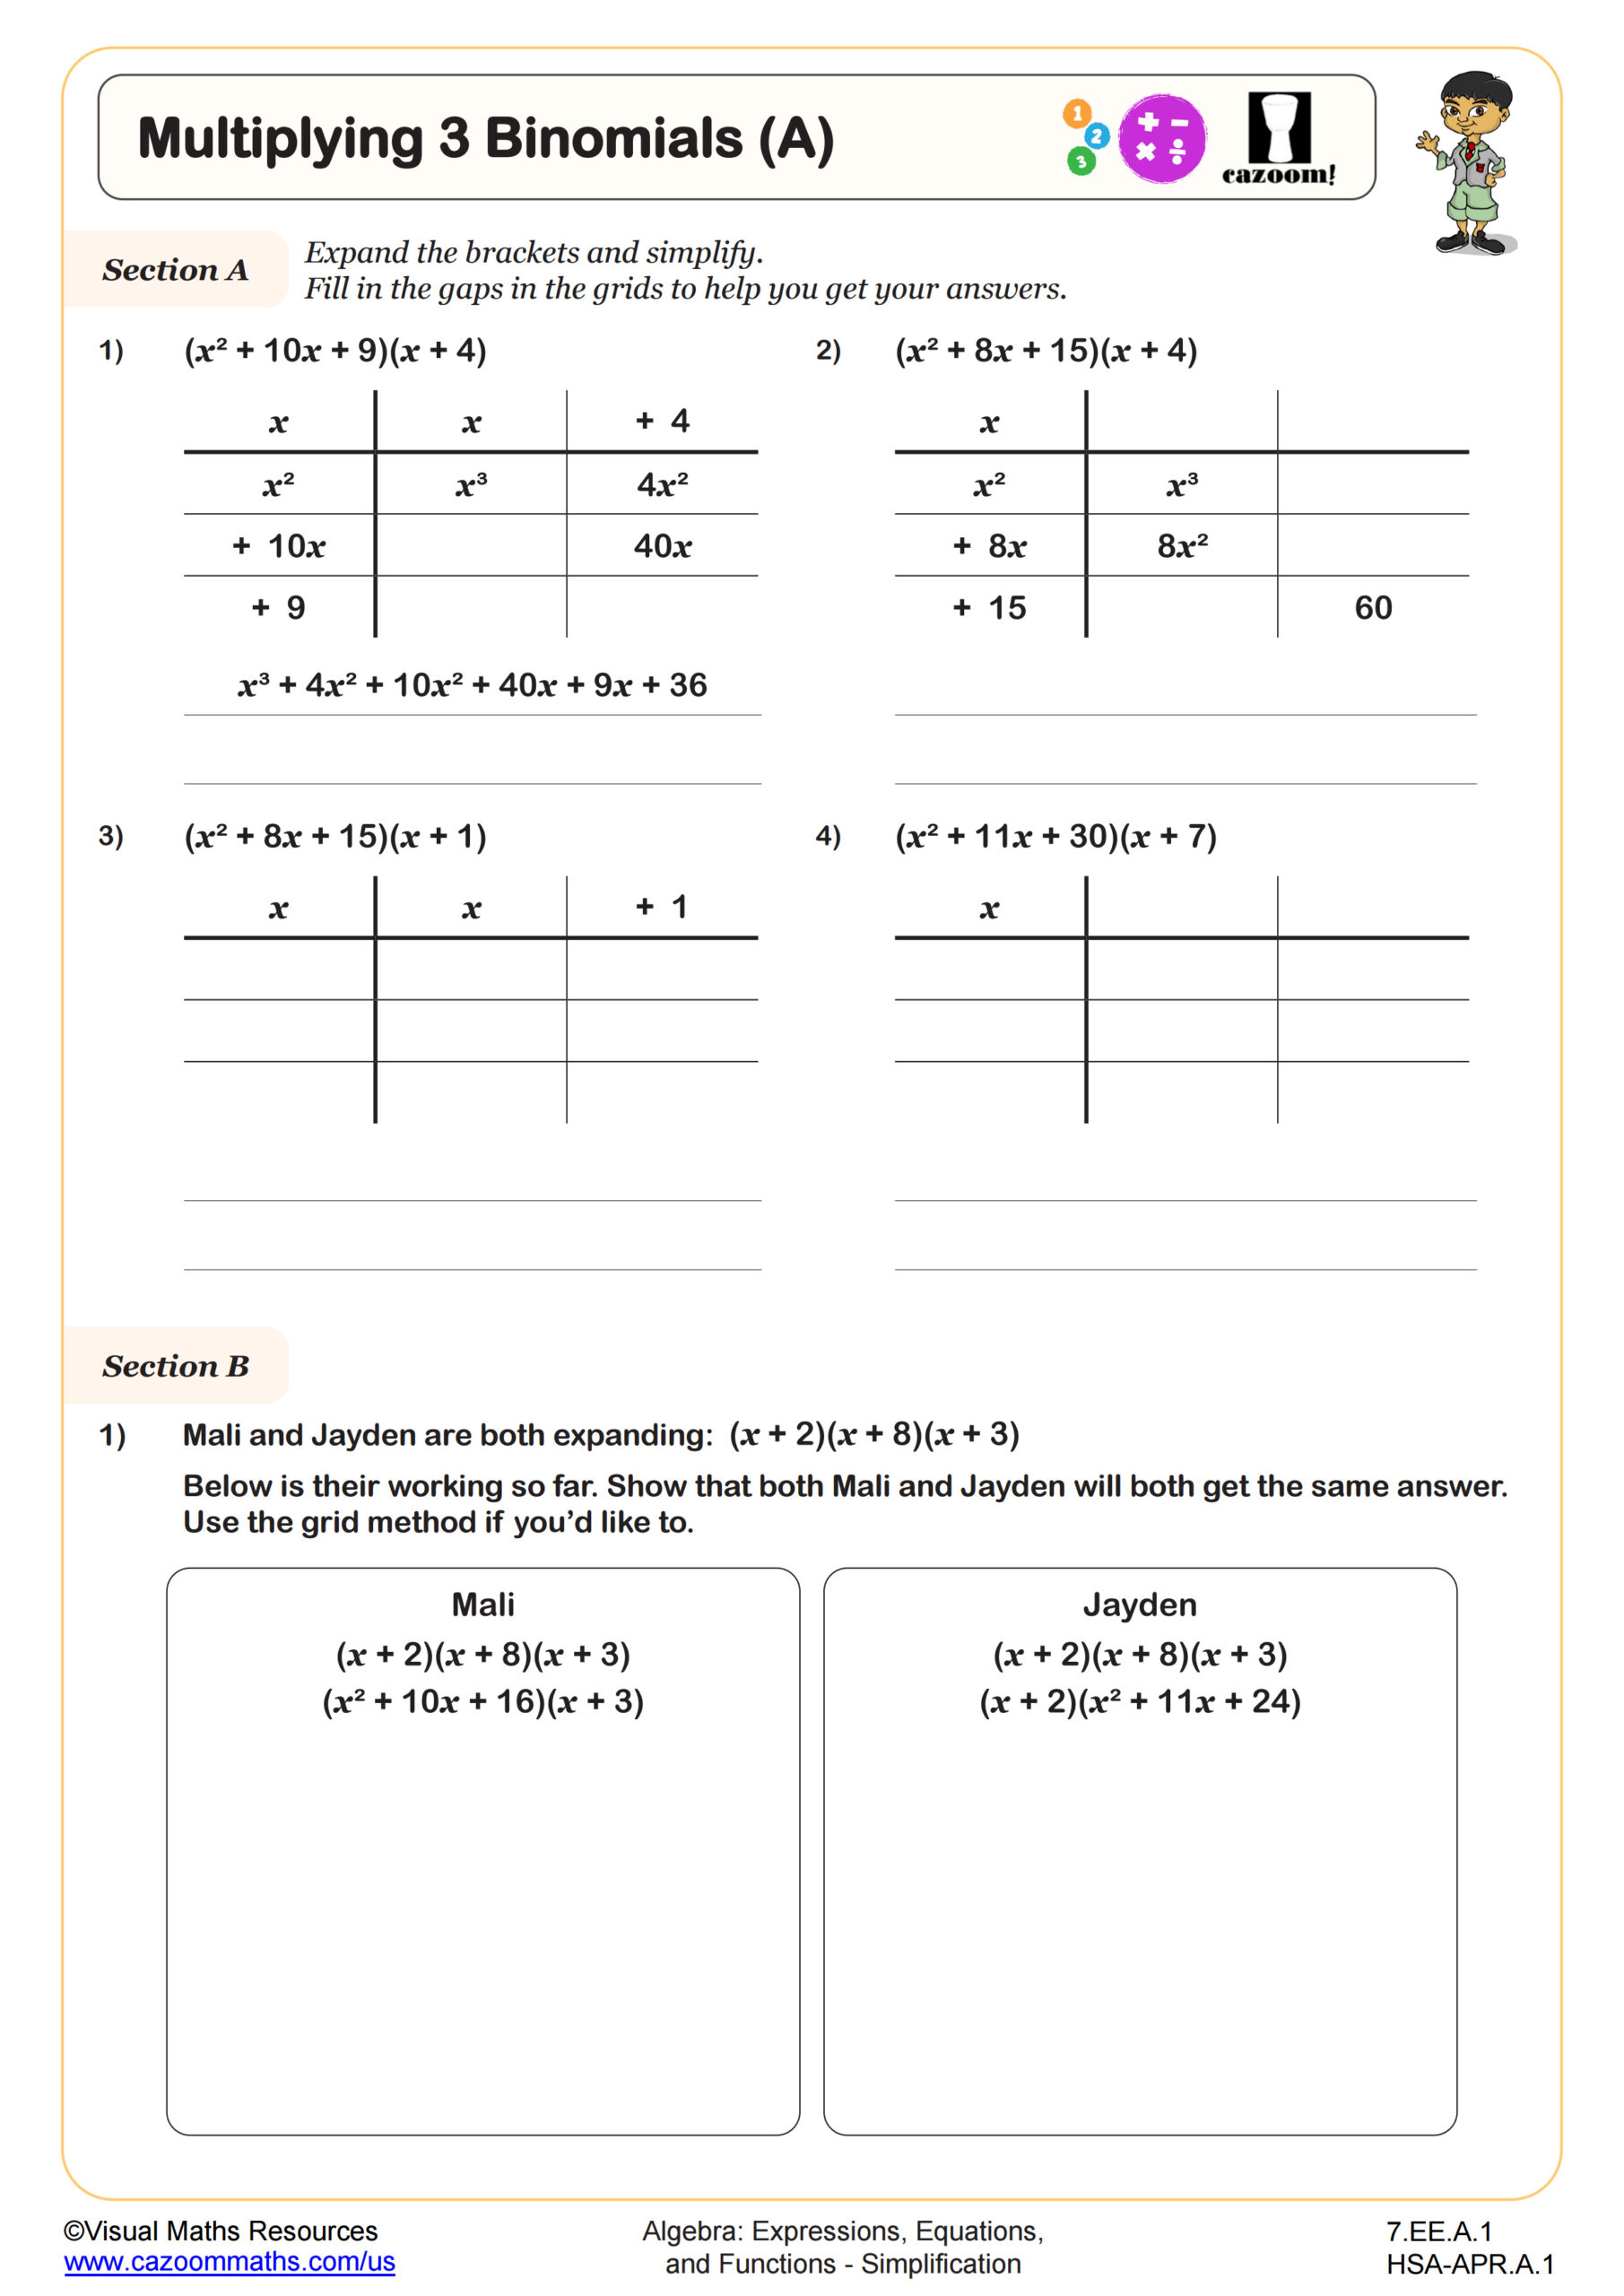
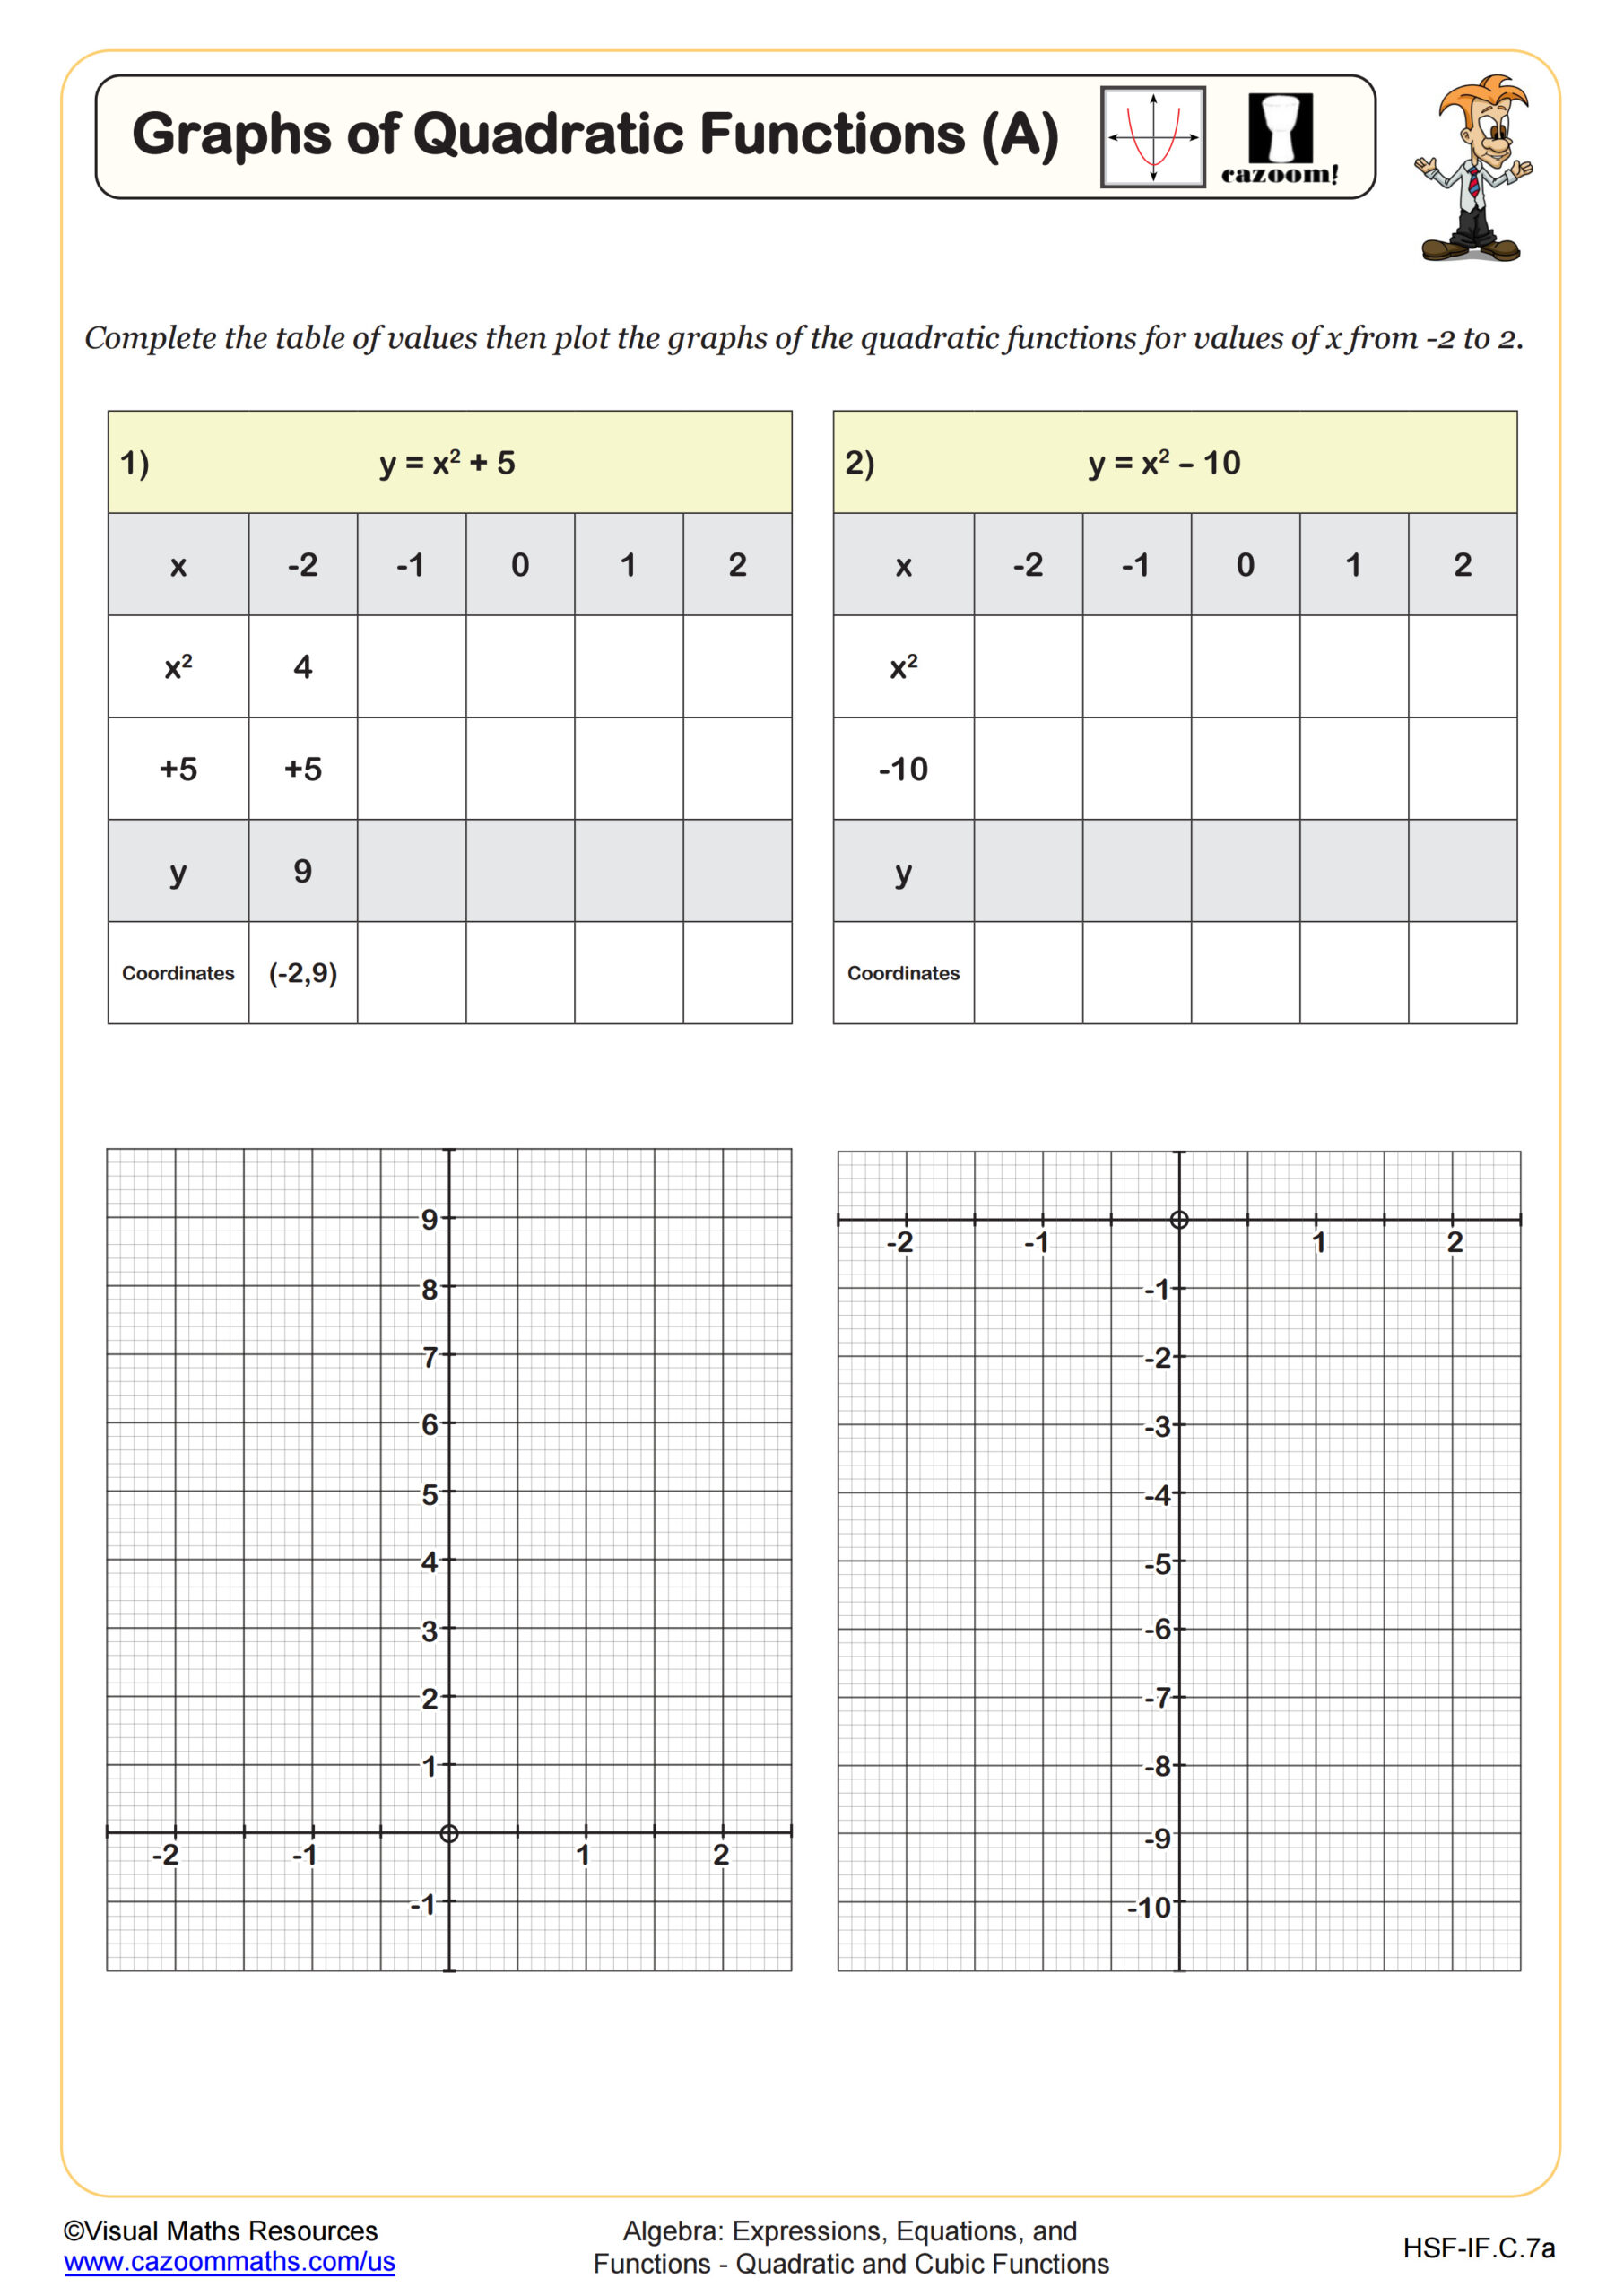
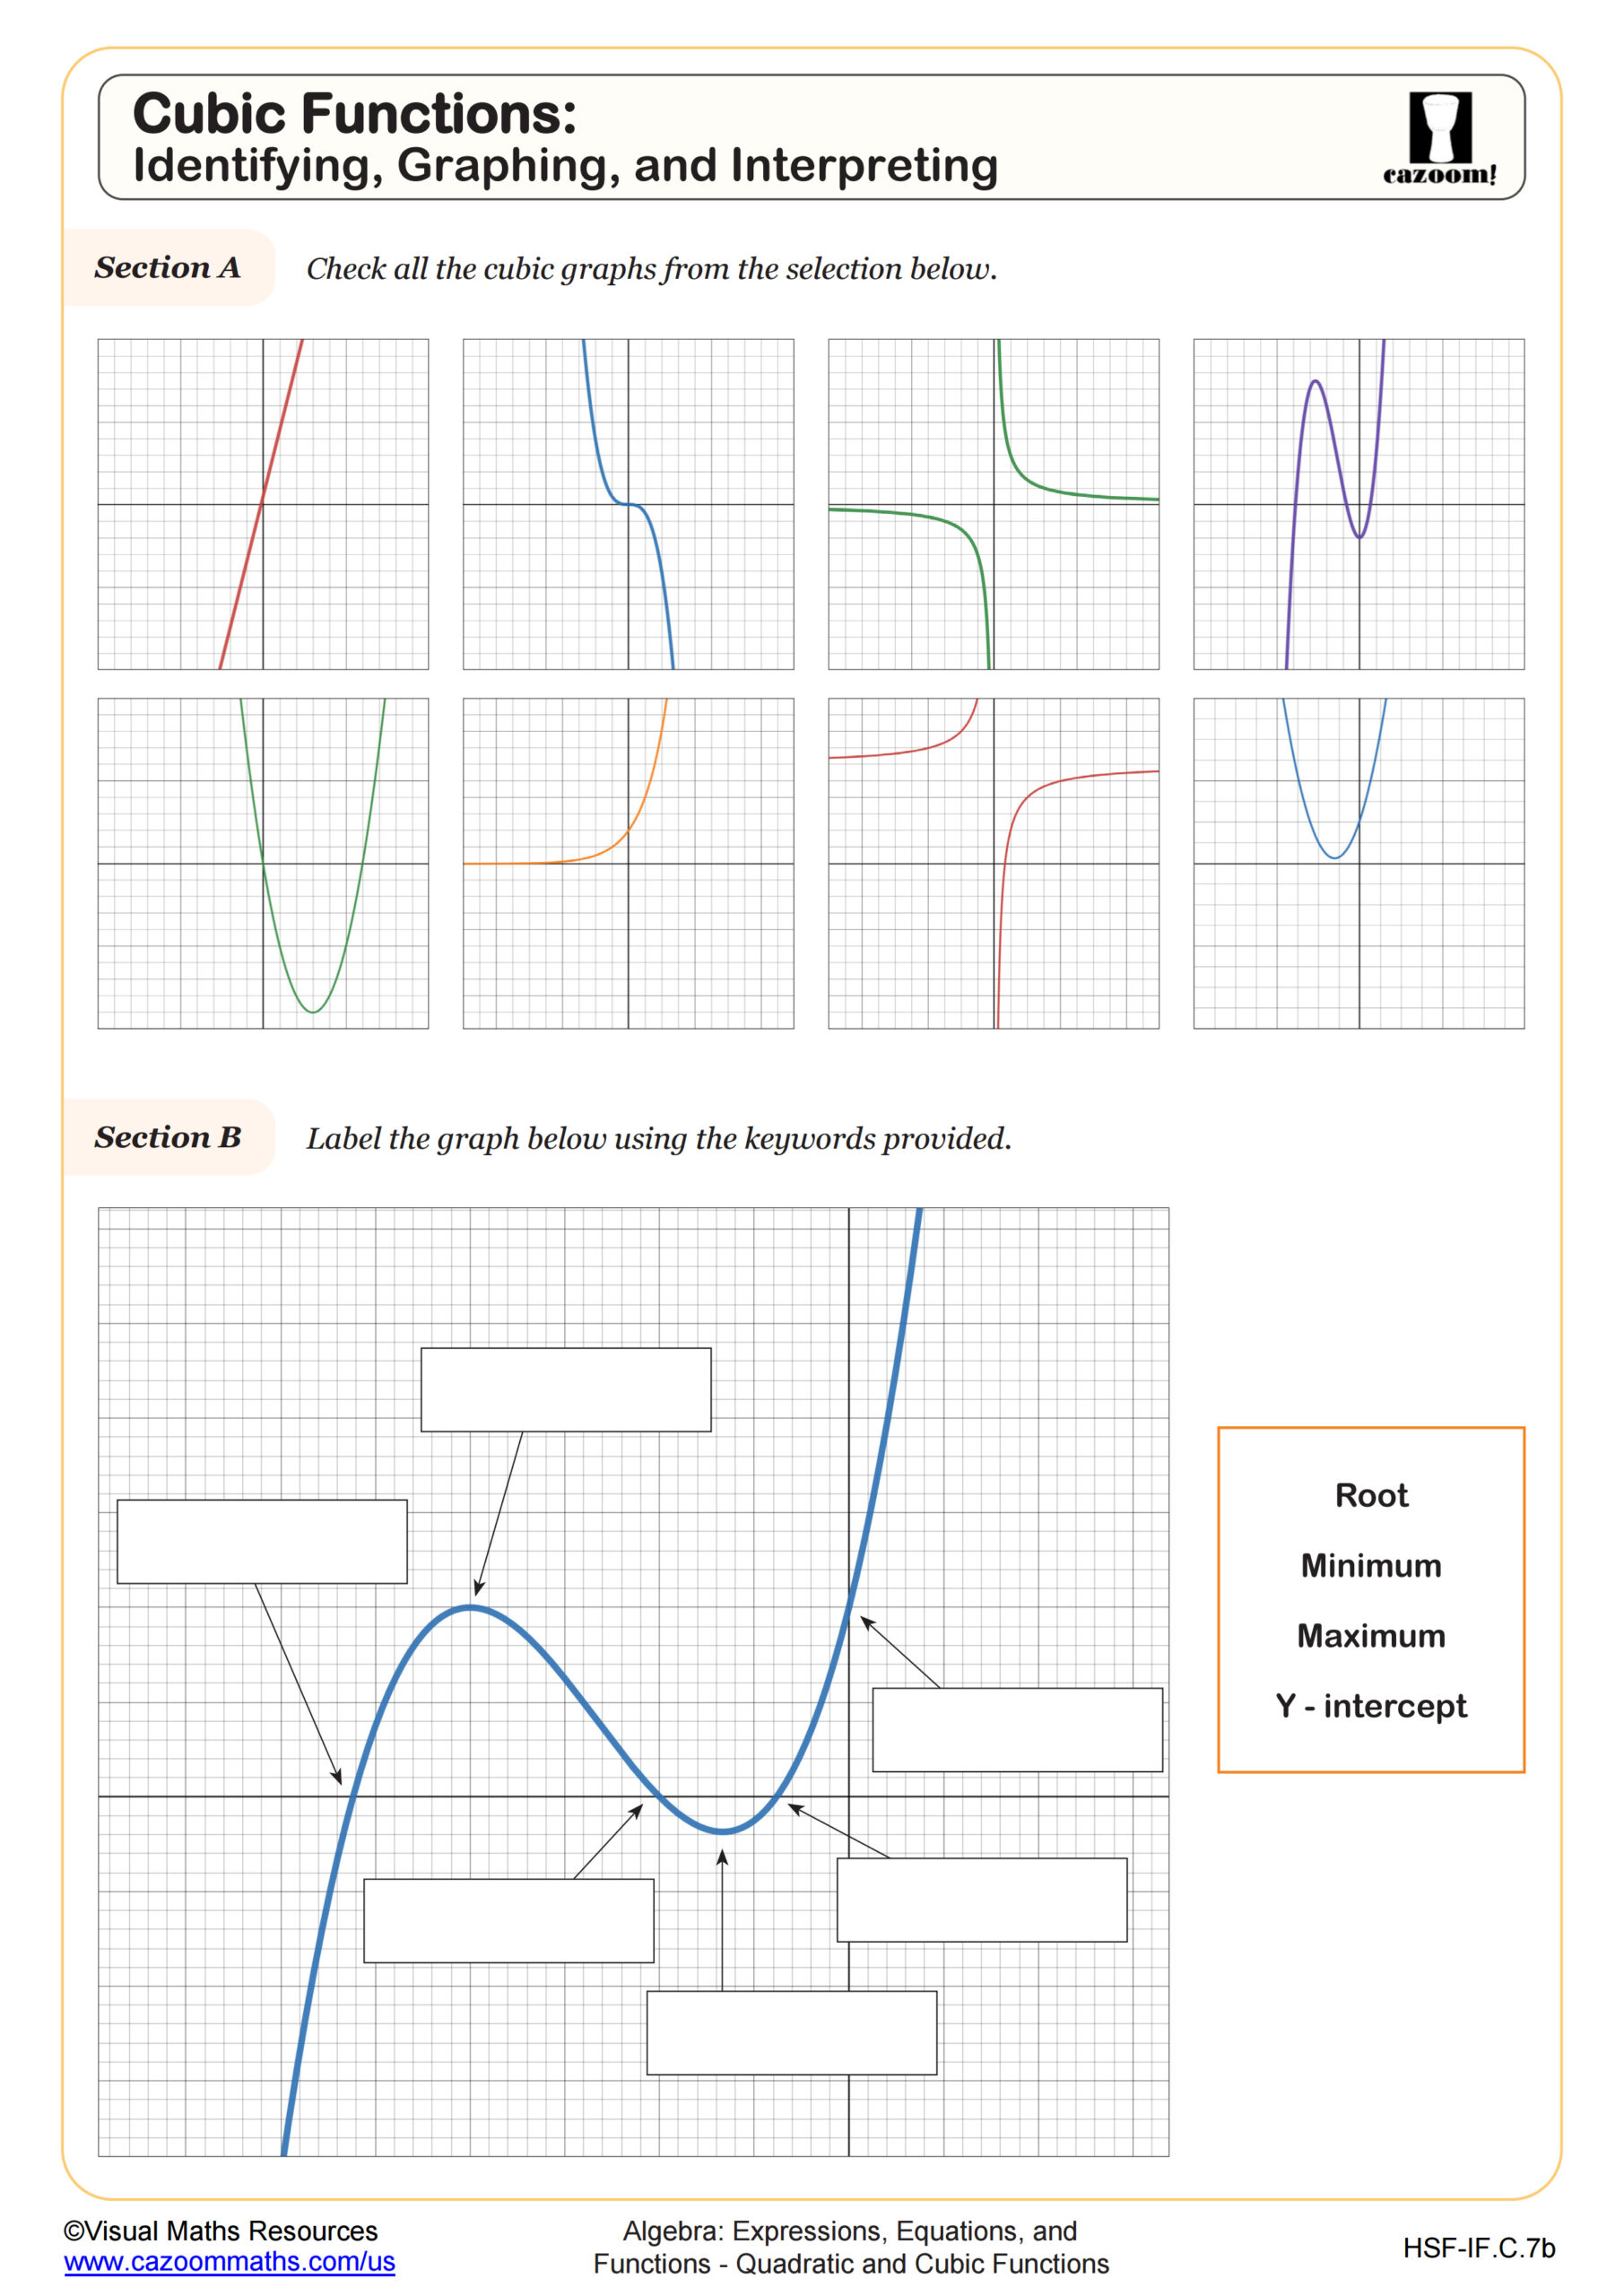
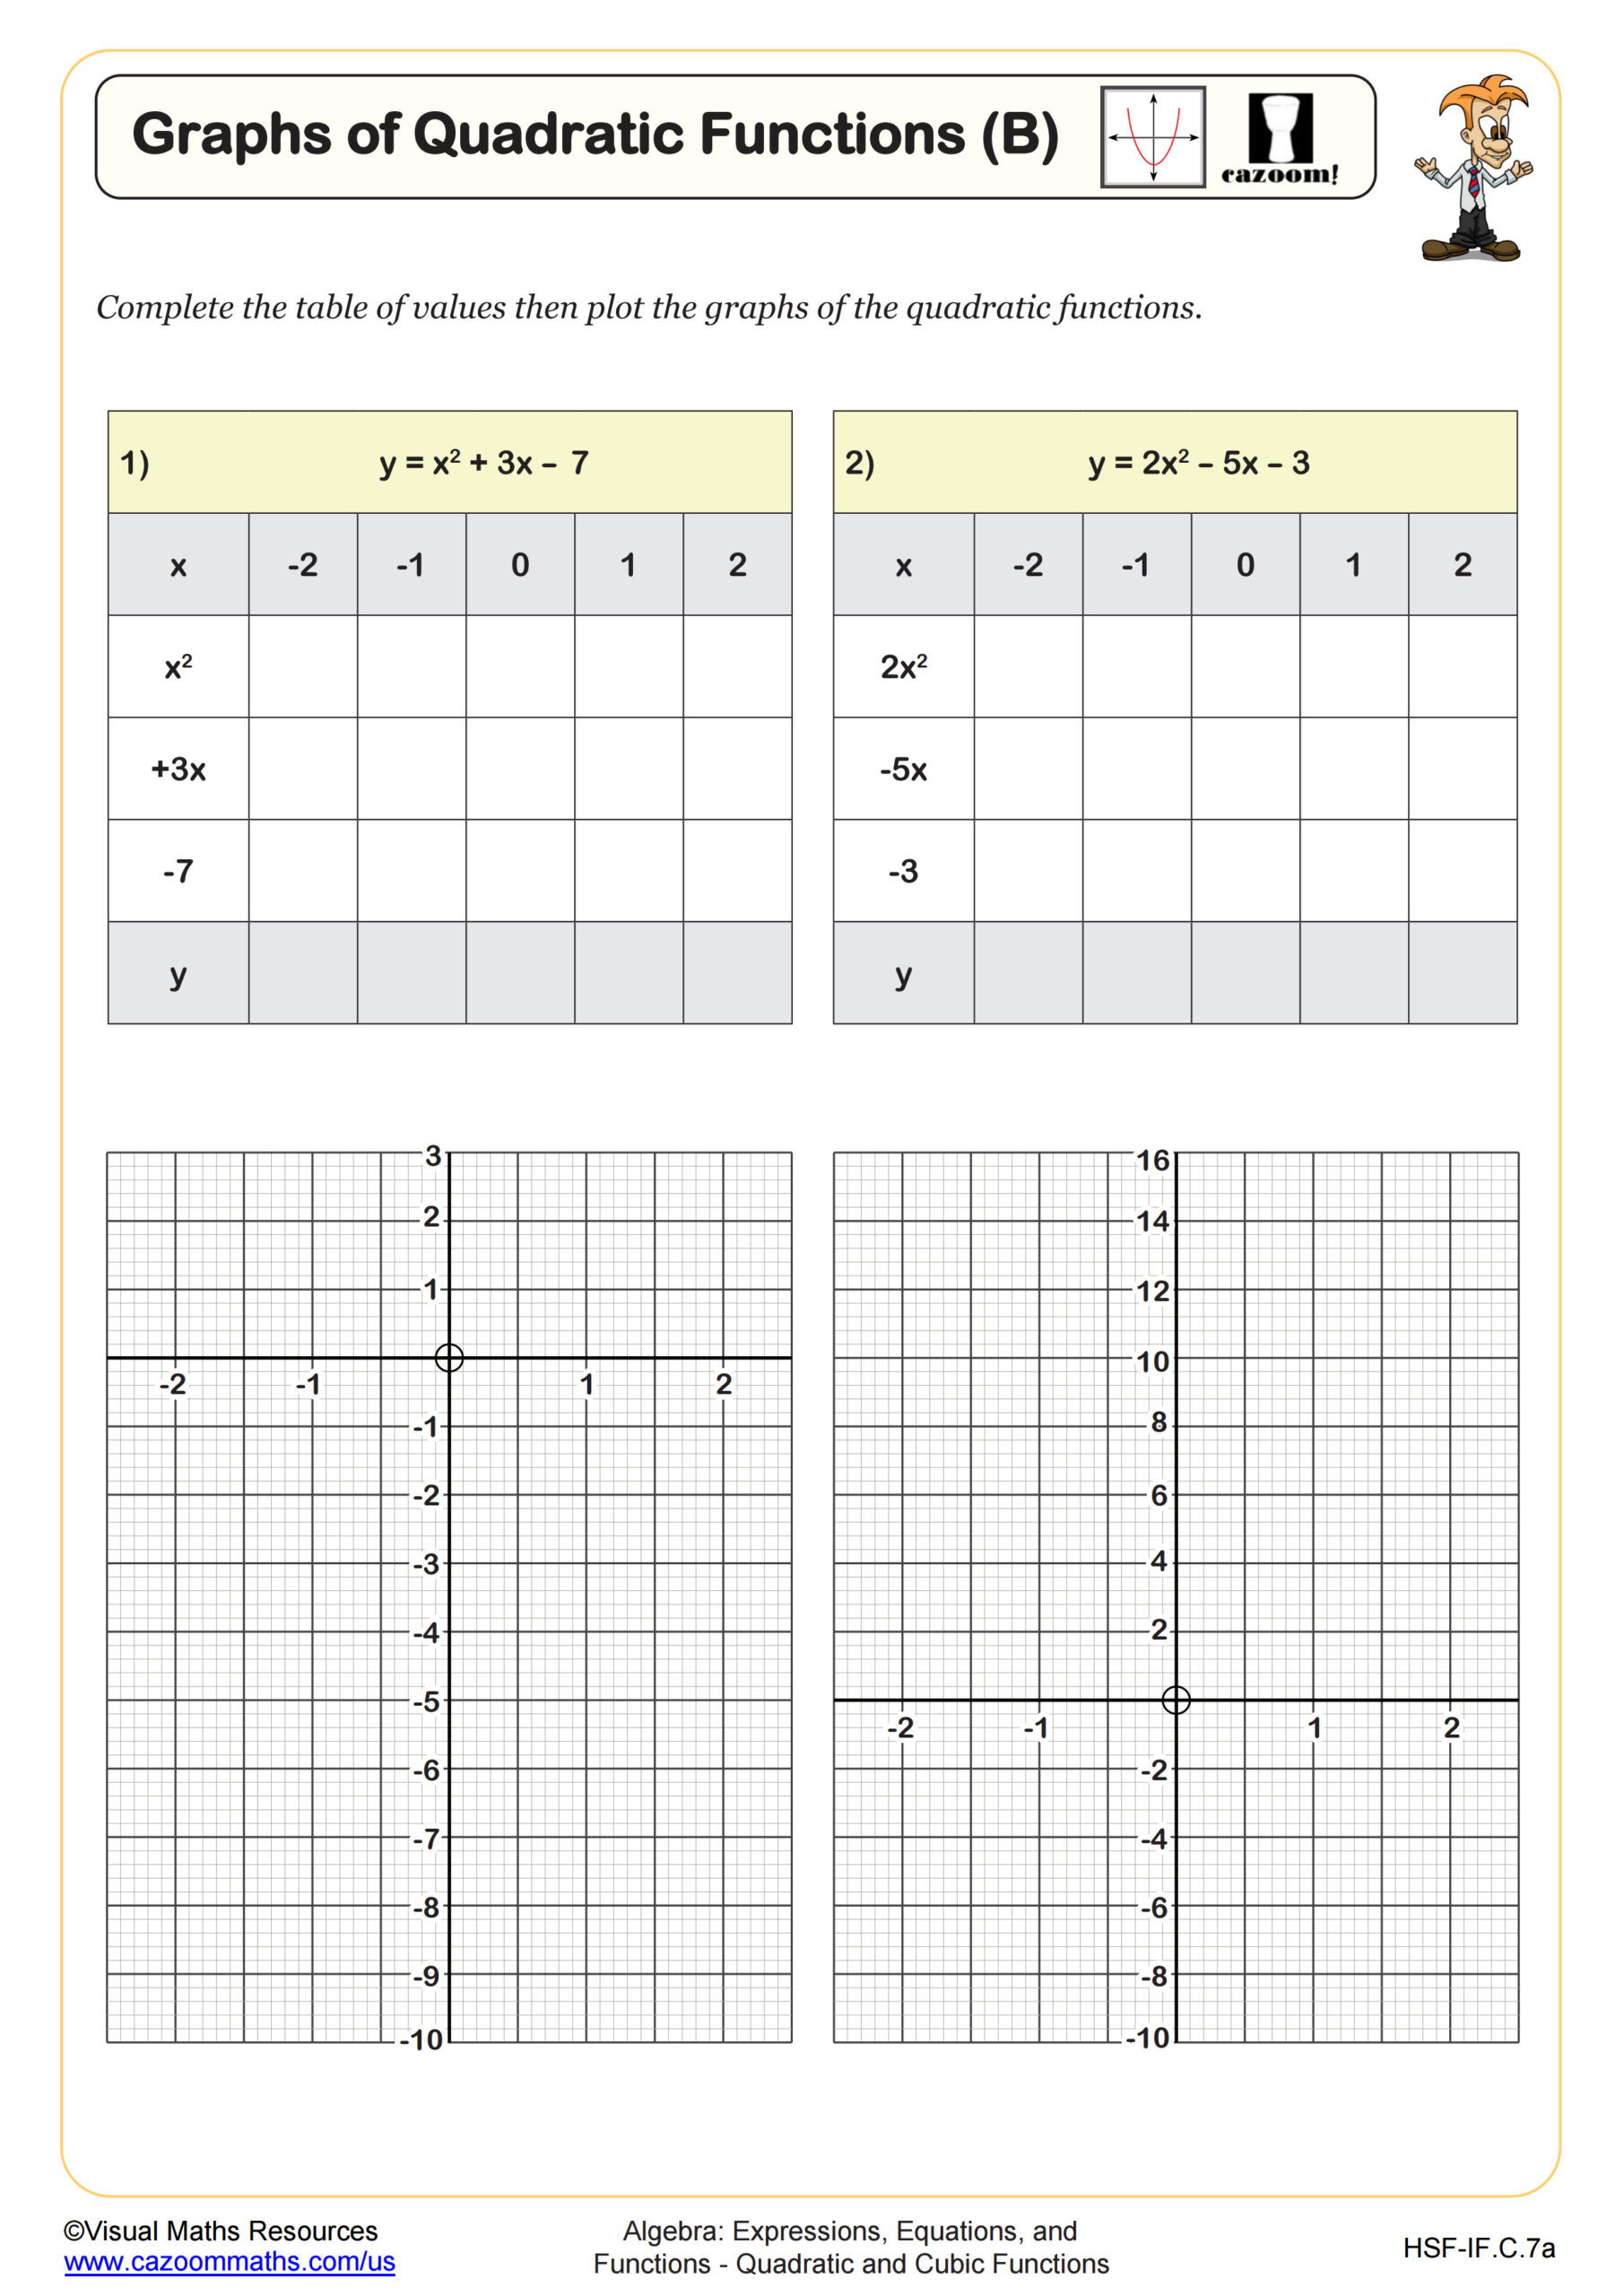
Graphing Cubic Functions WORKSHEET DESCRIPTION
This assignment will see students using tables of values to generate coordinate pairs in order to plot cubic functions on a variety of differently scaled axes. The functions that learners will be plotting increase in difficulty as the worksheet progresses from y = x^3 - 1 to y = x^3 + 2x^2 - 4, and there are six functions to plot in total. In each case, the x values range from -2 to 2, and the table of values is already constructed for students alongside a separate pair of axes.
We have included a section on use of a calculator, which will guide your students through getting the most from their scientific calculators and using them to generate tables of values.
All worksheets are created by the team of experienced teachers at Cazoom Math.

RELATED TO Graphing Cubic Functions WORKSHEET
Frequently Asked Questions
This graphing cubic functions worksheet is designed for students in Algebra II and IM 3 and aligns with Common Core State Standards.