Graphing Inequalities (A) WORKSHEET
Graph the solutions to a linear inequality in two variables as a half-plane (excluding the boundary in the case of a strict inequality), and graph the solution set to a system of linear inequalities in two variables as the intersection of the corresponding half-planes.
Graphing Inequalities (A) WORKSHEET DESCRIPTION
Introduce learners to graphing inequalities with this worksheet that will guide them through the basics.
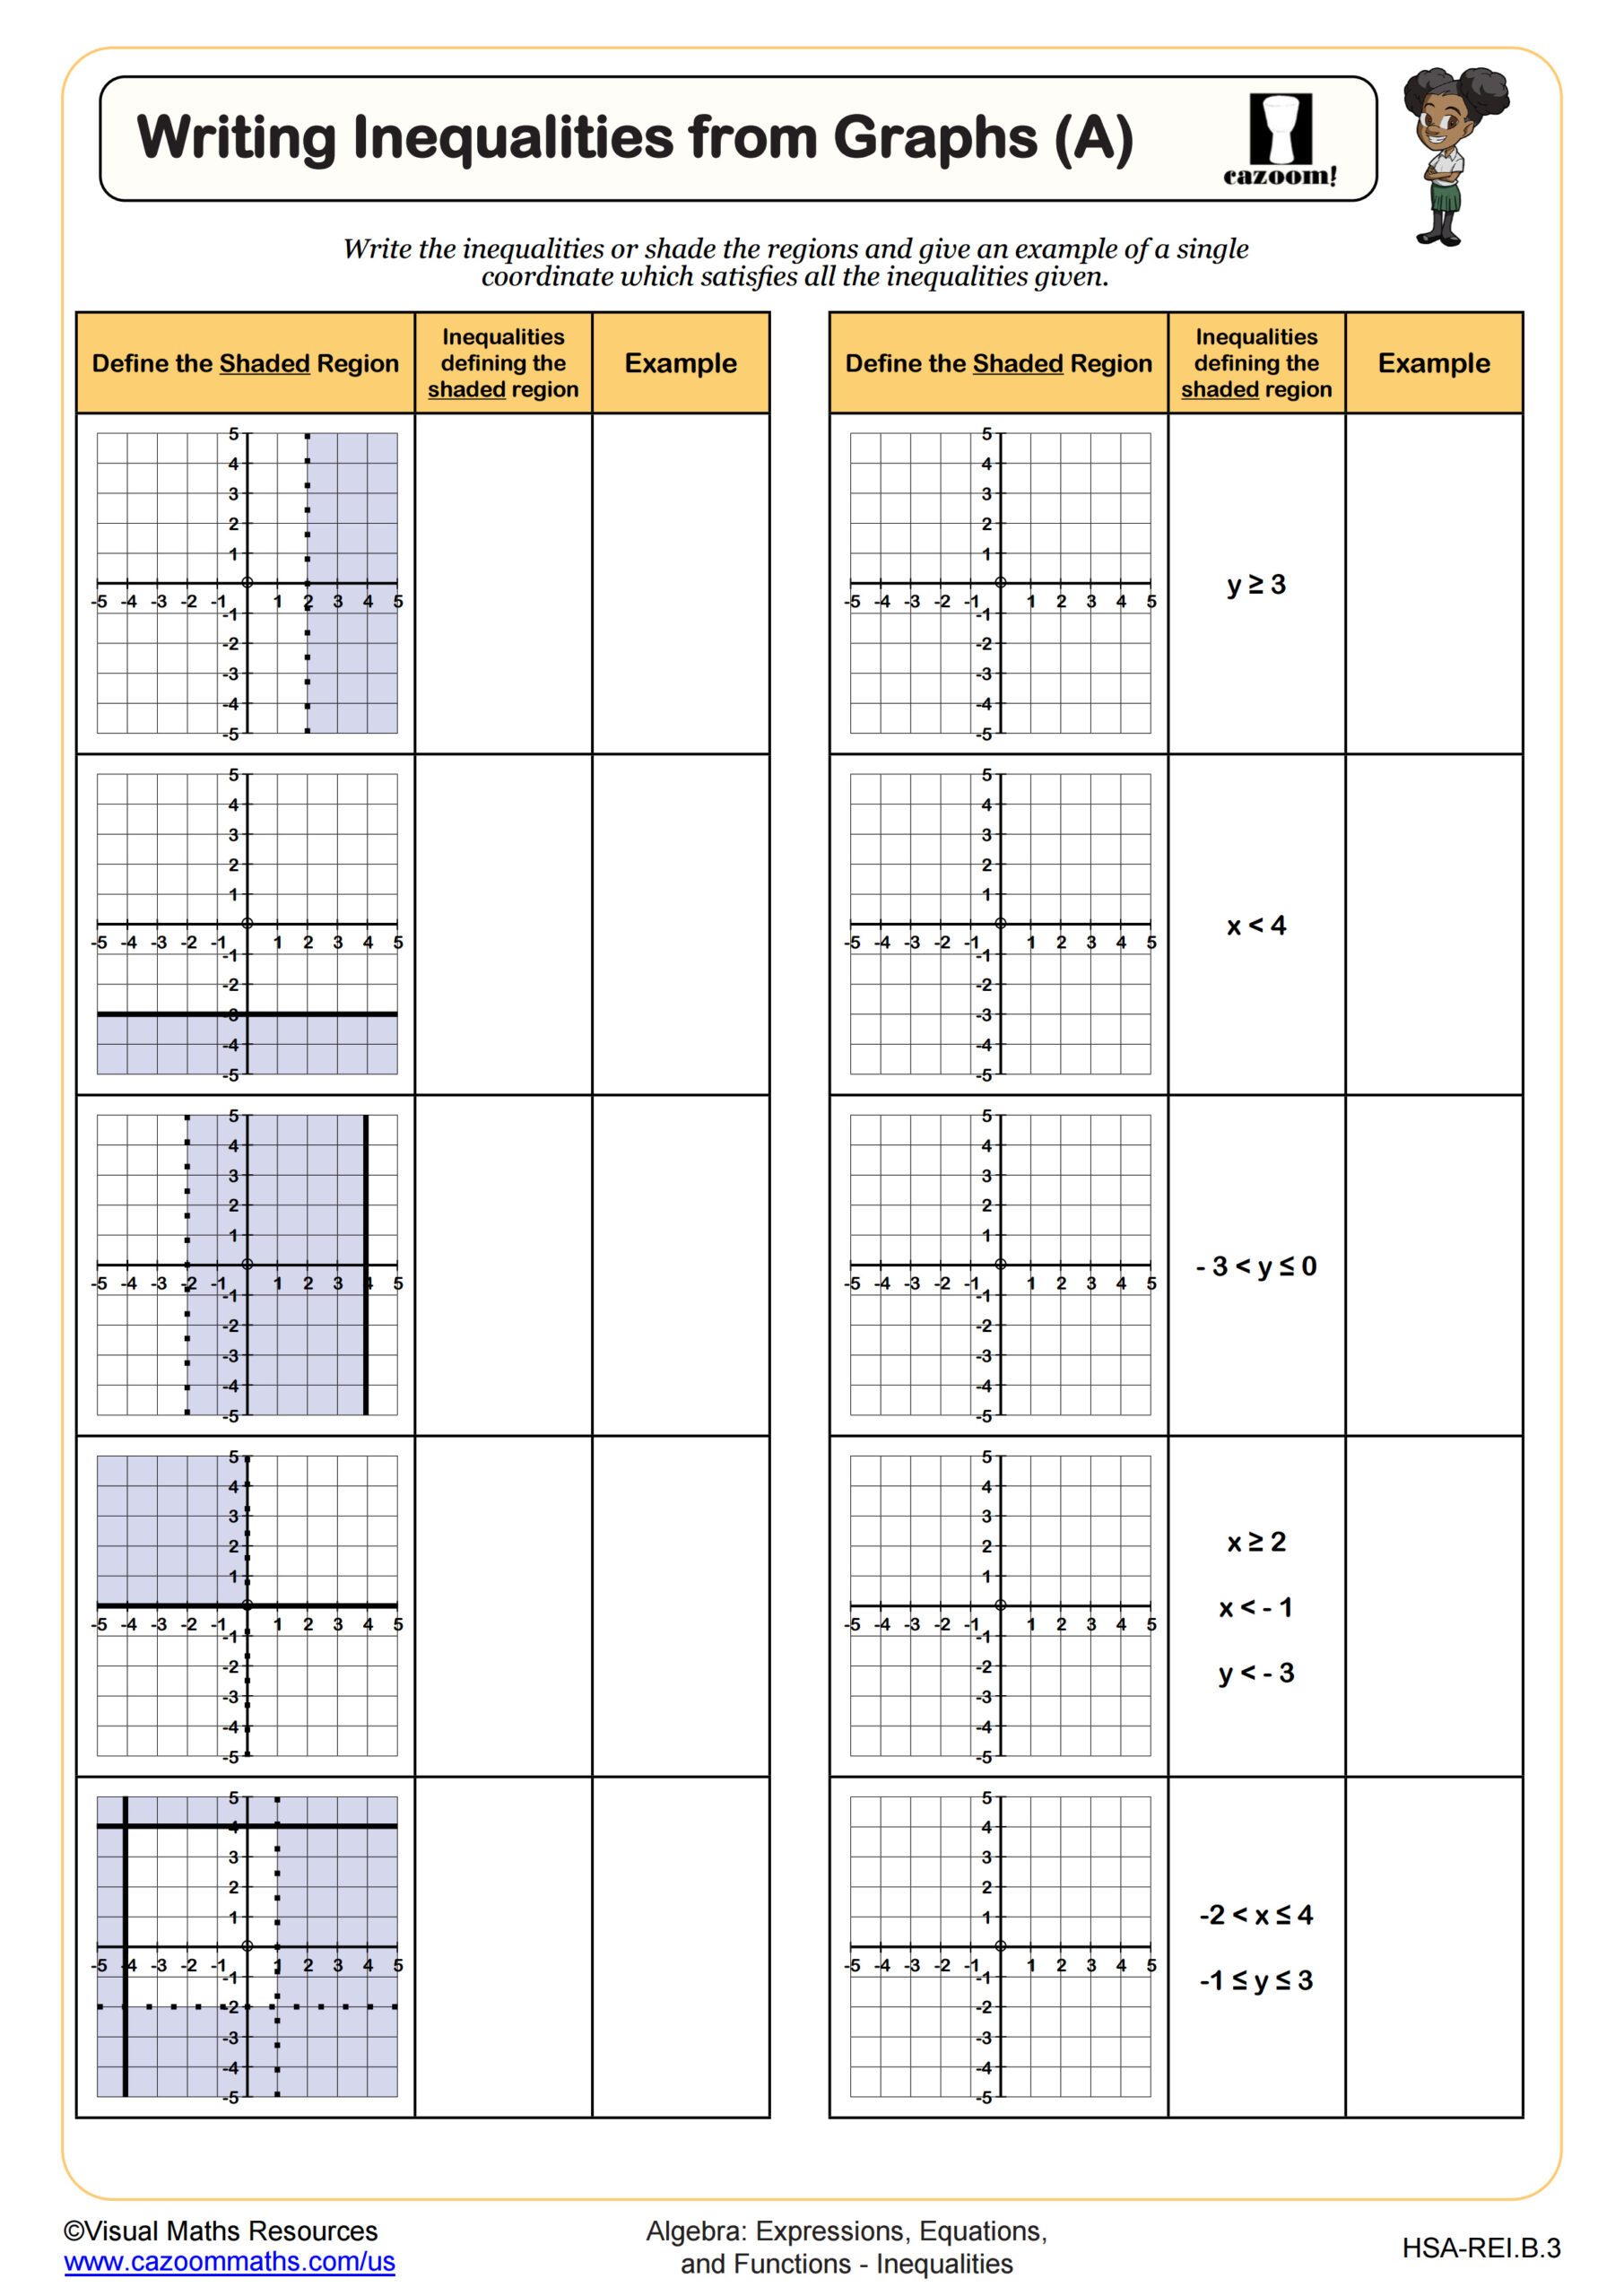
In Section A, students are presented with a range of inequalities and tasked with matching each to the corresponding graph that represents the solution region. The constants in the inequalities are either 9 or -9, allowing students to explore and compare how inequalities involving x, y, or both variables behave. This comparison also helps them distinguish between inequalities that include or exclude equality.
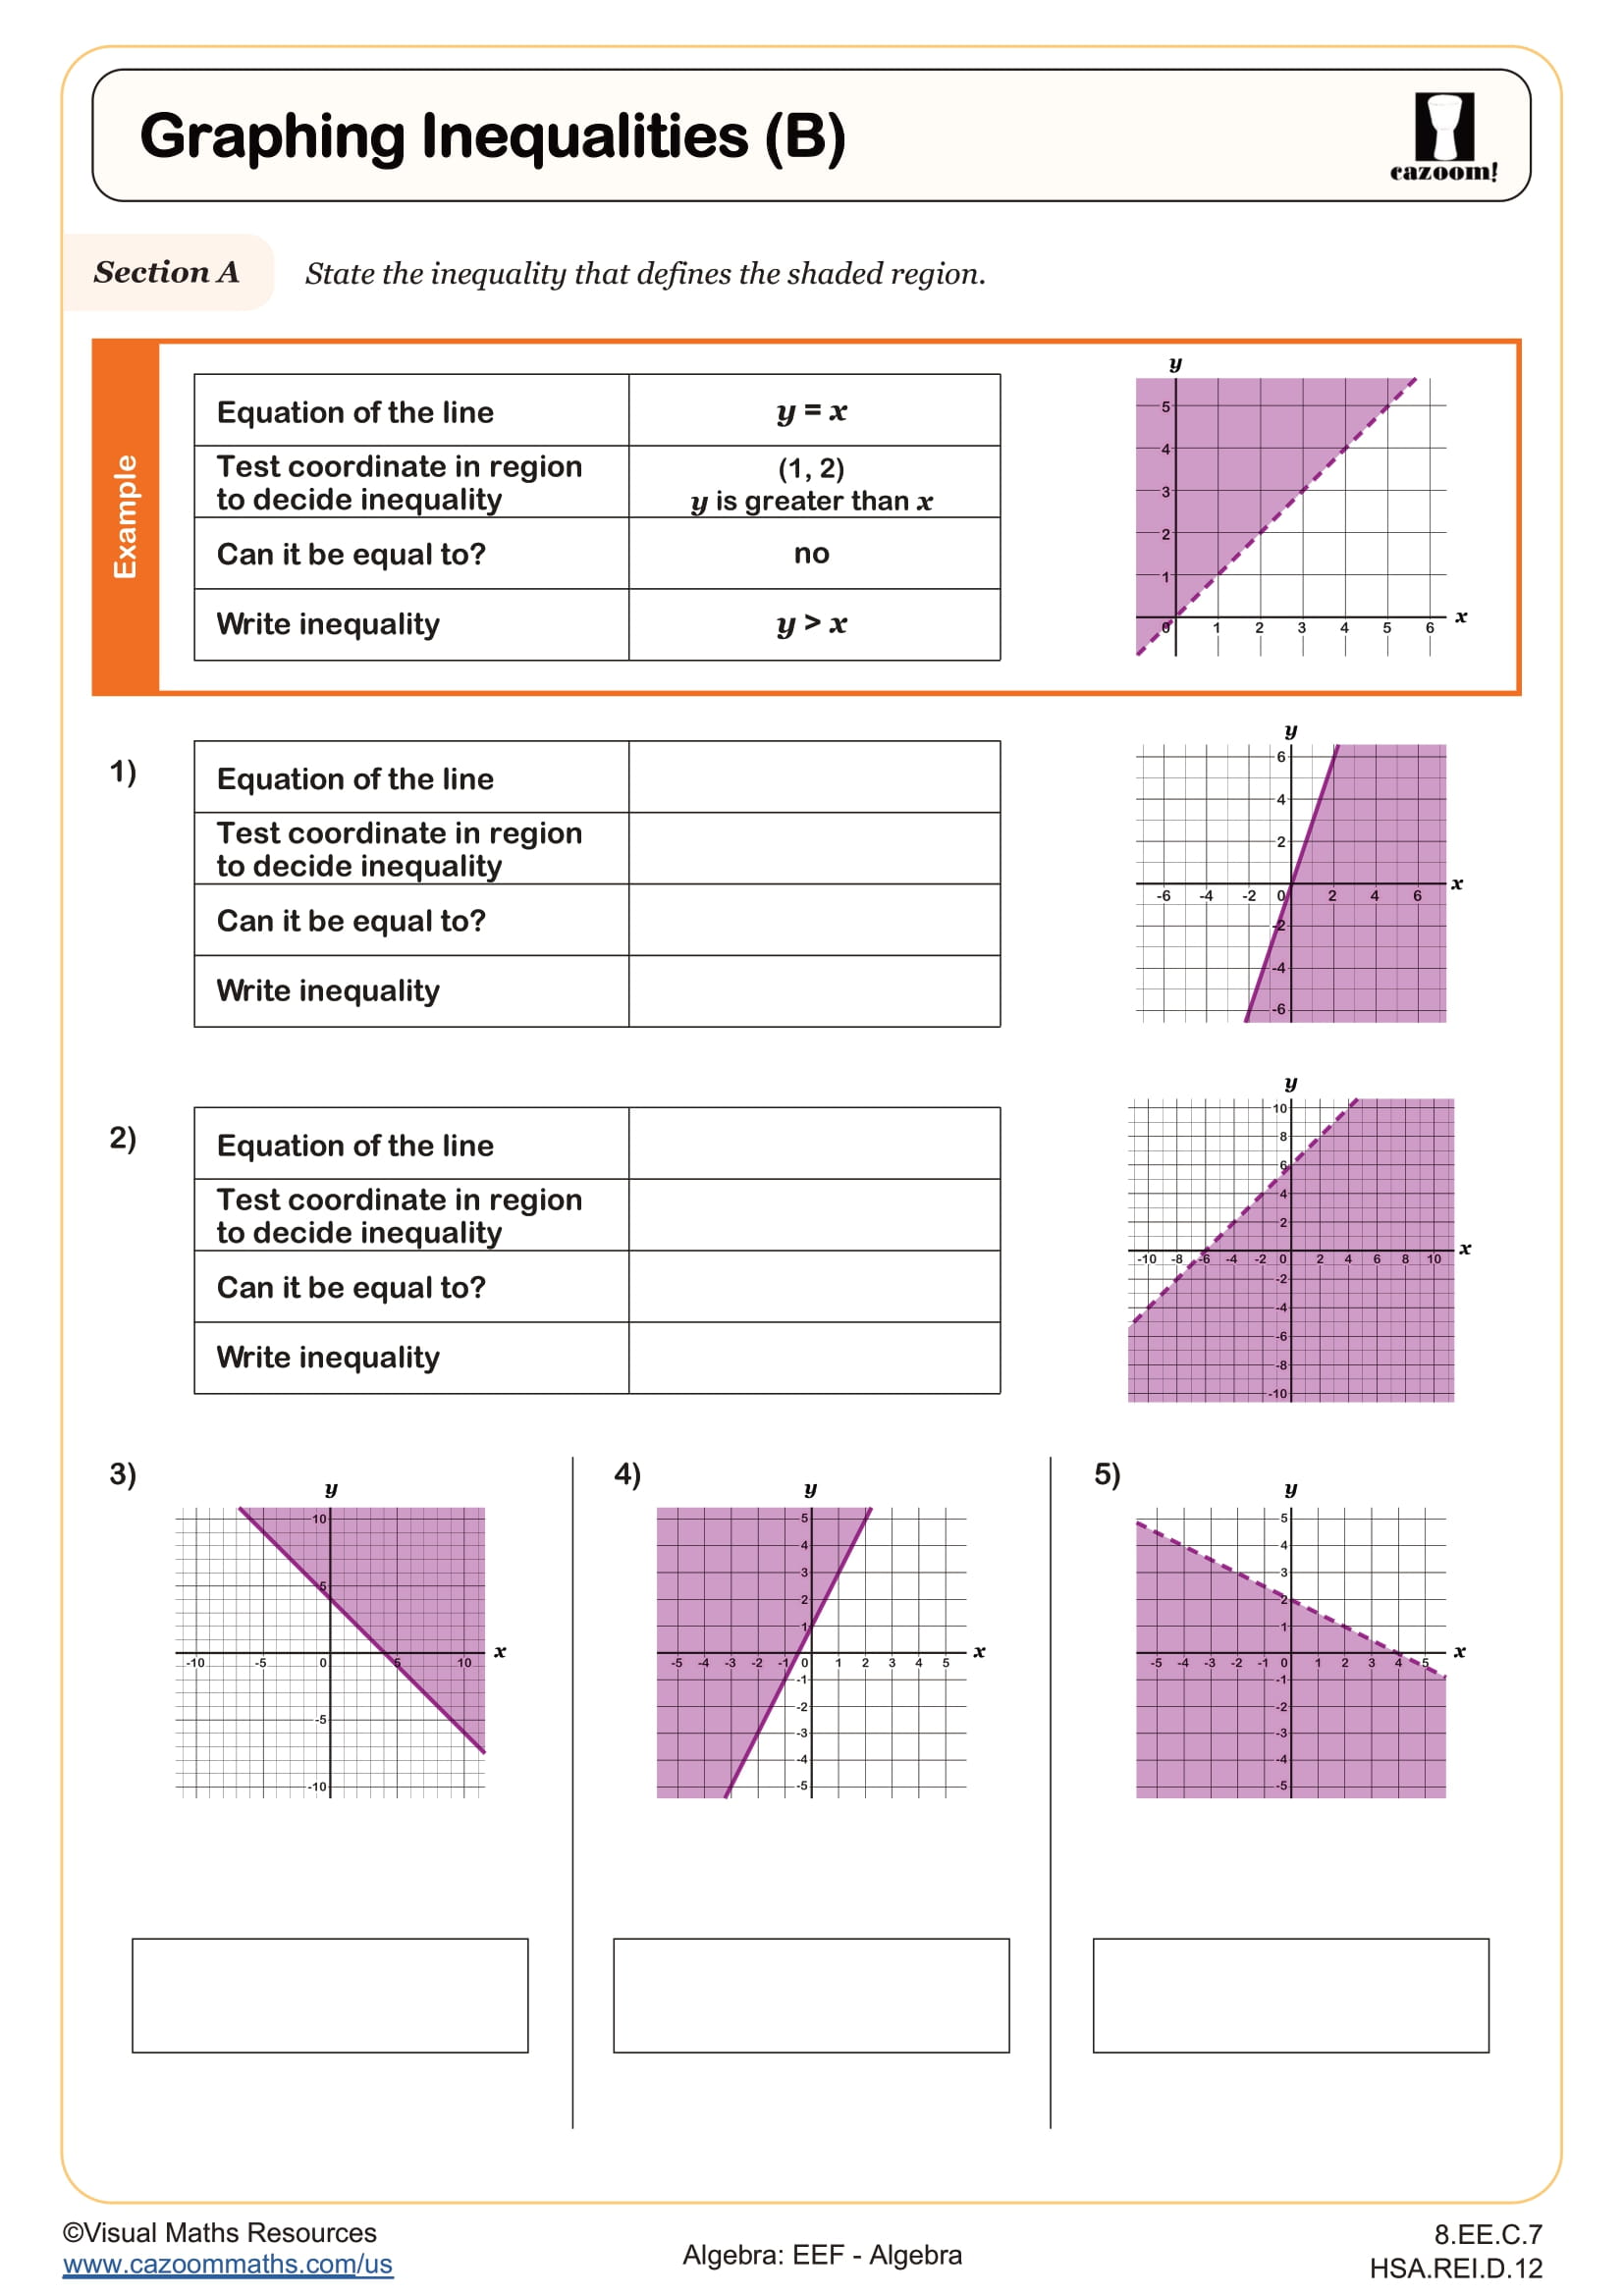
Next in Section B, learners are guided towards stating the inequality represented by different shaded regions. As they consider the equation of the graph, whether the region is above or below this line and whether it has equality or not.
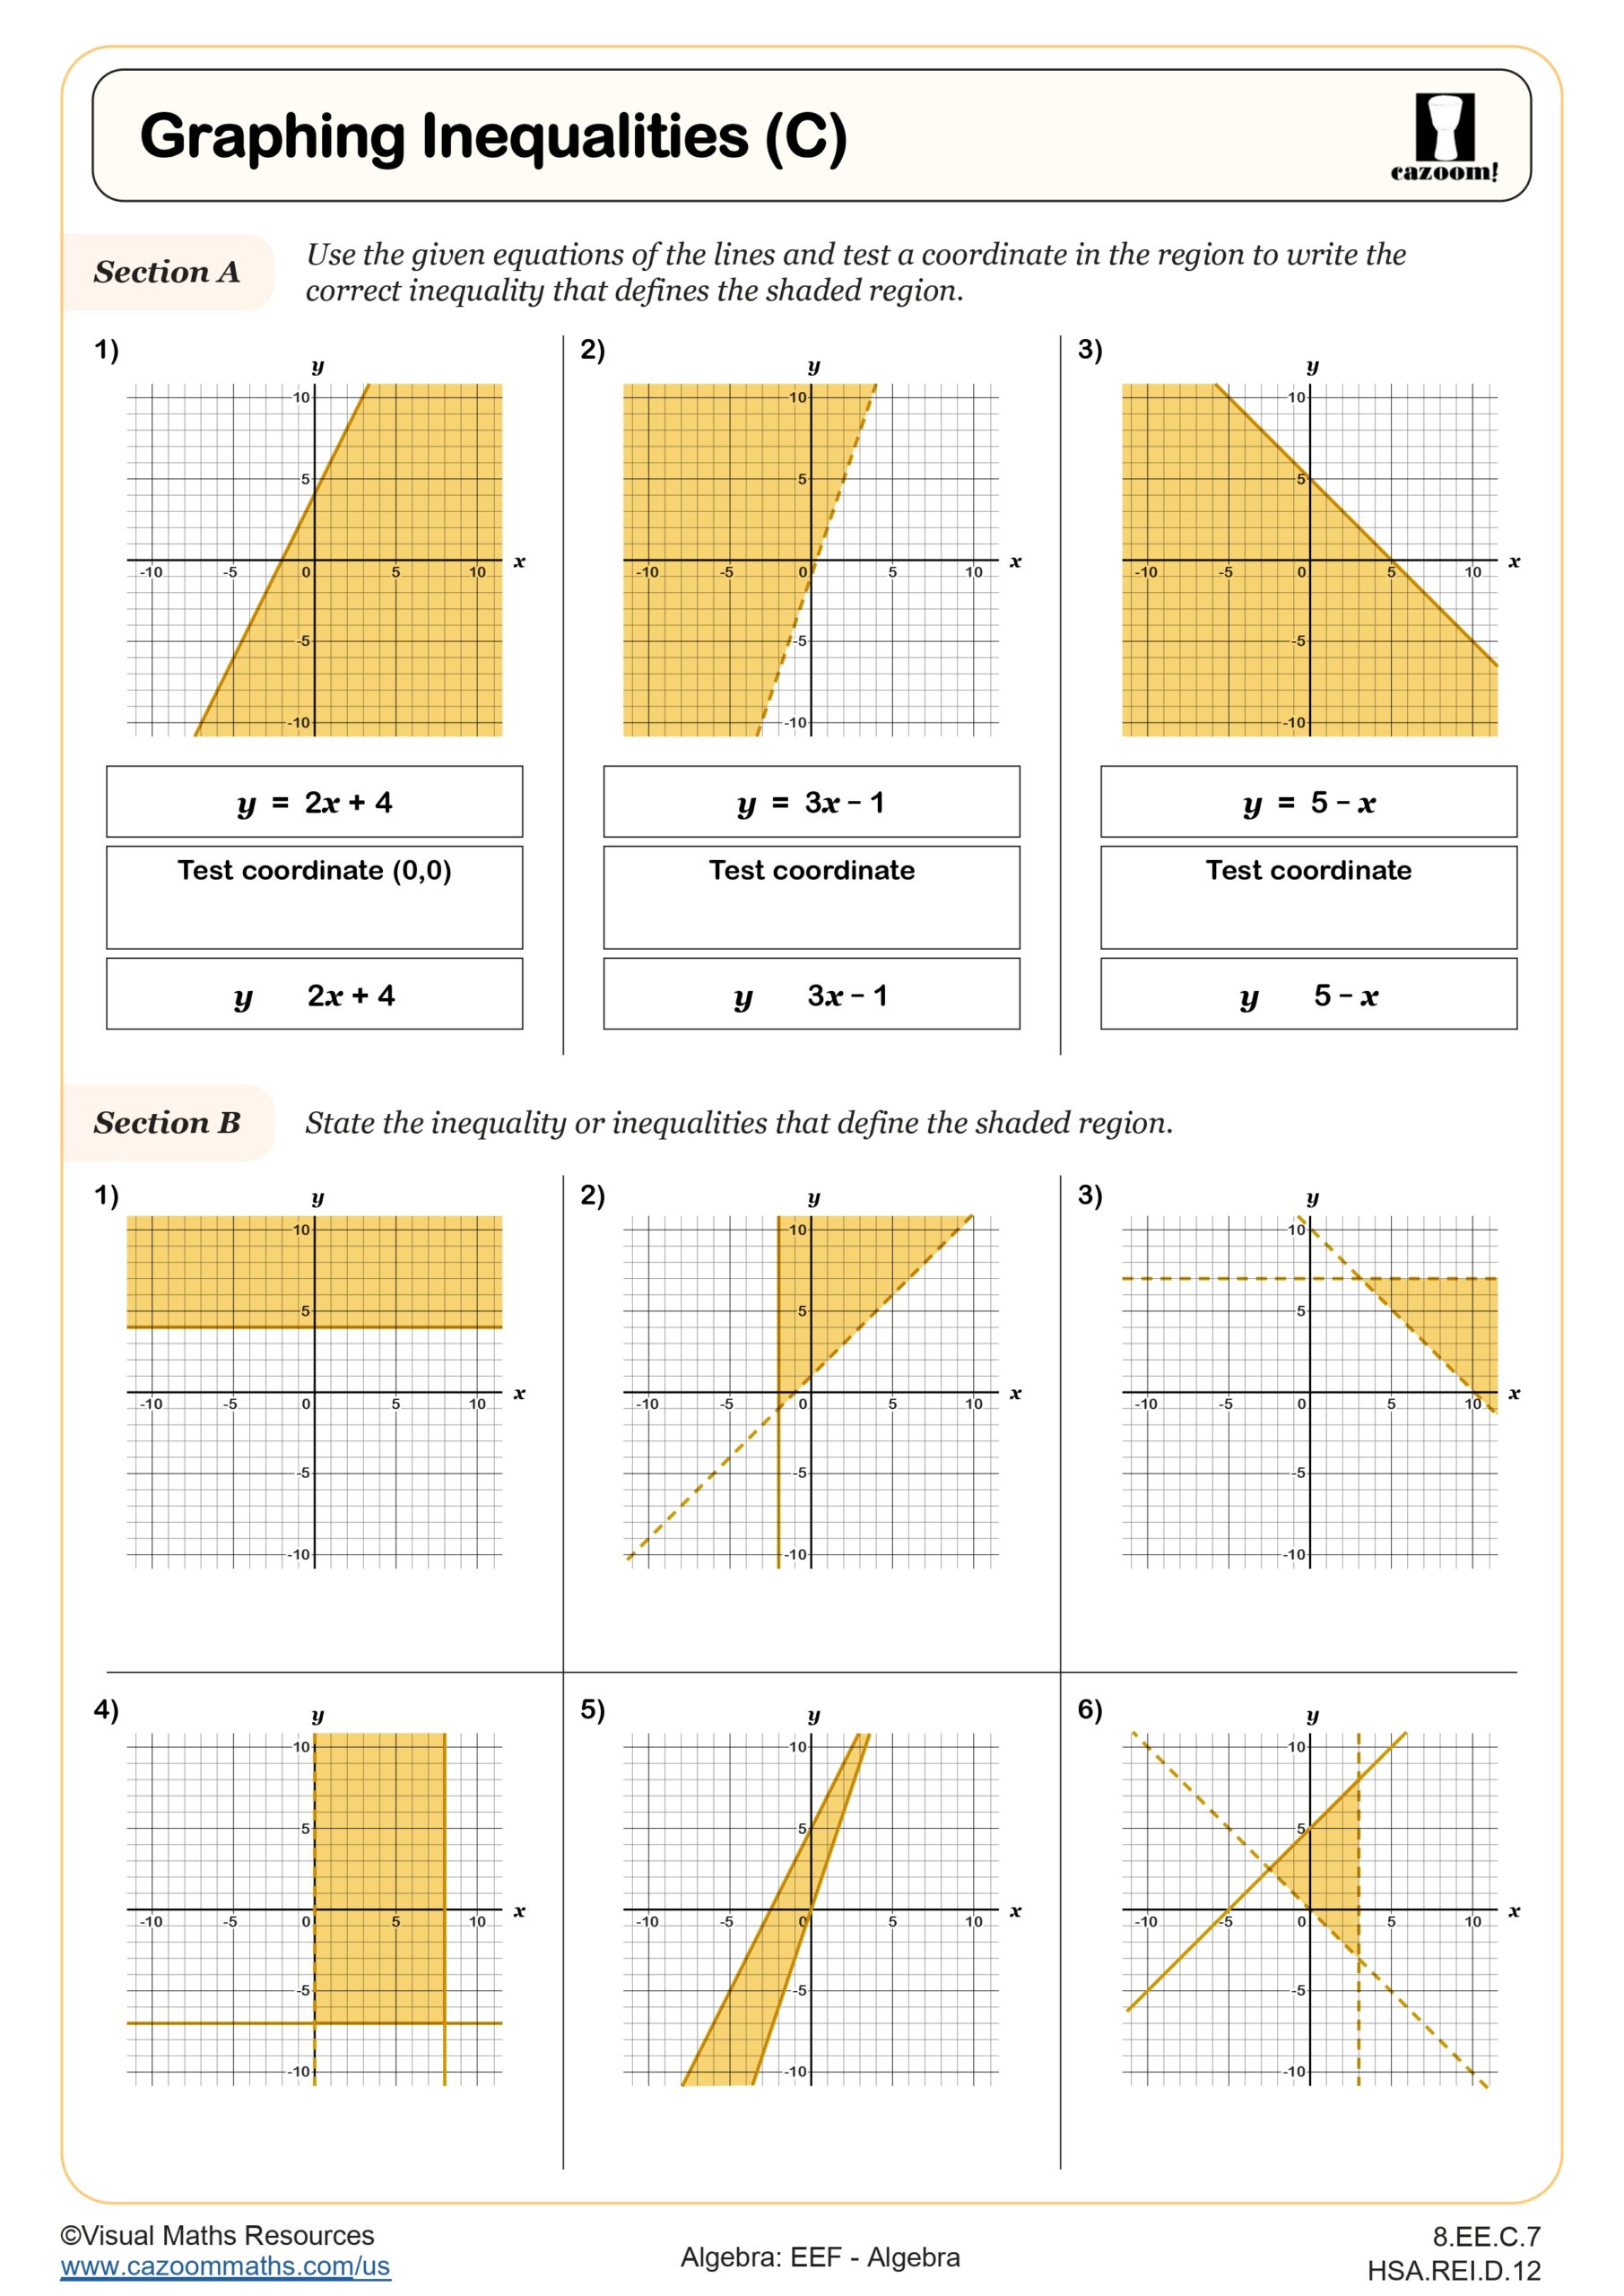
Then in Section C, students will represent six different inequalities on separate sets of axes.
All worksheets are created by the team of experienced teachers at Cazoom Math.

RELATED TO Graphing Inequalities (A) WORKSHEET
Frequently Asked Questions
This graphing inequalities (a) worksheet is designed for students in 8th Grade, Algebra I, and IM 1 and aligns with Common Core State Standards.