Graphing Inequalities (C) WORKSHEET
Graph the solutions to a linear inequality in two variables as a half-plane (excluding the boundary in the case of a strict inequality), and graph the solution set to a system of linear inequalities in two variables as the intersection of the corresponding half-planes.
Graphing Inequalities (C) WORKSHEET DESCRIPTION
Students will define regions determined by up to three inequalities throughout this worksheet.
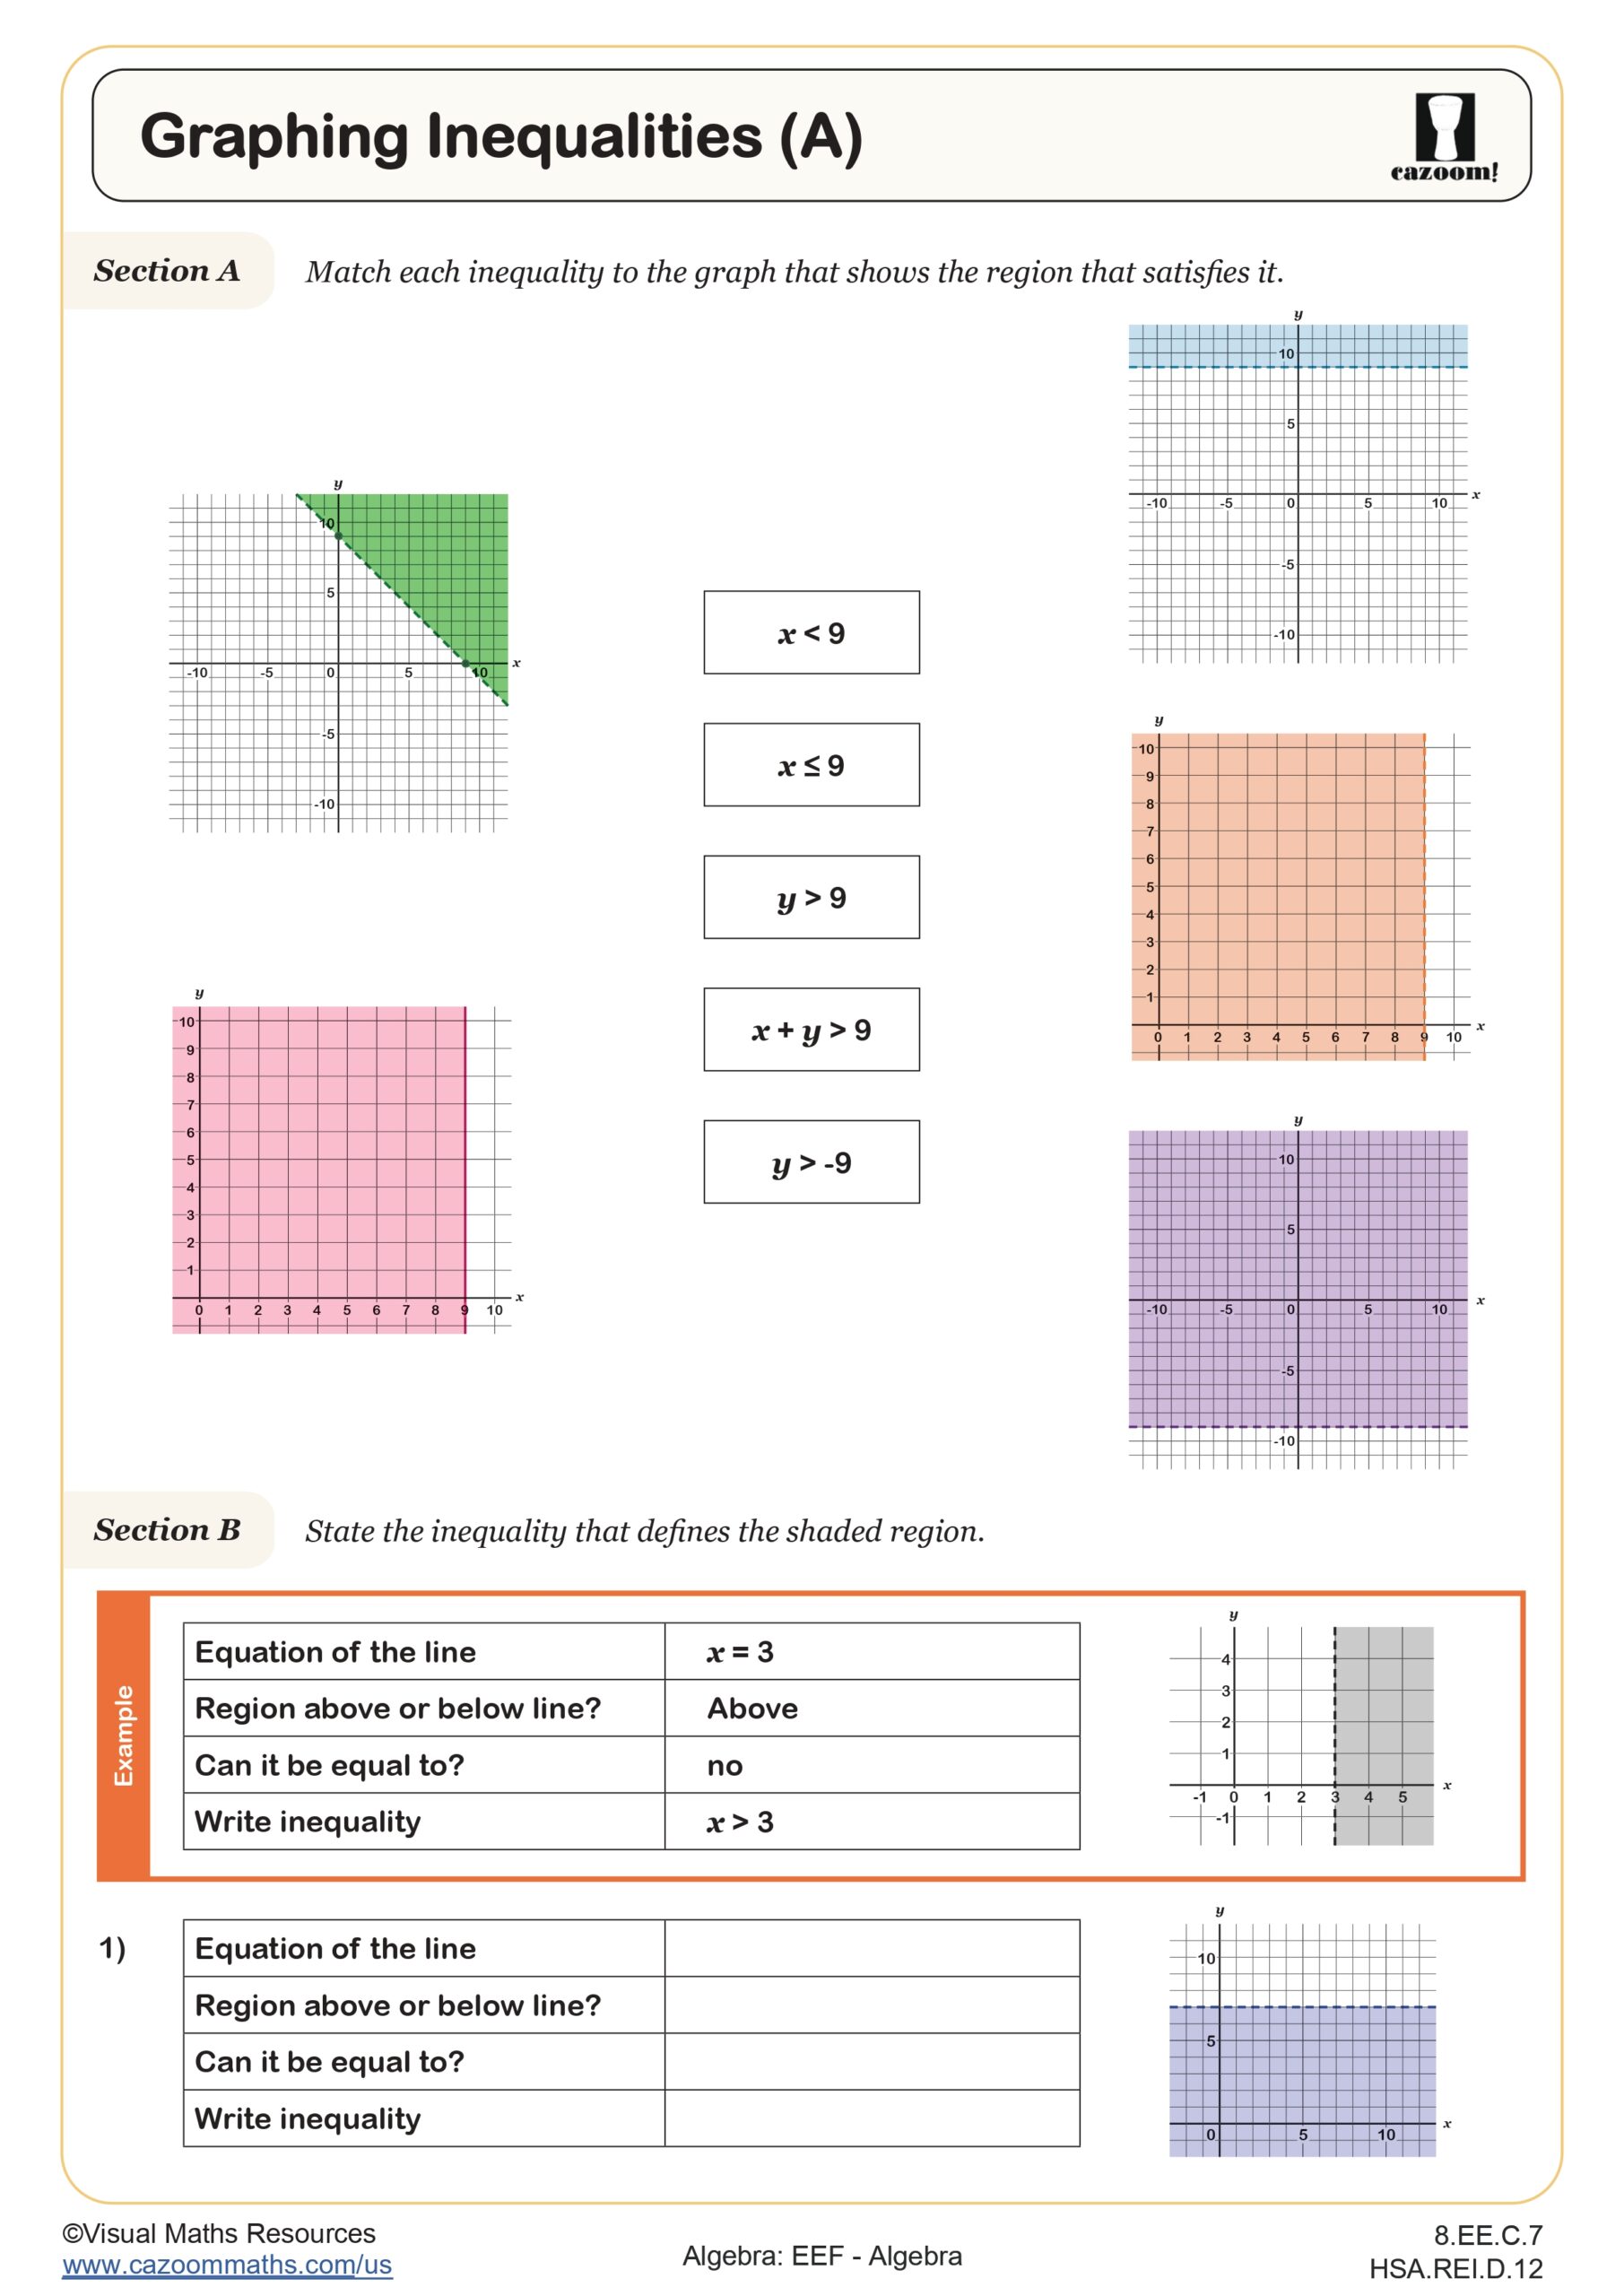
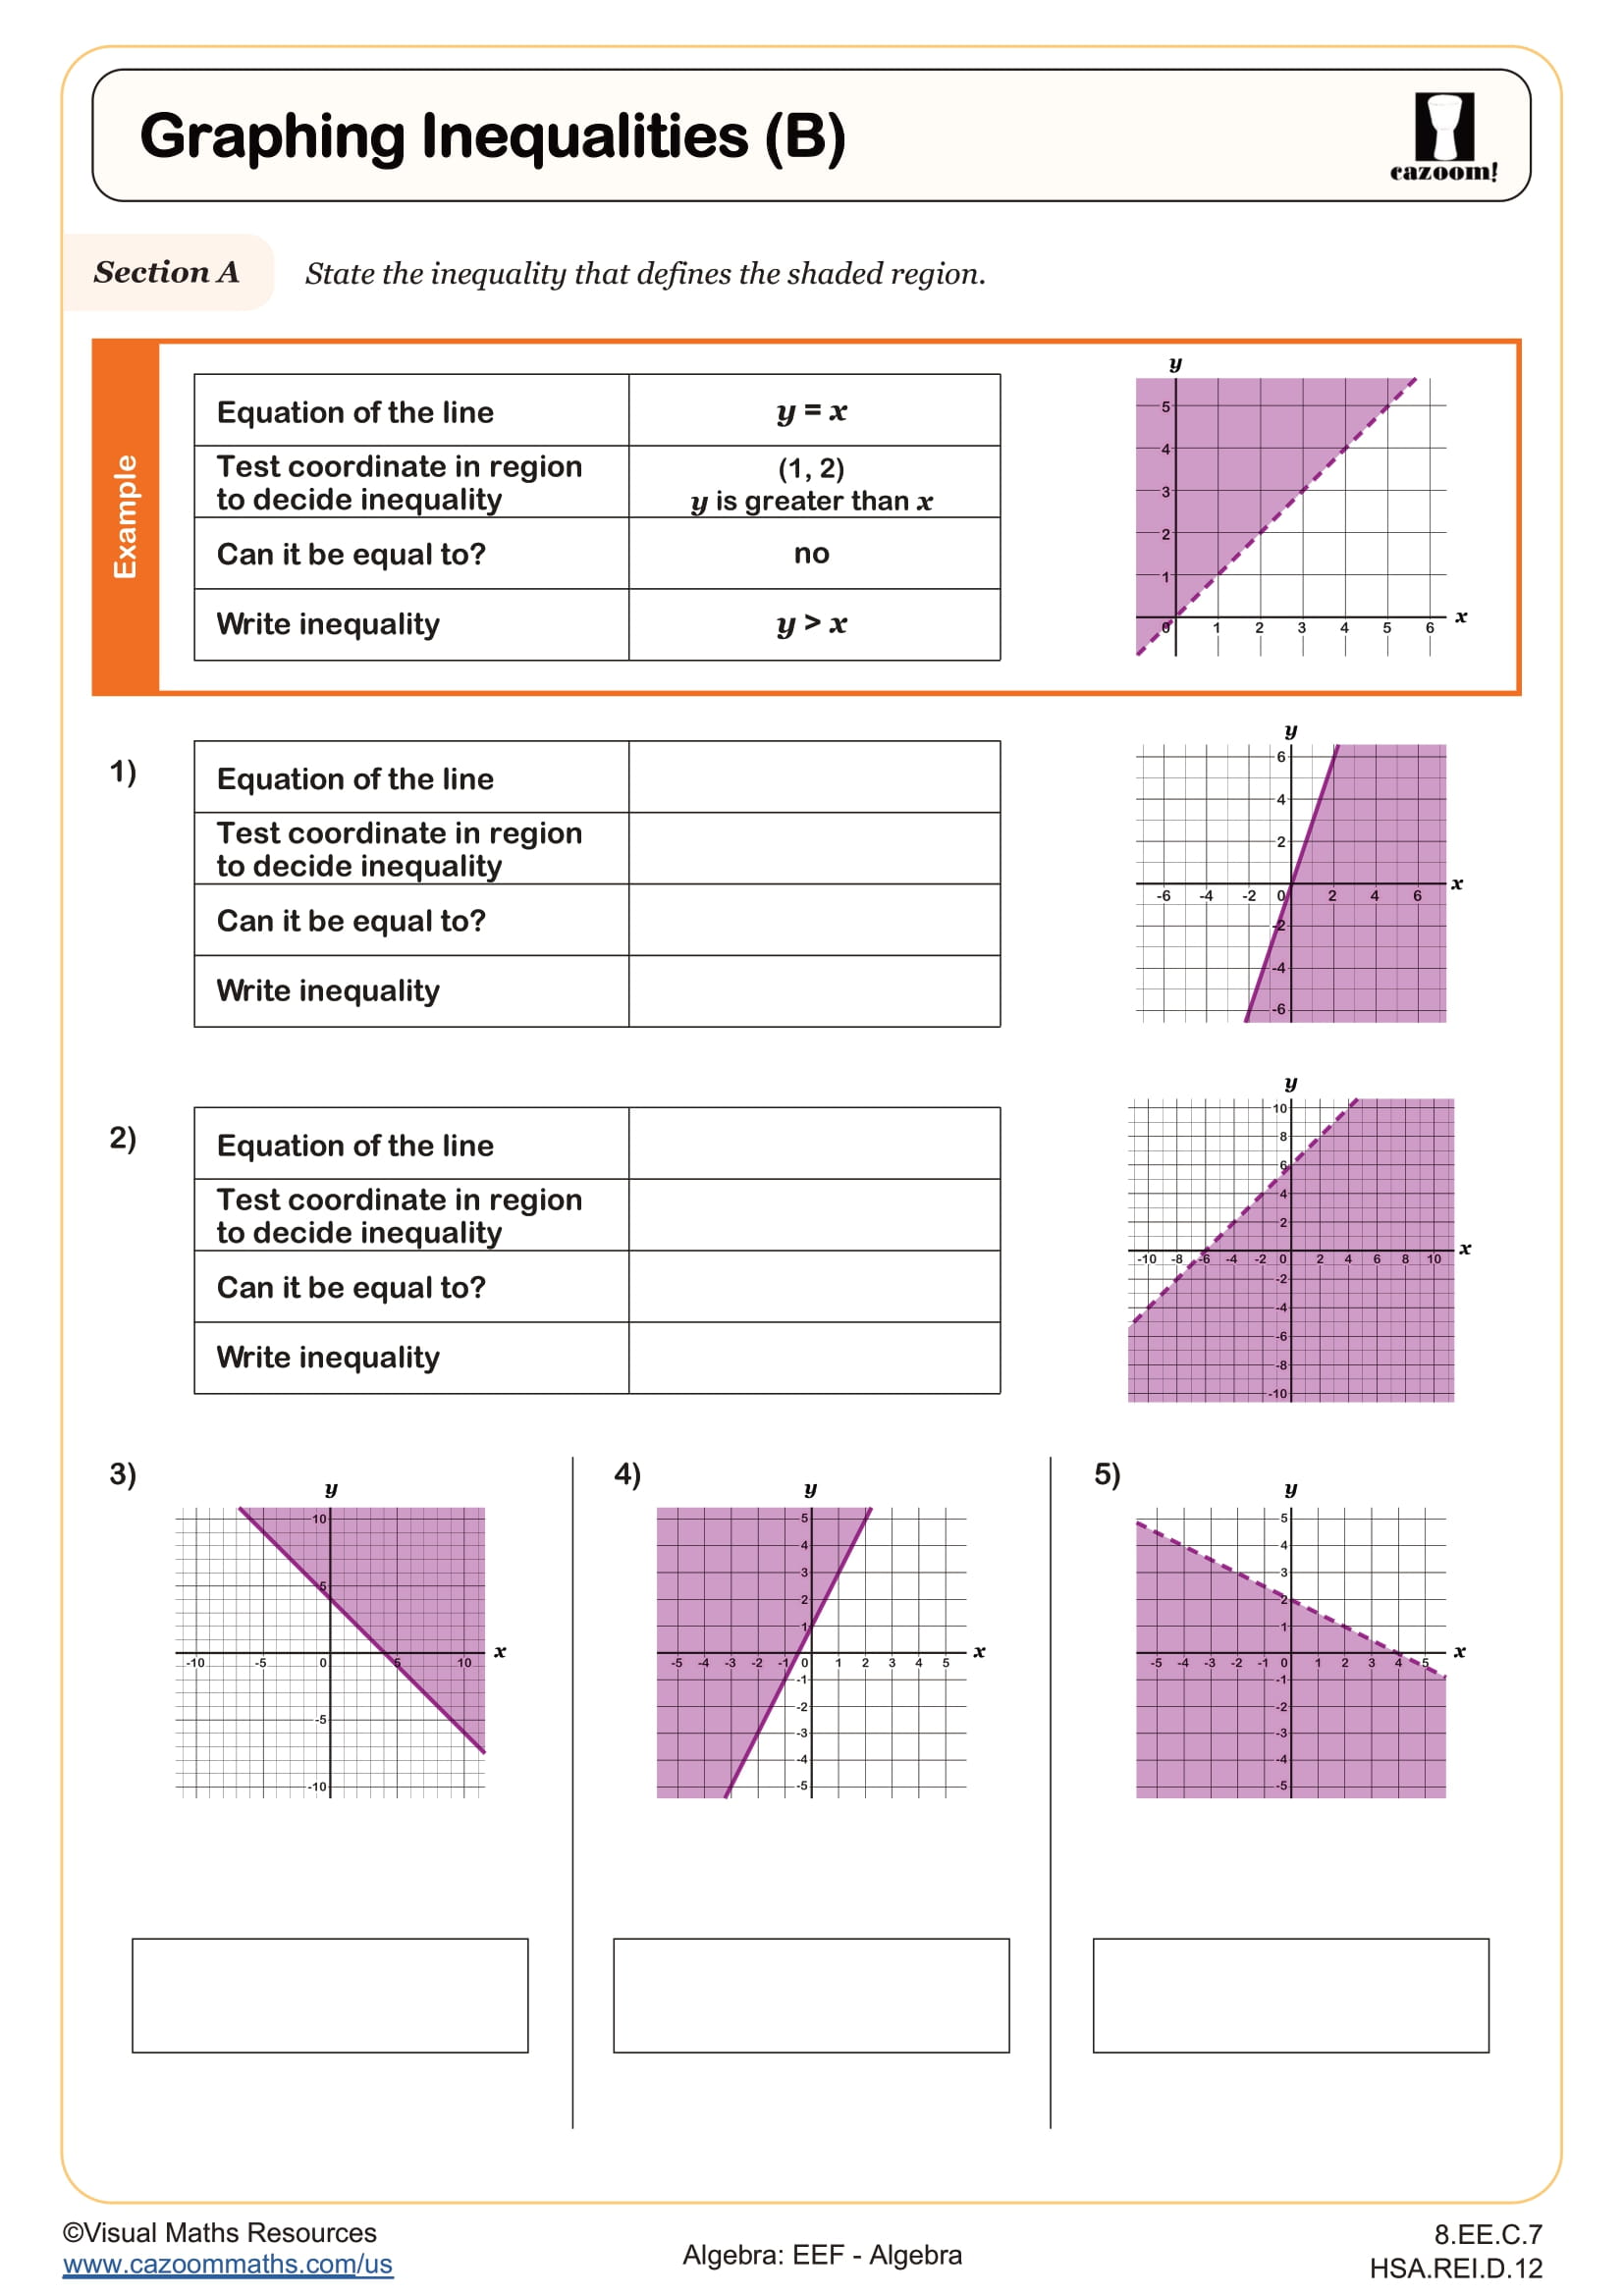
In Section A learners are reminded to use the equations of the straight lines that define the region and to use a test coordinate inside the region to determine the inequality.
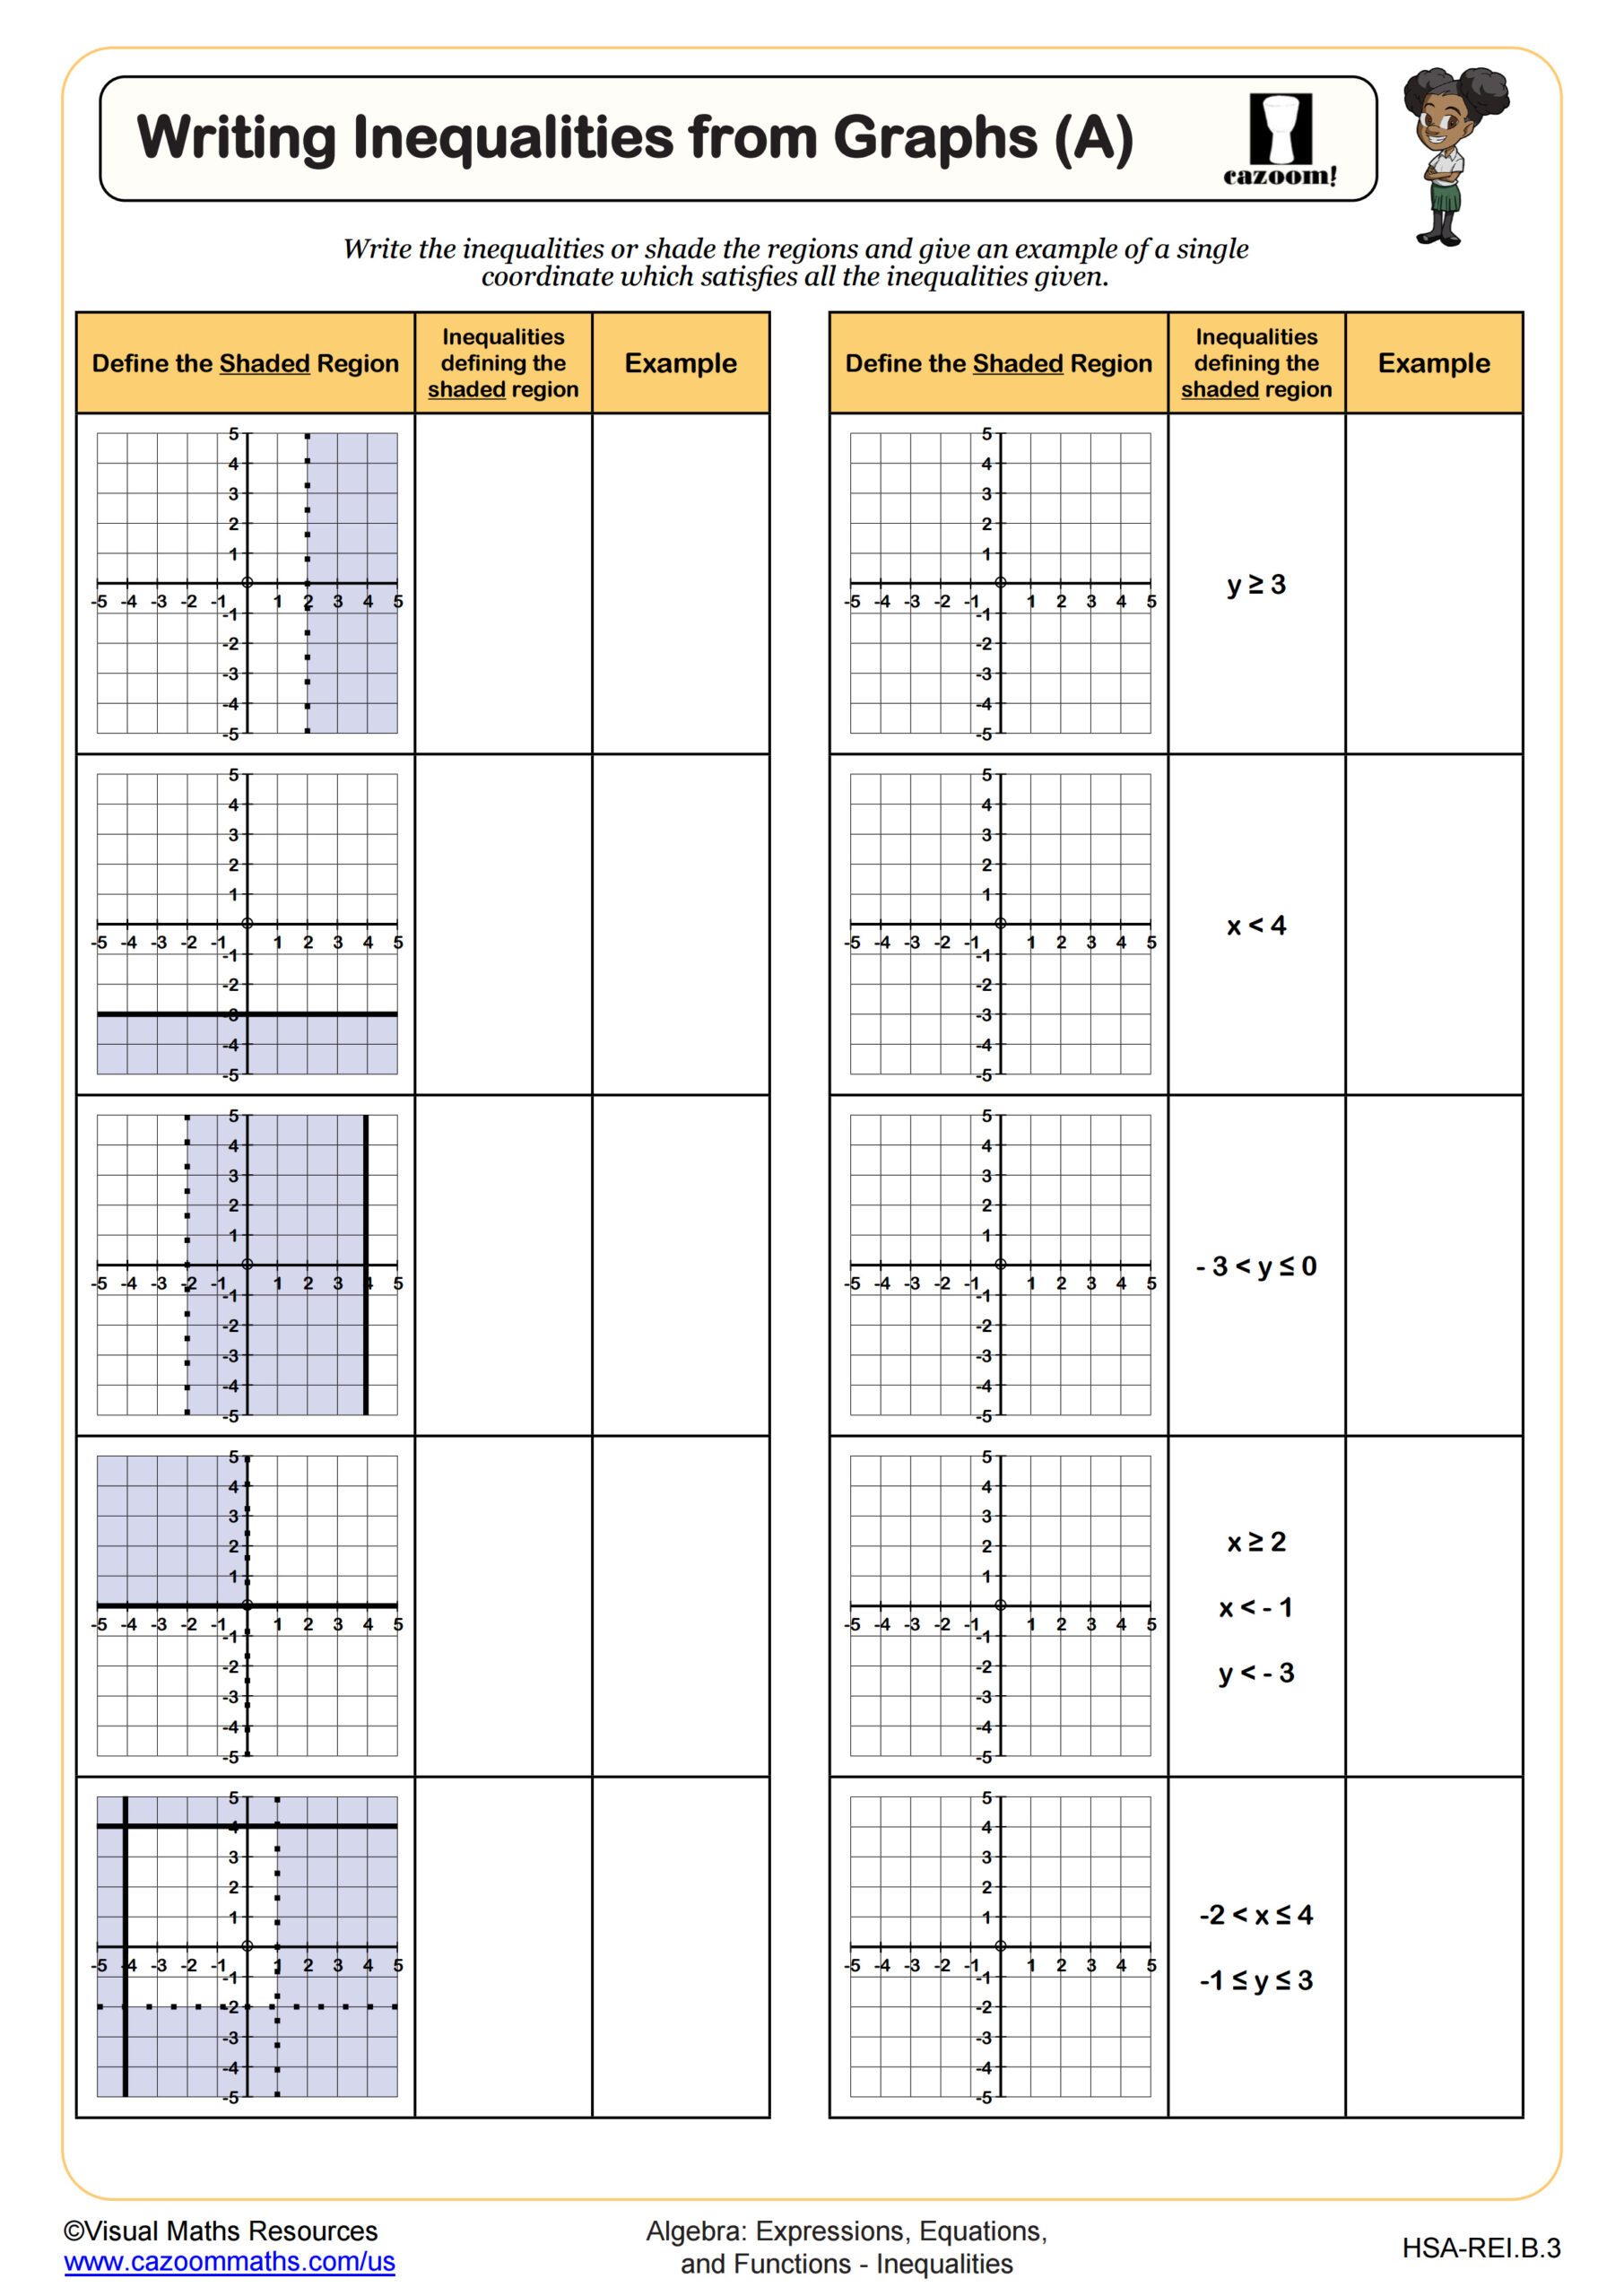
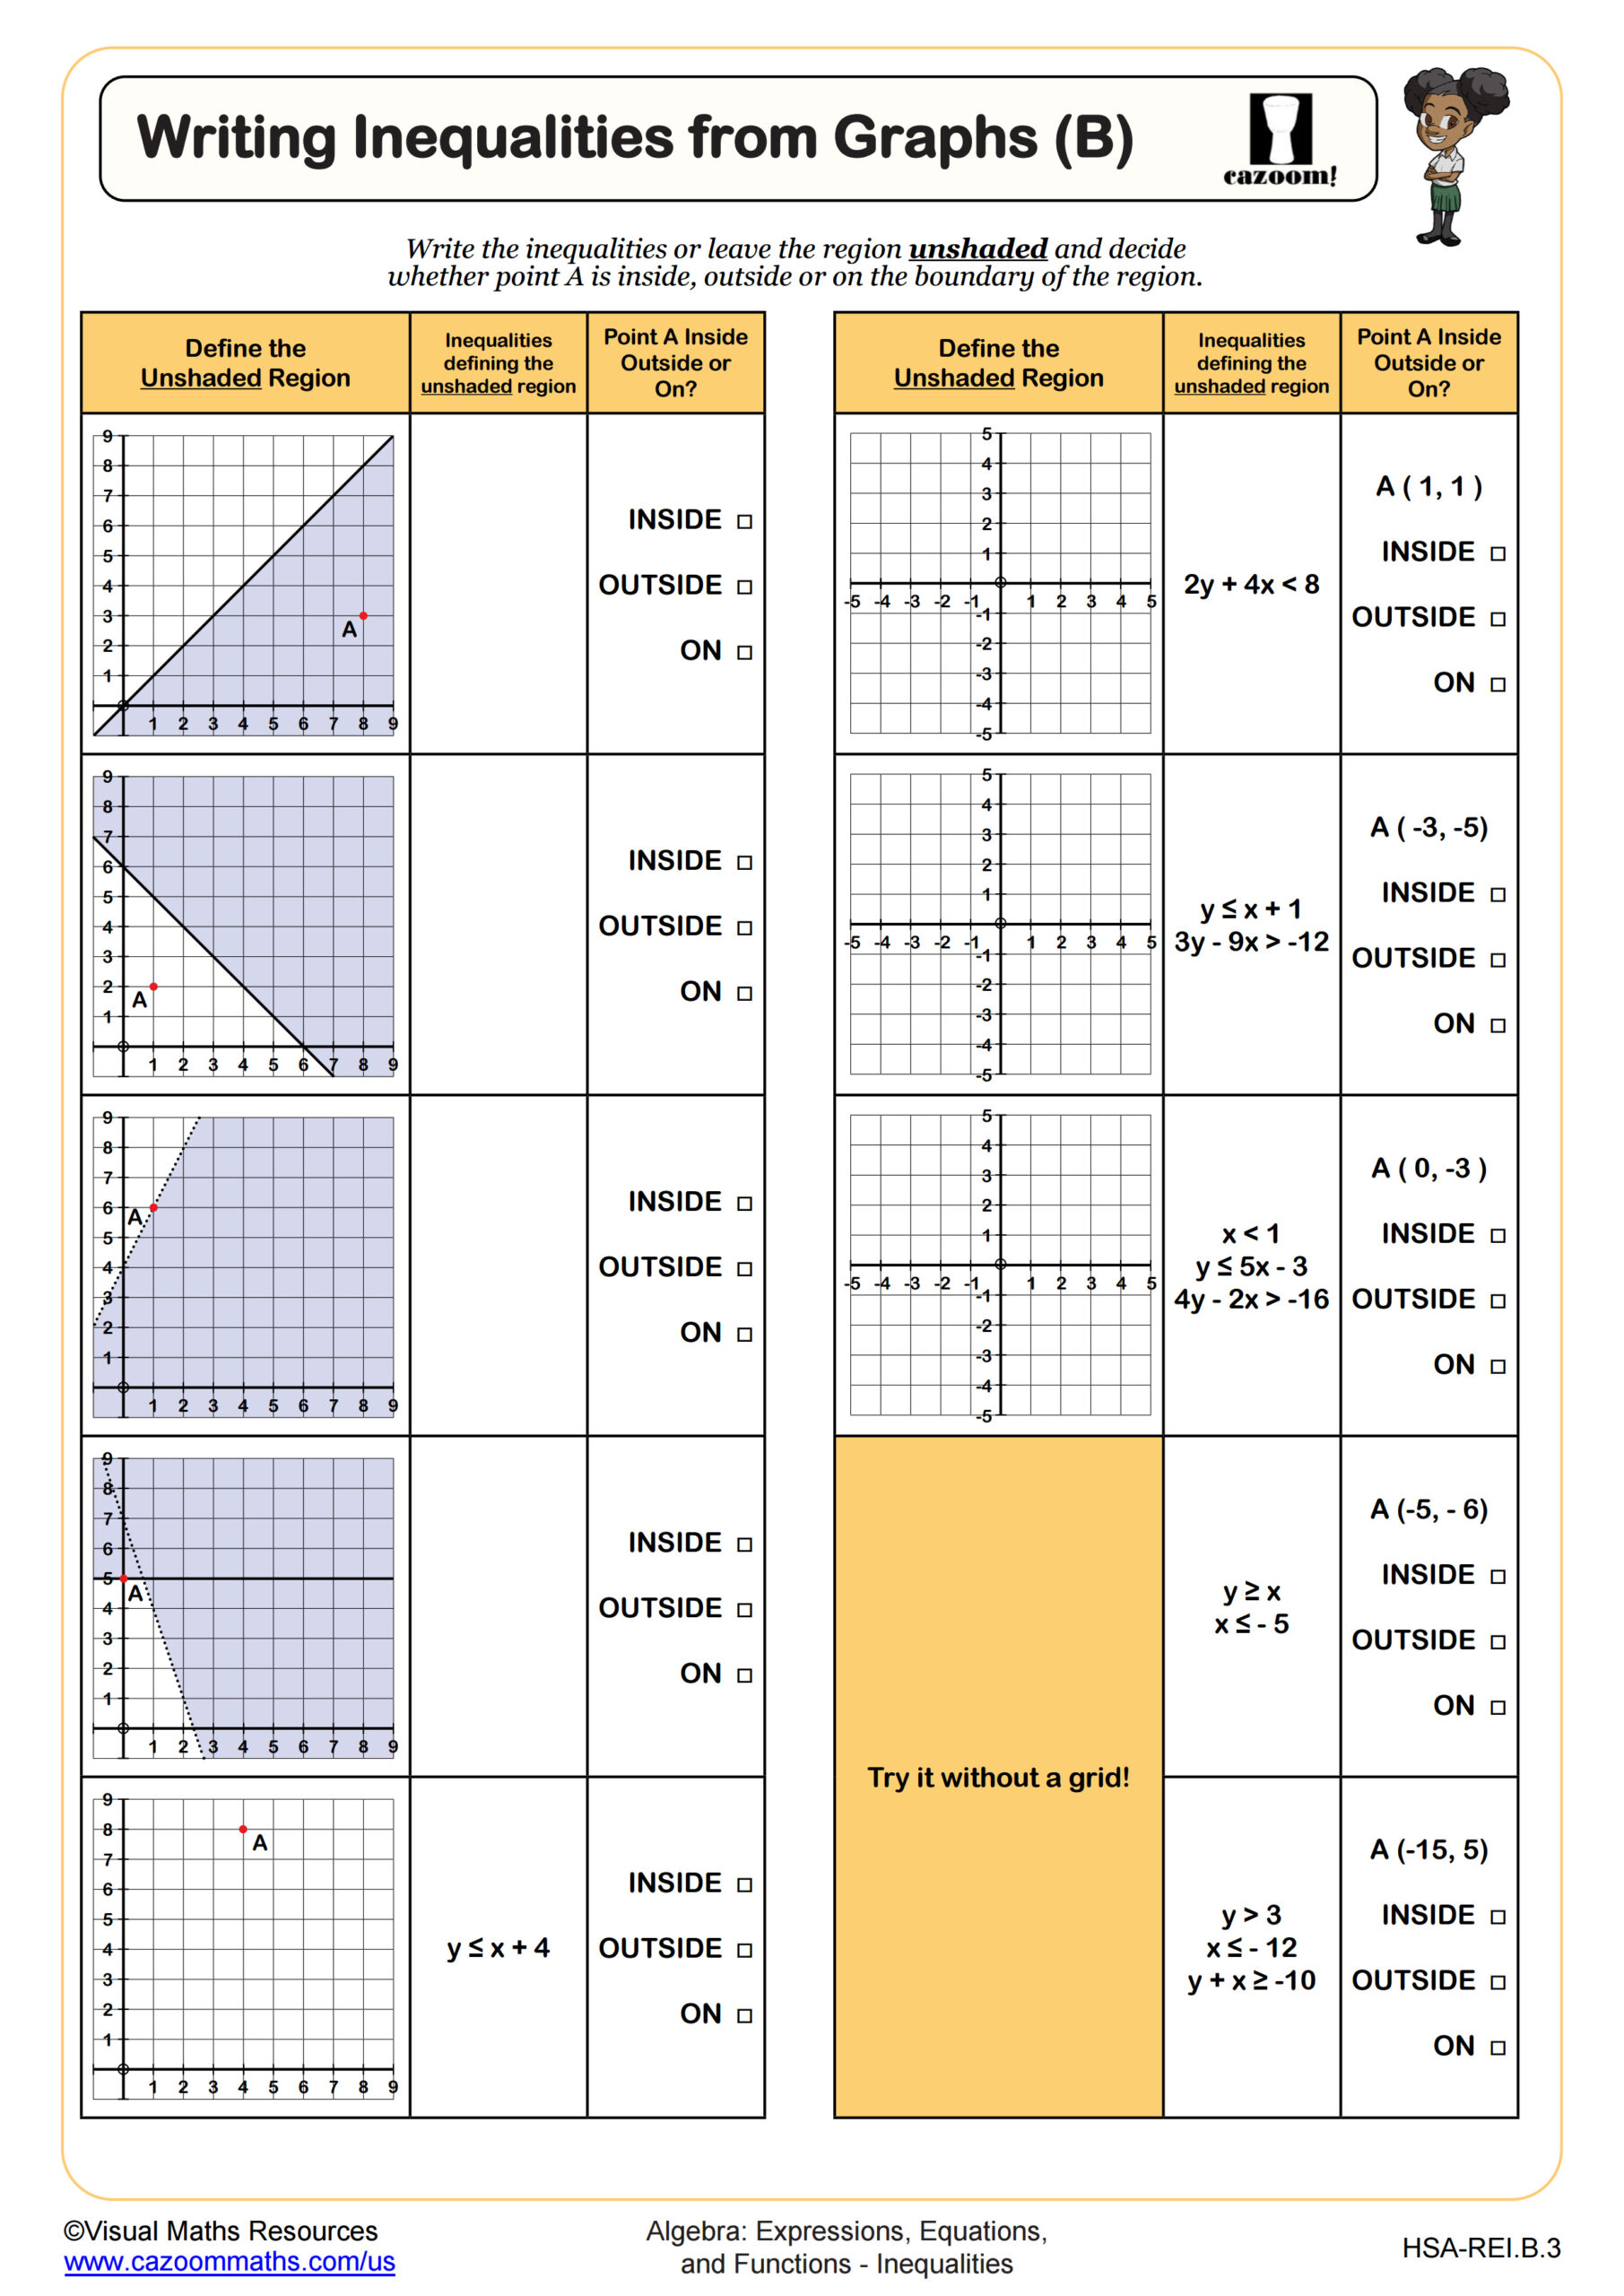
Section B requires students to state the inequality or inequalities that define the shaded region. Here regions are bound by 1, 2 or 3 linear inequalities.
Lastly, Section C will see students plotting straight lines and shading regions which satisfy different inequalities over 6 questions. Students are provided with separate coordinate grids to draw on and again regions are bound by up to three inequalities.
All worksheets are created by the team of experienced teachers at Cazoom Math.

RELATED TO Graphing Inequalities (C) WORKSHEET
Frequently Asked Questions
This worksheet is designed for 8th Grade, IM 1, and Algebra I students. The content aligns well with these grade levels since students at this stage are developing their understanding of linear inequalities and coordinate graphing. The progressive structure from identifying regions to plotting and shading makes it accessible for students across these different mathematical levels.