Grouped Frequency Tables WORKSHEET
Understand that statistics can be used to gain information about a population by examining a sample of the population; generalizations about a population from a sample are valid only if the sample is representative of that population. Understand that random sampling tends to produce representative samples and support valid inferences.
Grouped Frequency Tables WORKSHEET DESCRIPTION
This worksheet on Grouped Frequency Tables offers a comprehensive introduction to constructing and interpreting grouped data.
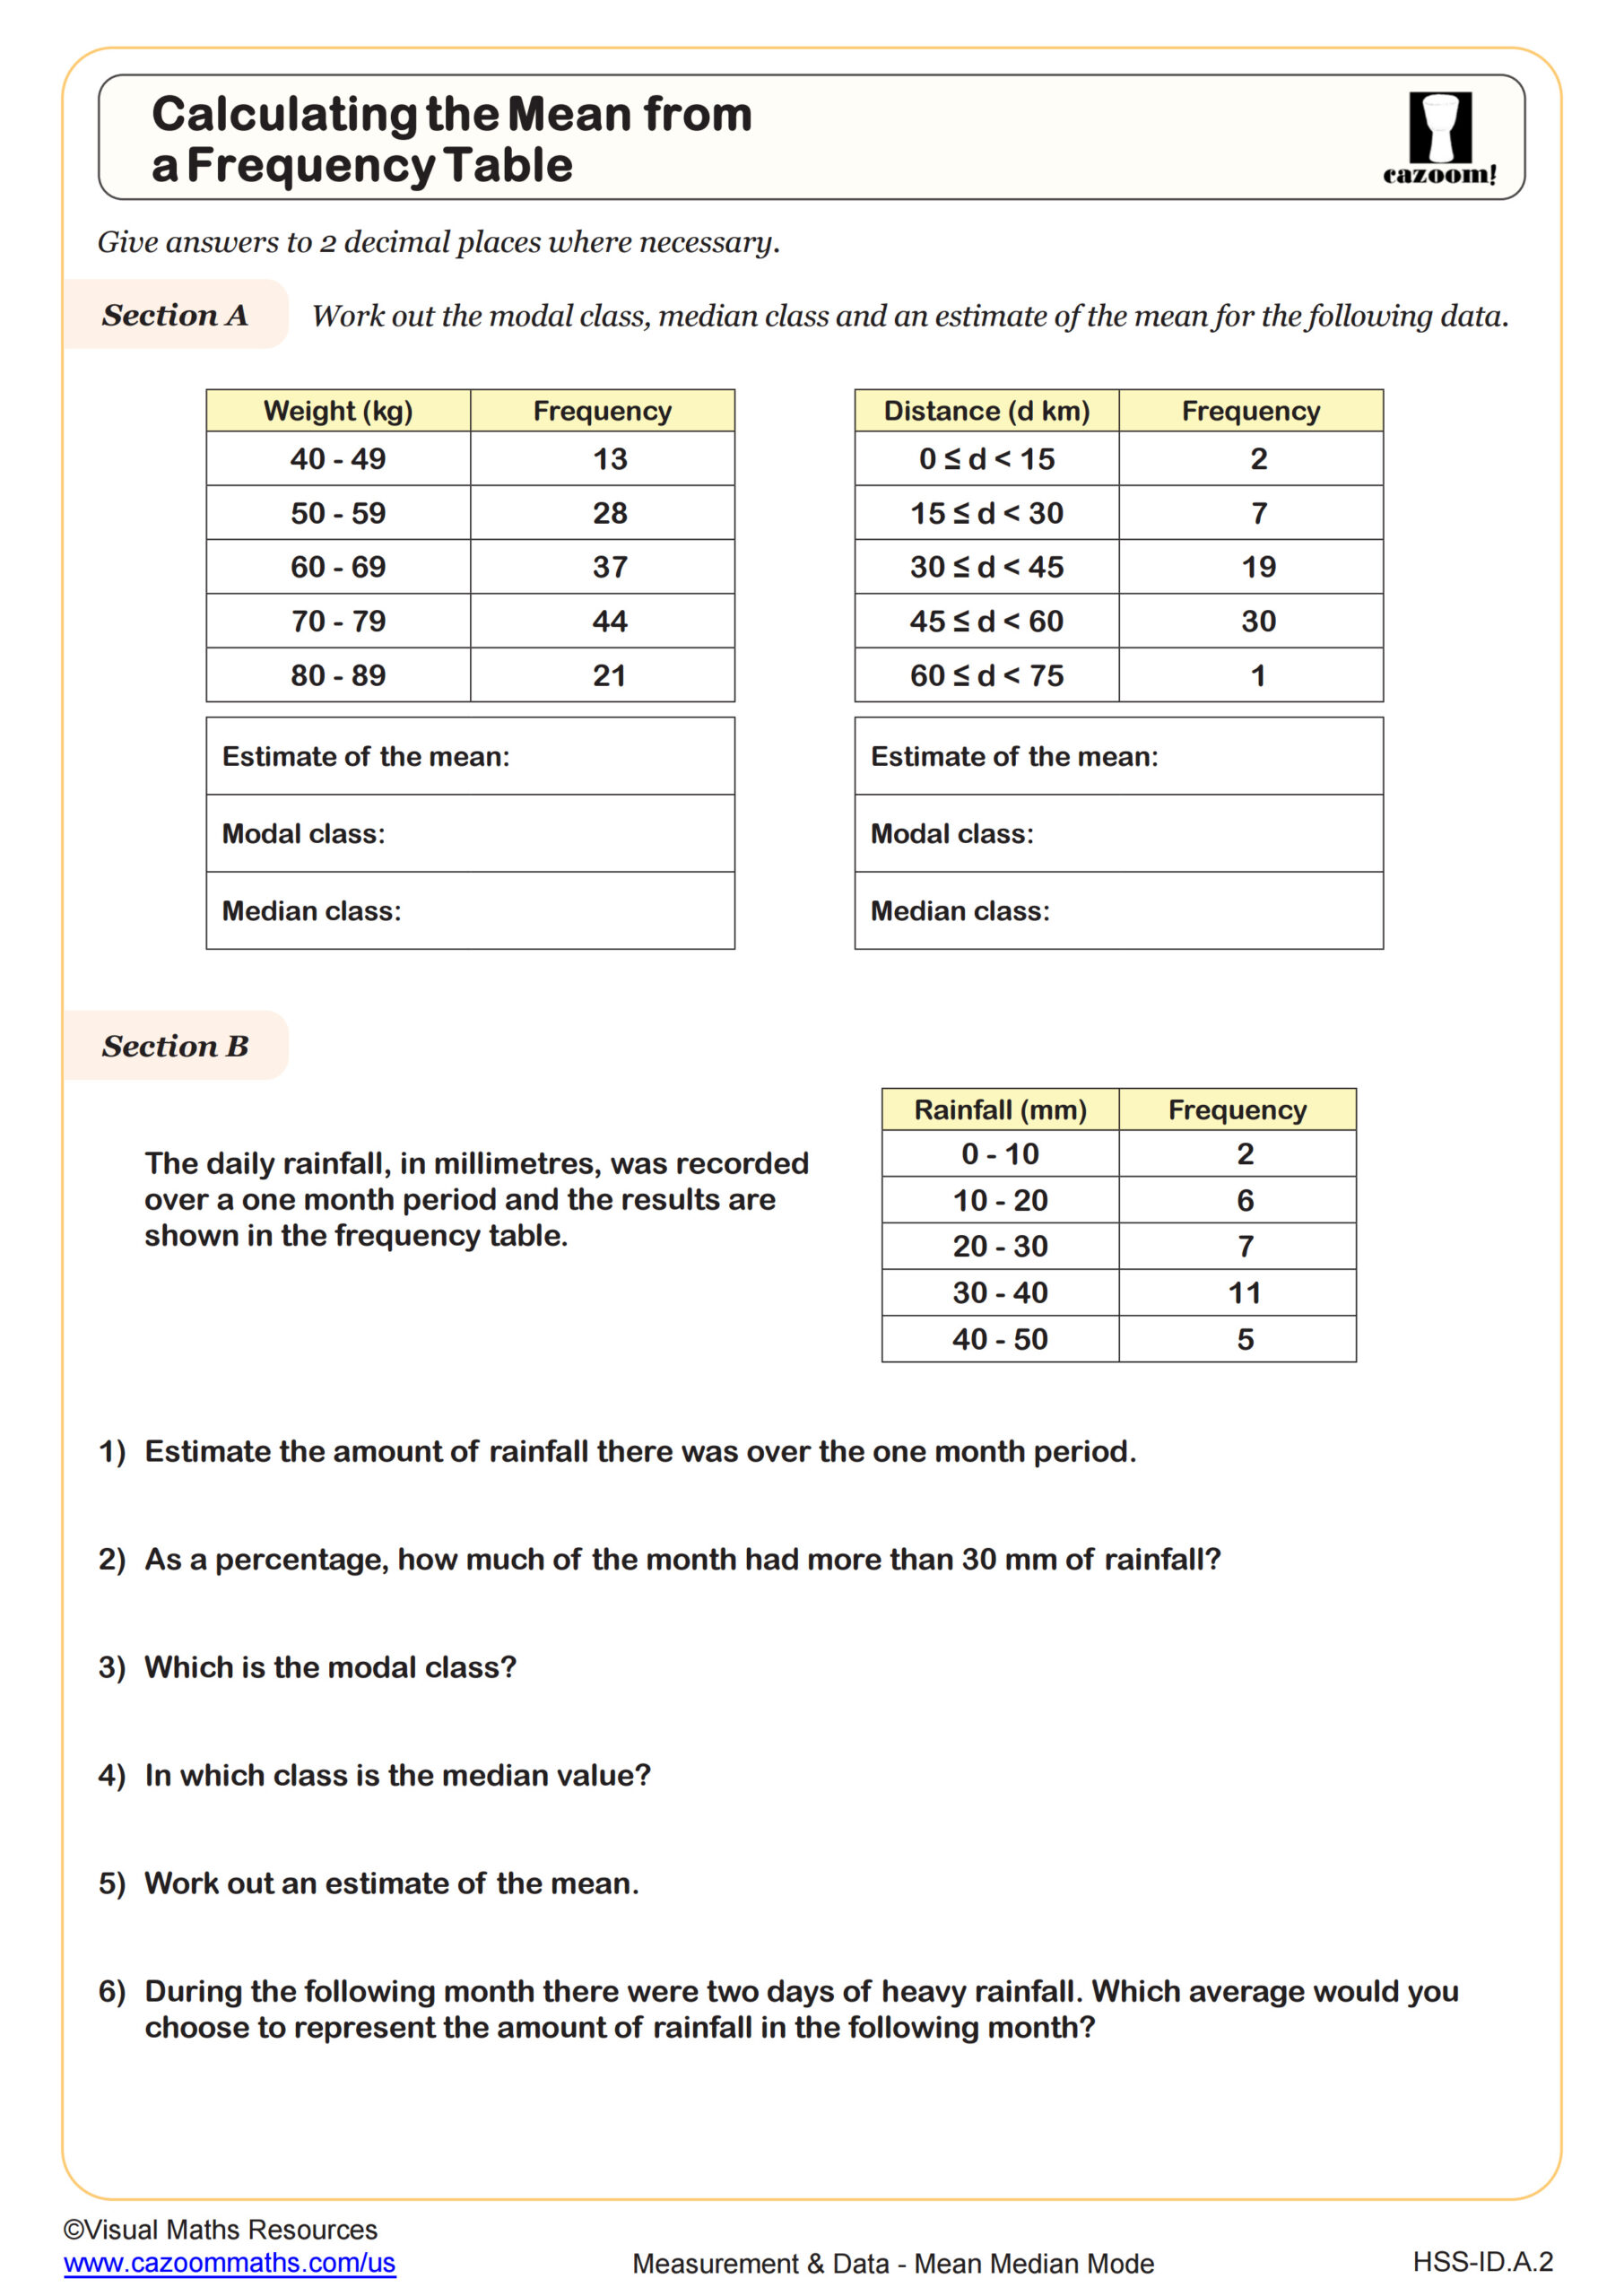
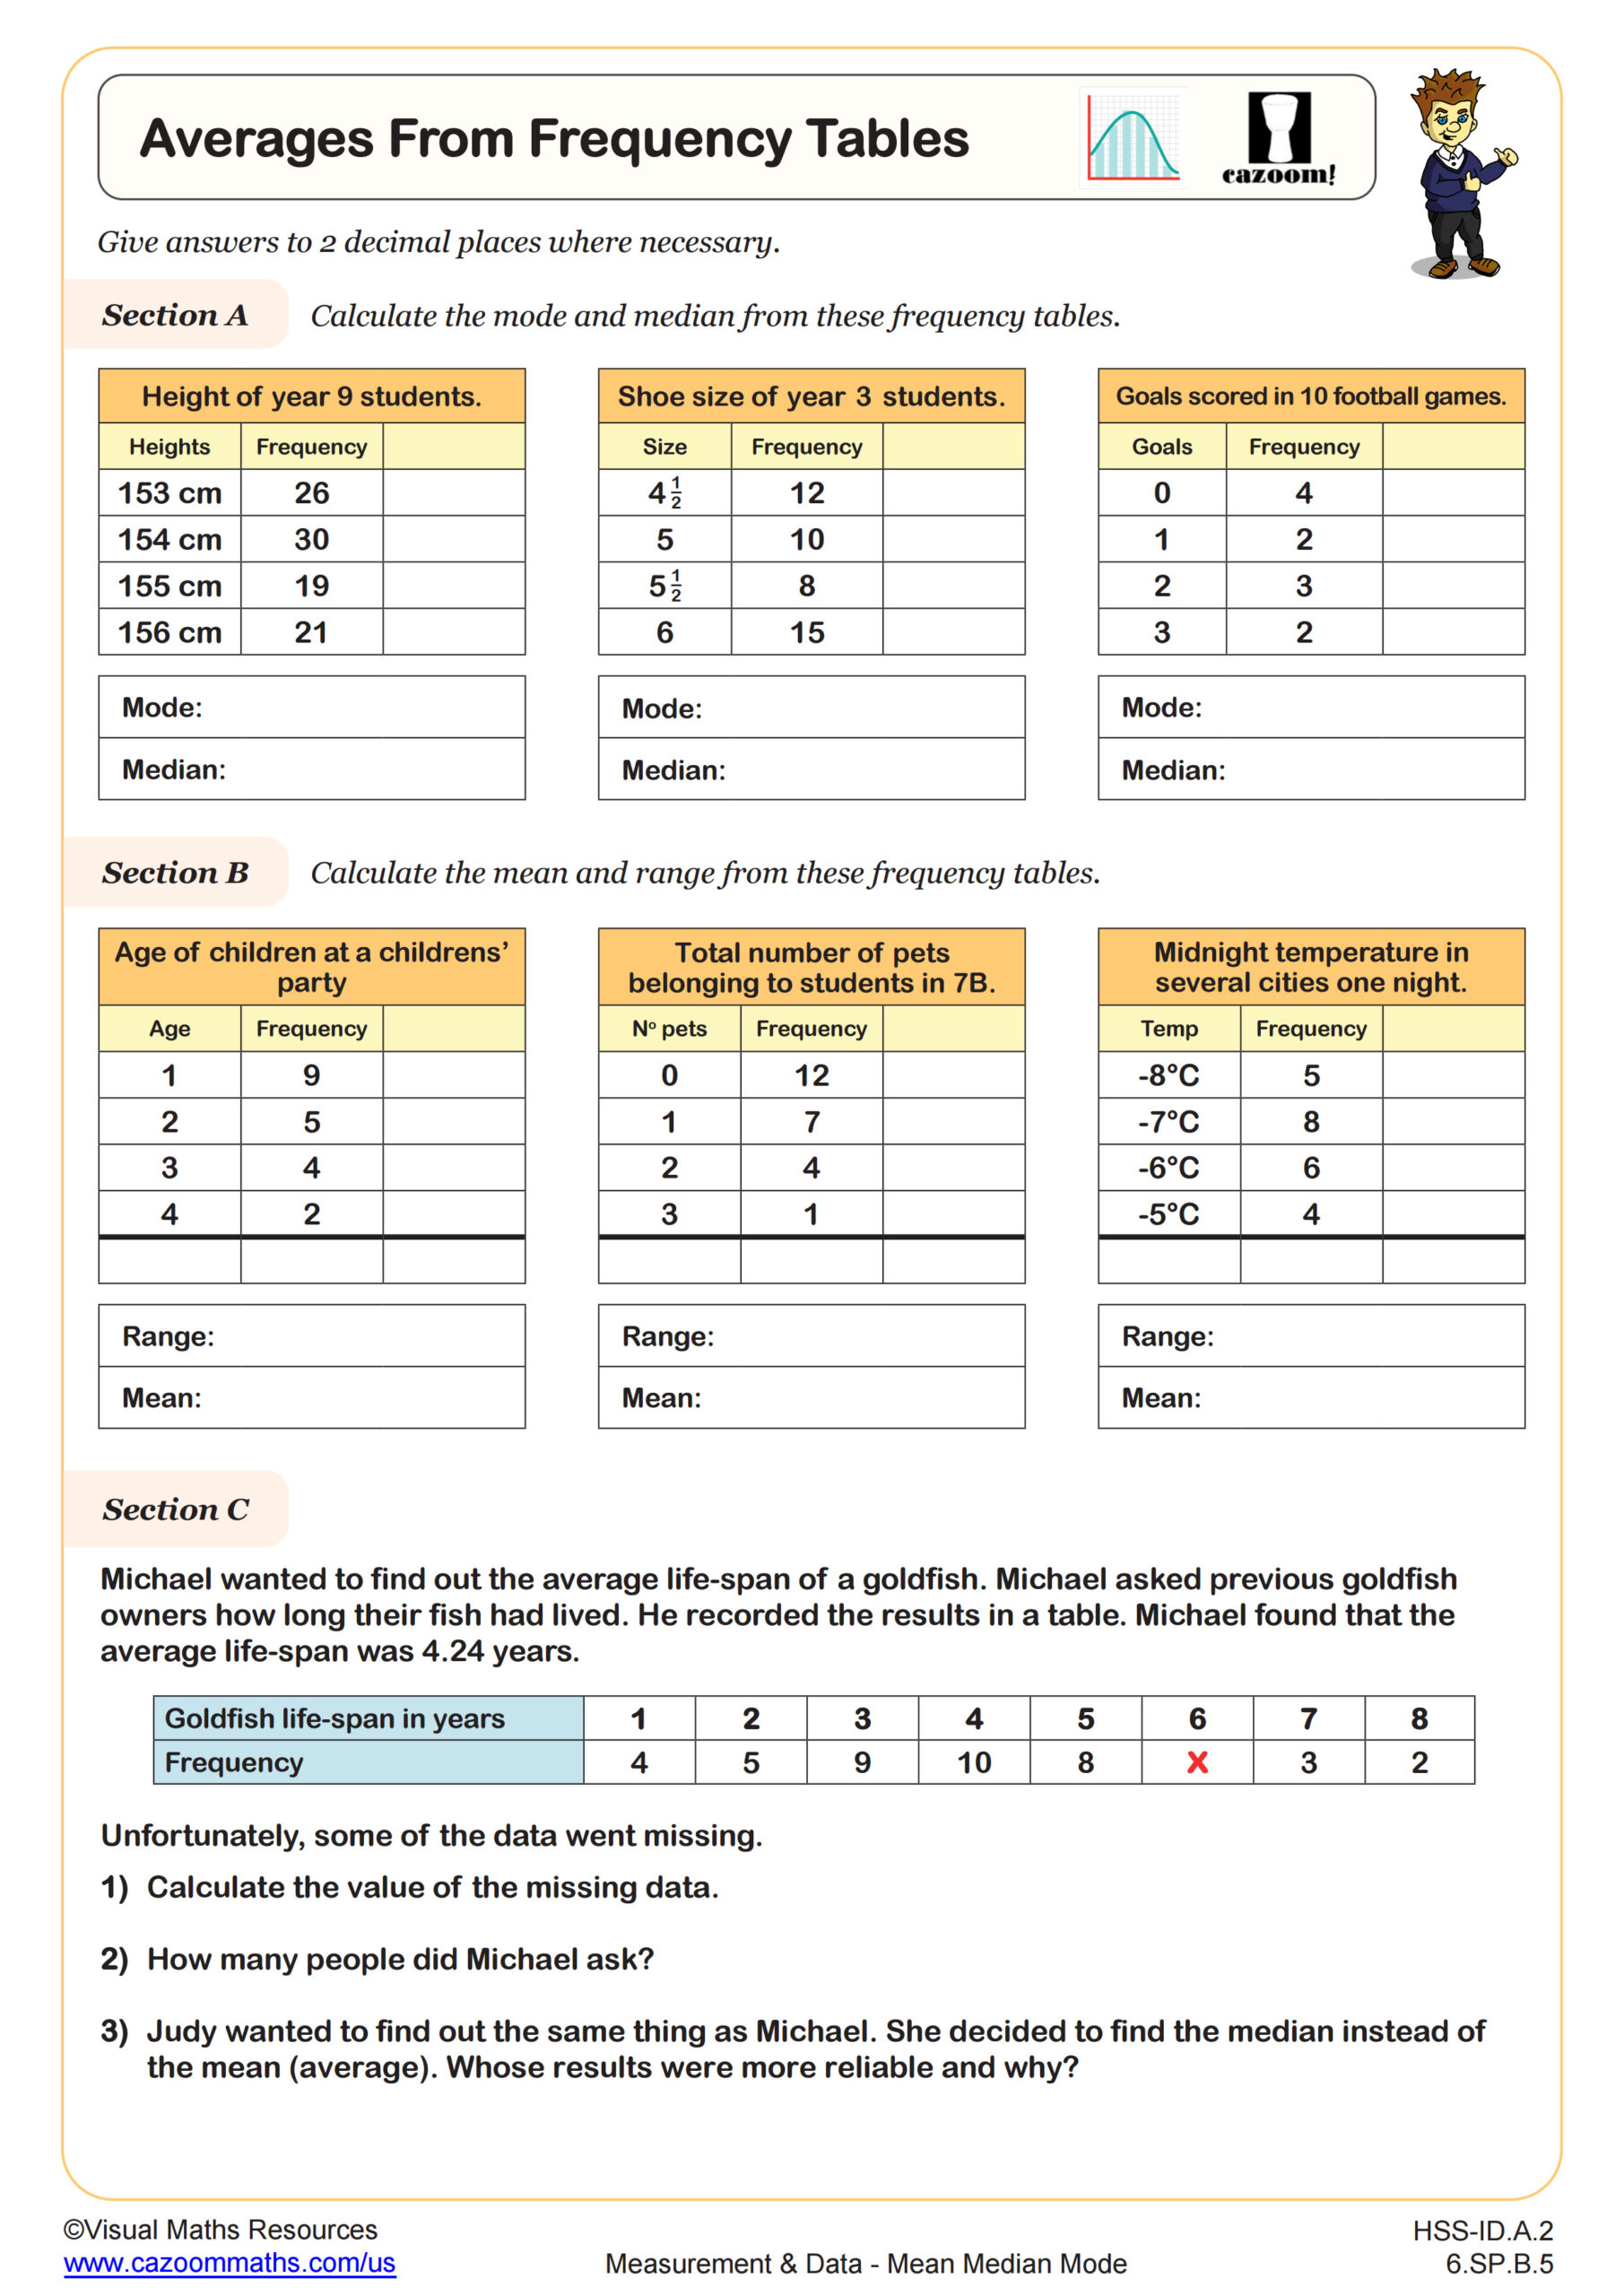
Section A presents scenarios involving grouped frequency data, such as pupils' heights and runners' race times. Students will read and interpret information from the tables in order to answer questions.
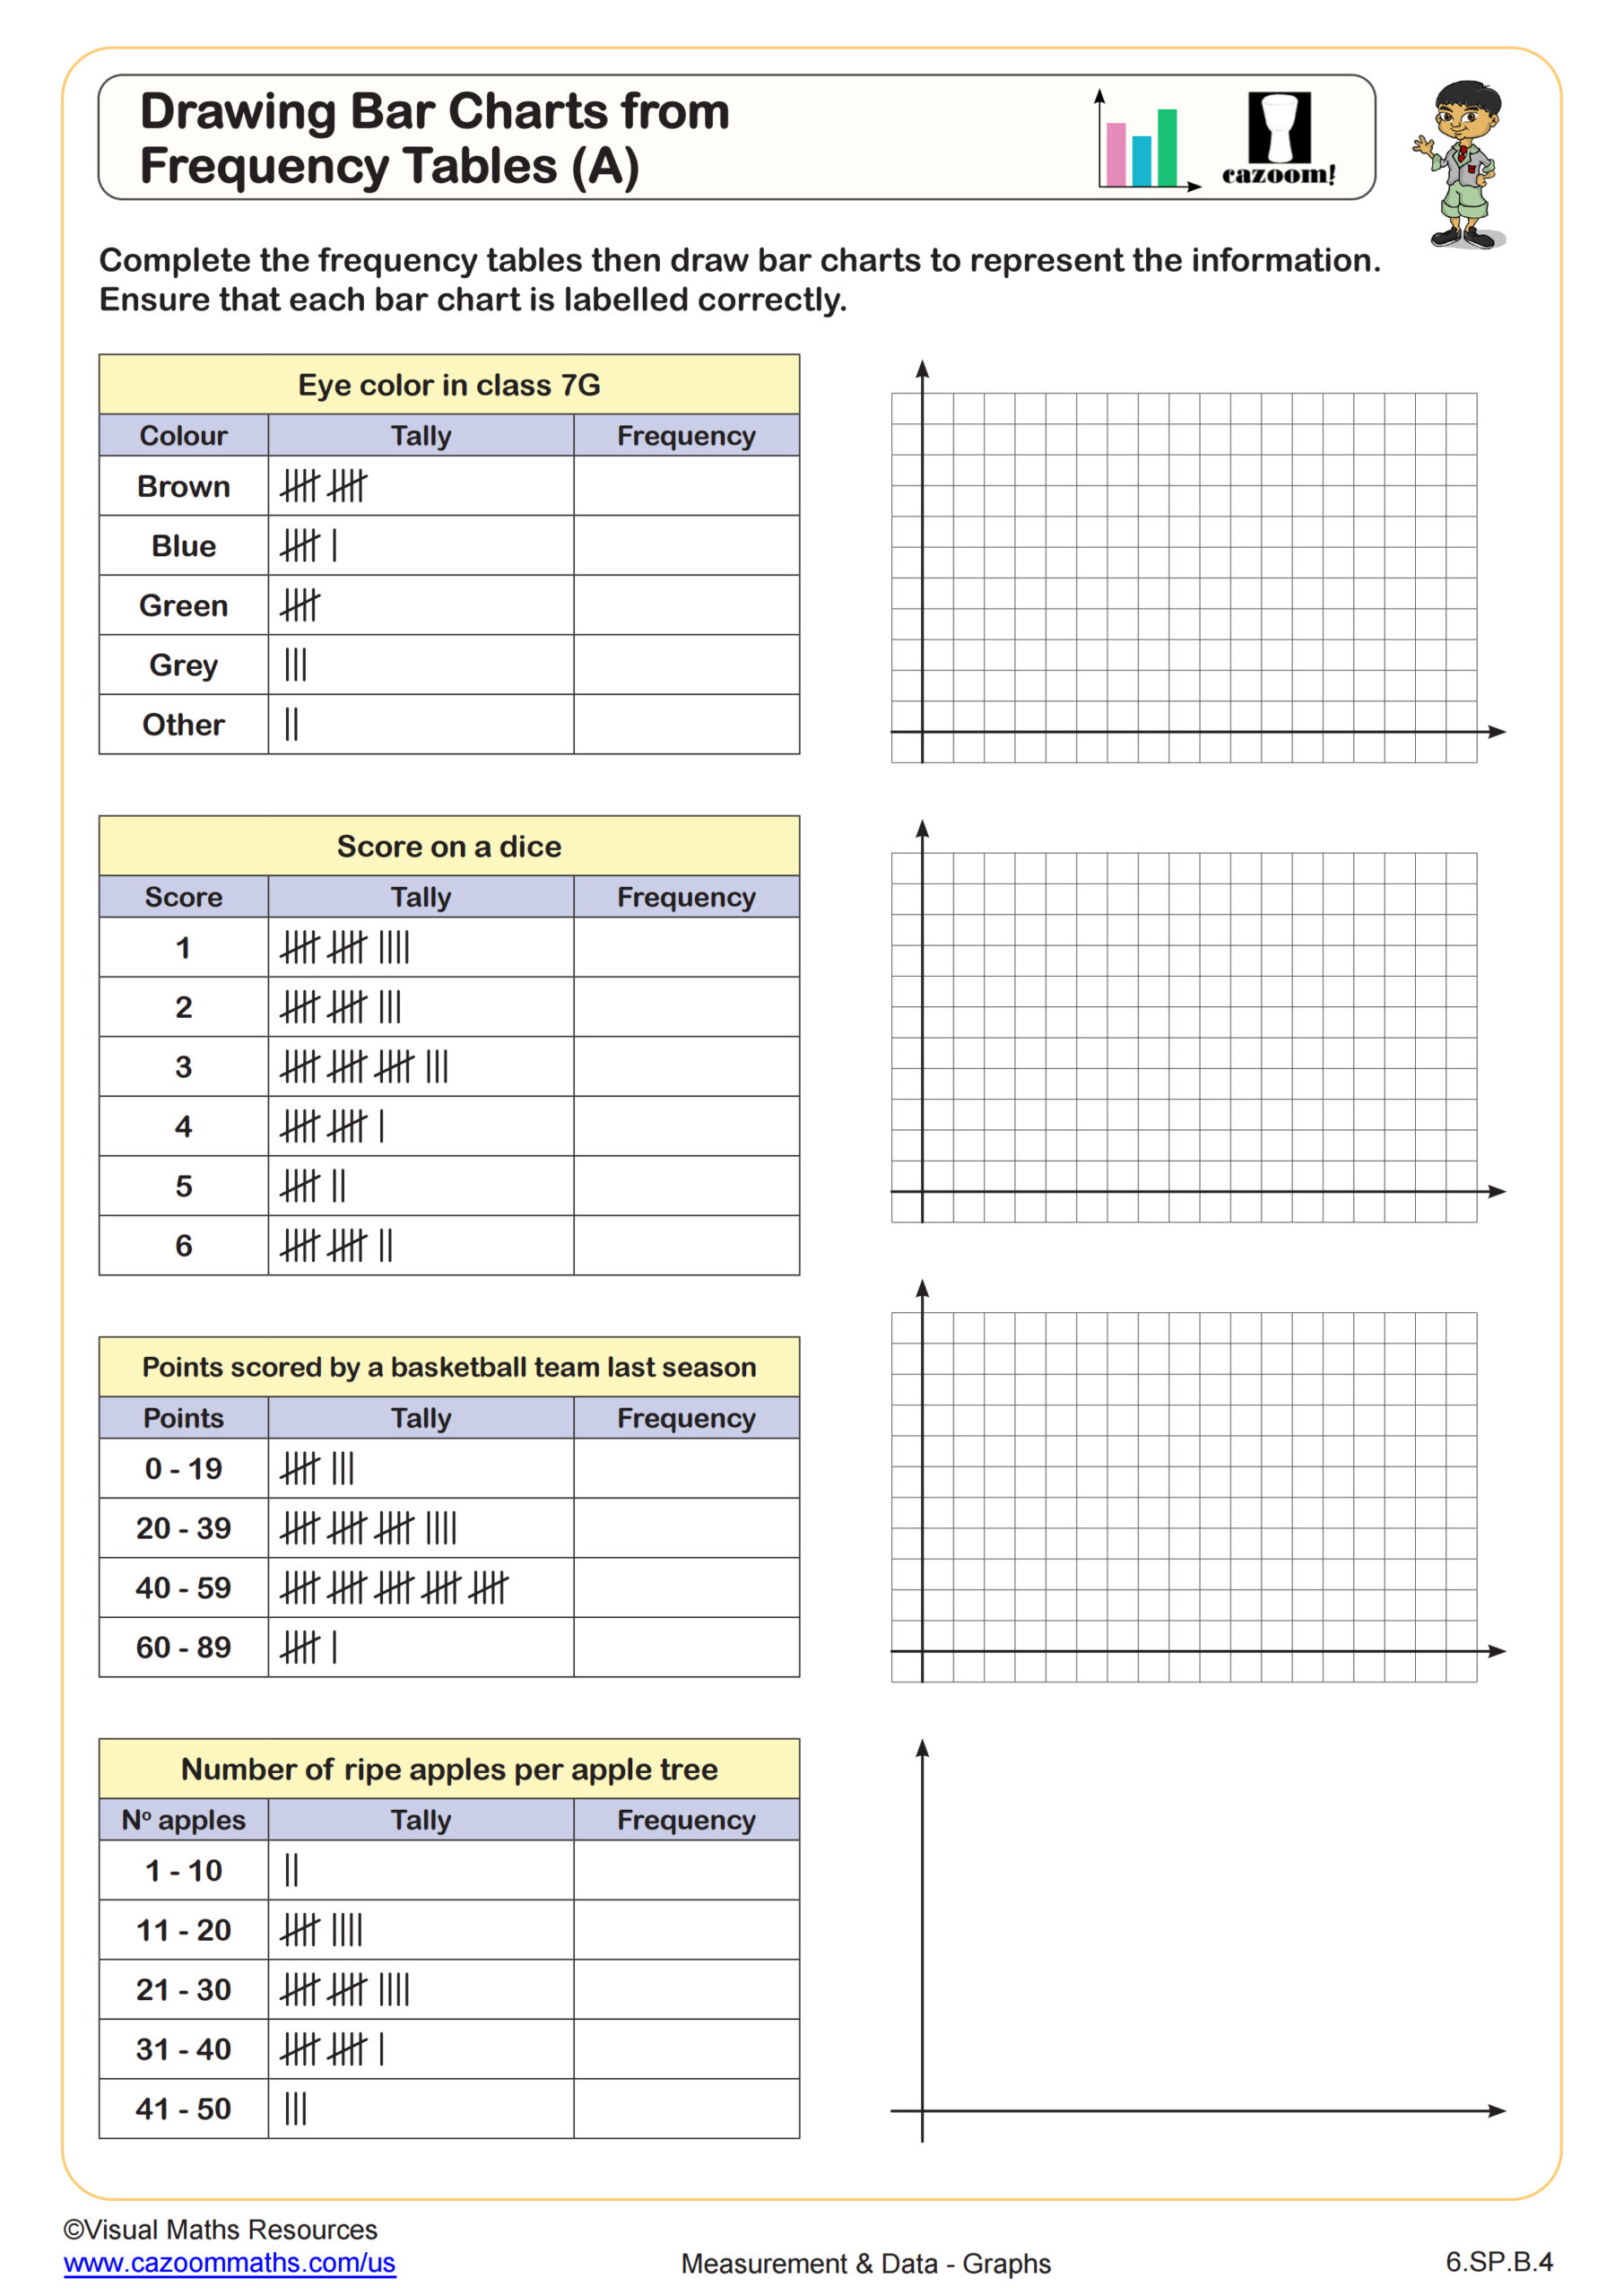
Section B tasks students with constructing their own grouped frequency tables using provided datasets. Examples include organizing test scores from a Maths Olympiad and grouping the weights of dogs participating in a dog show.
The worksheet helps develop key skills in organizing and analyzing data, making it suitable for building a solid foundation in statistics.
All worksheets are created by the team of experienced teachers at Cazoom Math.

RELATED TO Grouped Frequency Tables WORKSHEET
Frequently Asked Questions
This worksheet is designed for 6th and 7th grade students who are developing their statistical reasoning skills. The content aligns well with middle school math standards where students begin working more systematically with data organization and analysis. The progression from interpreting existing tables to constructing their own helps build confidence at these grade levels.