Histograms (B) WORKSHEET
Represent data with plots on the real number line (dot plots, histograms, and box plots).
Histograms (B) WORKSHEET DESCRIPTION
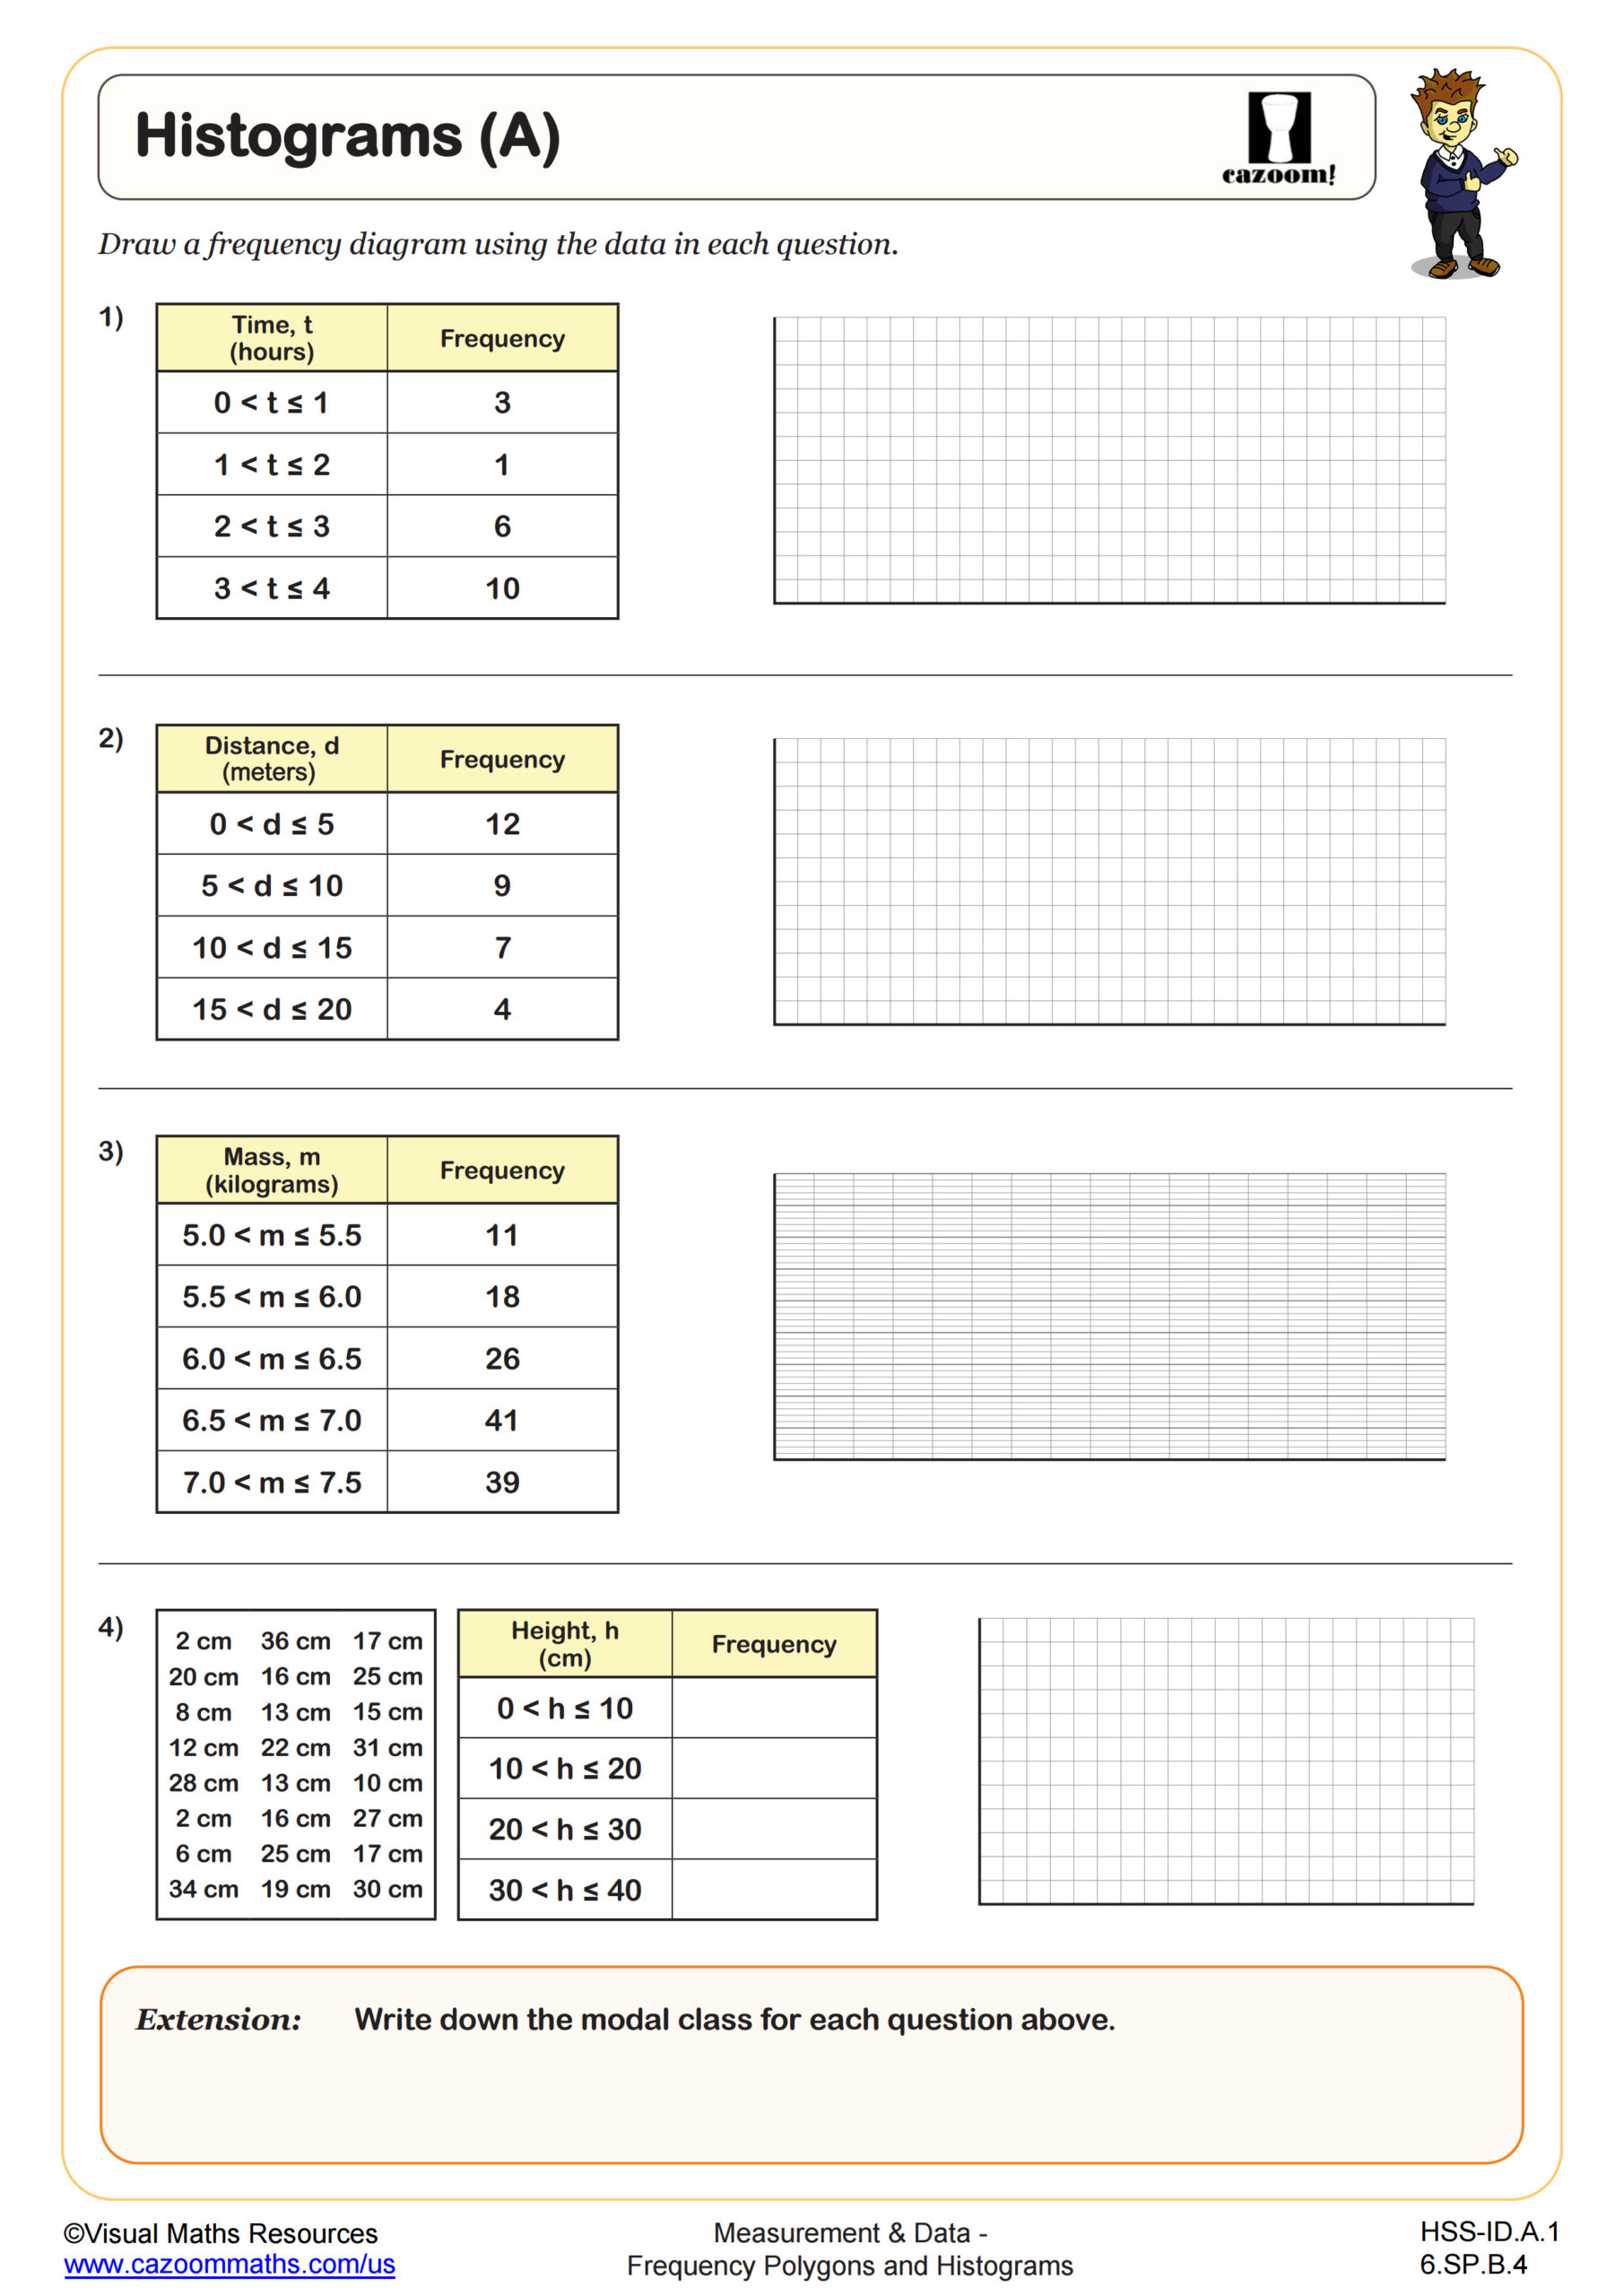
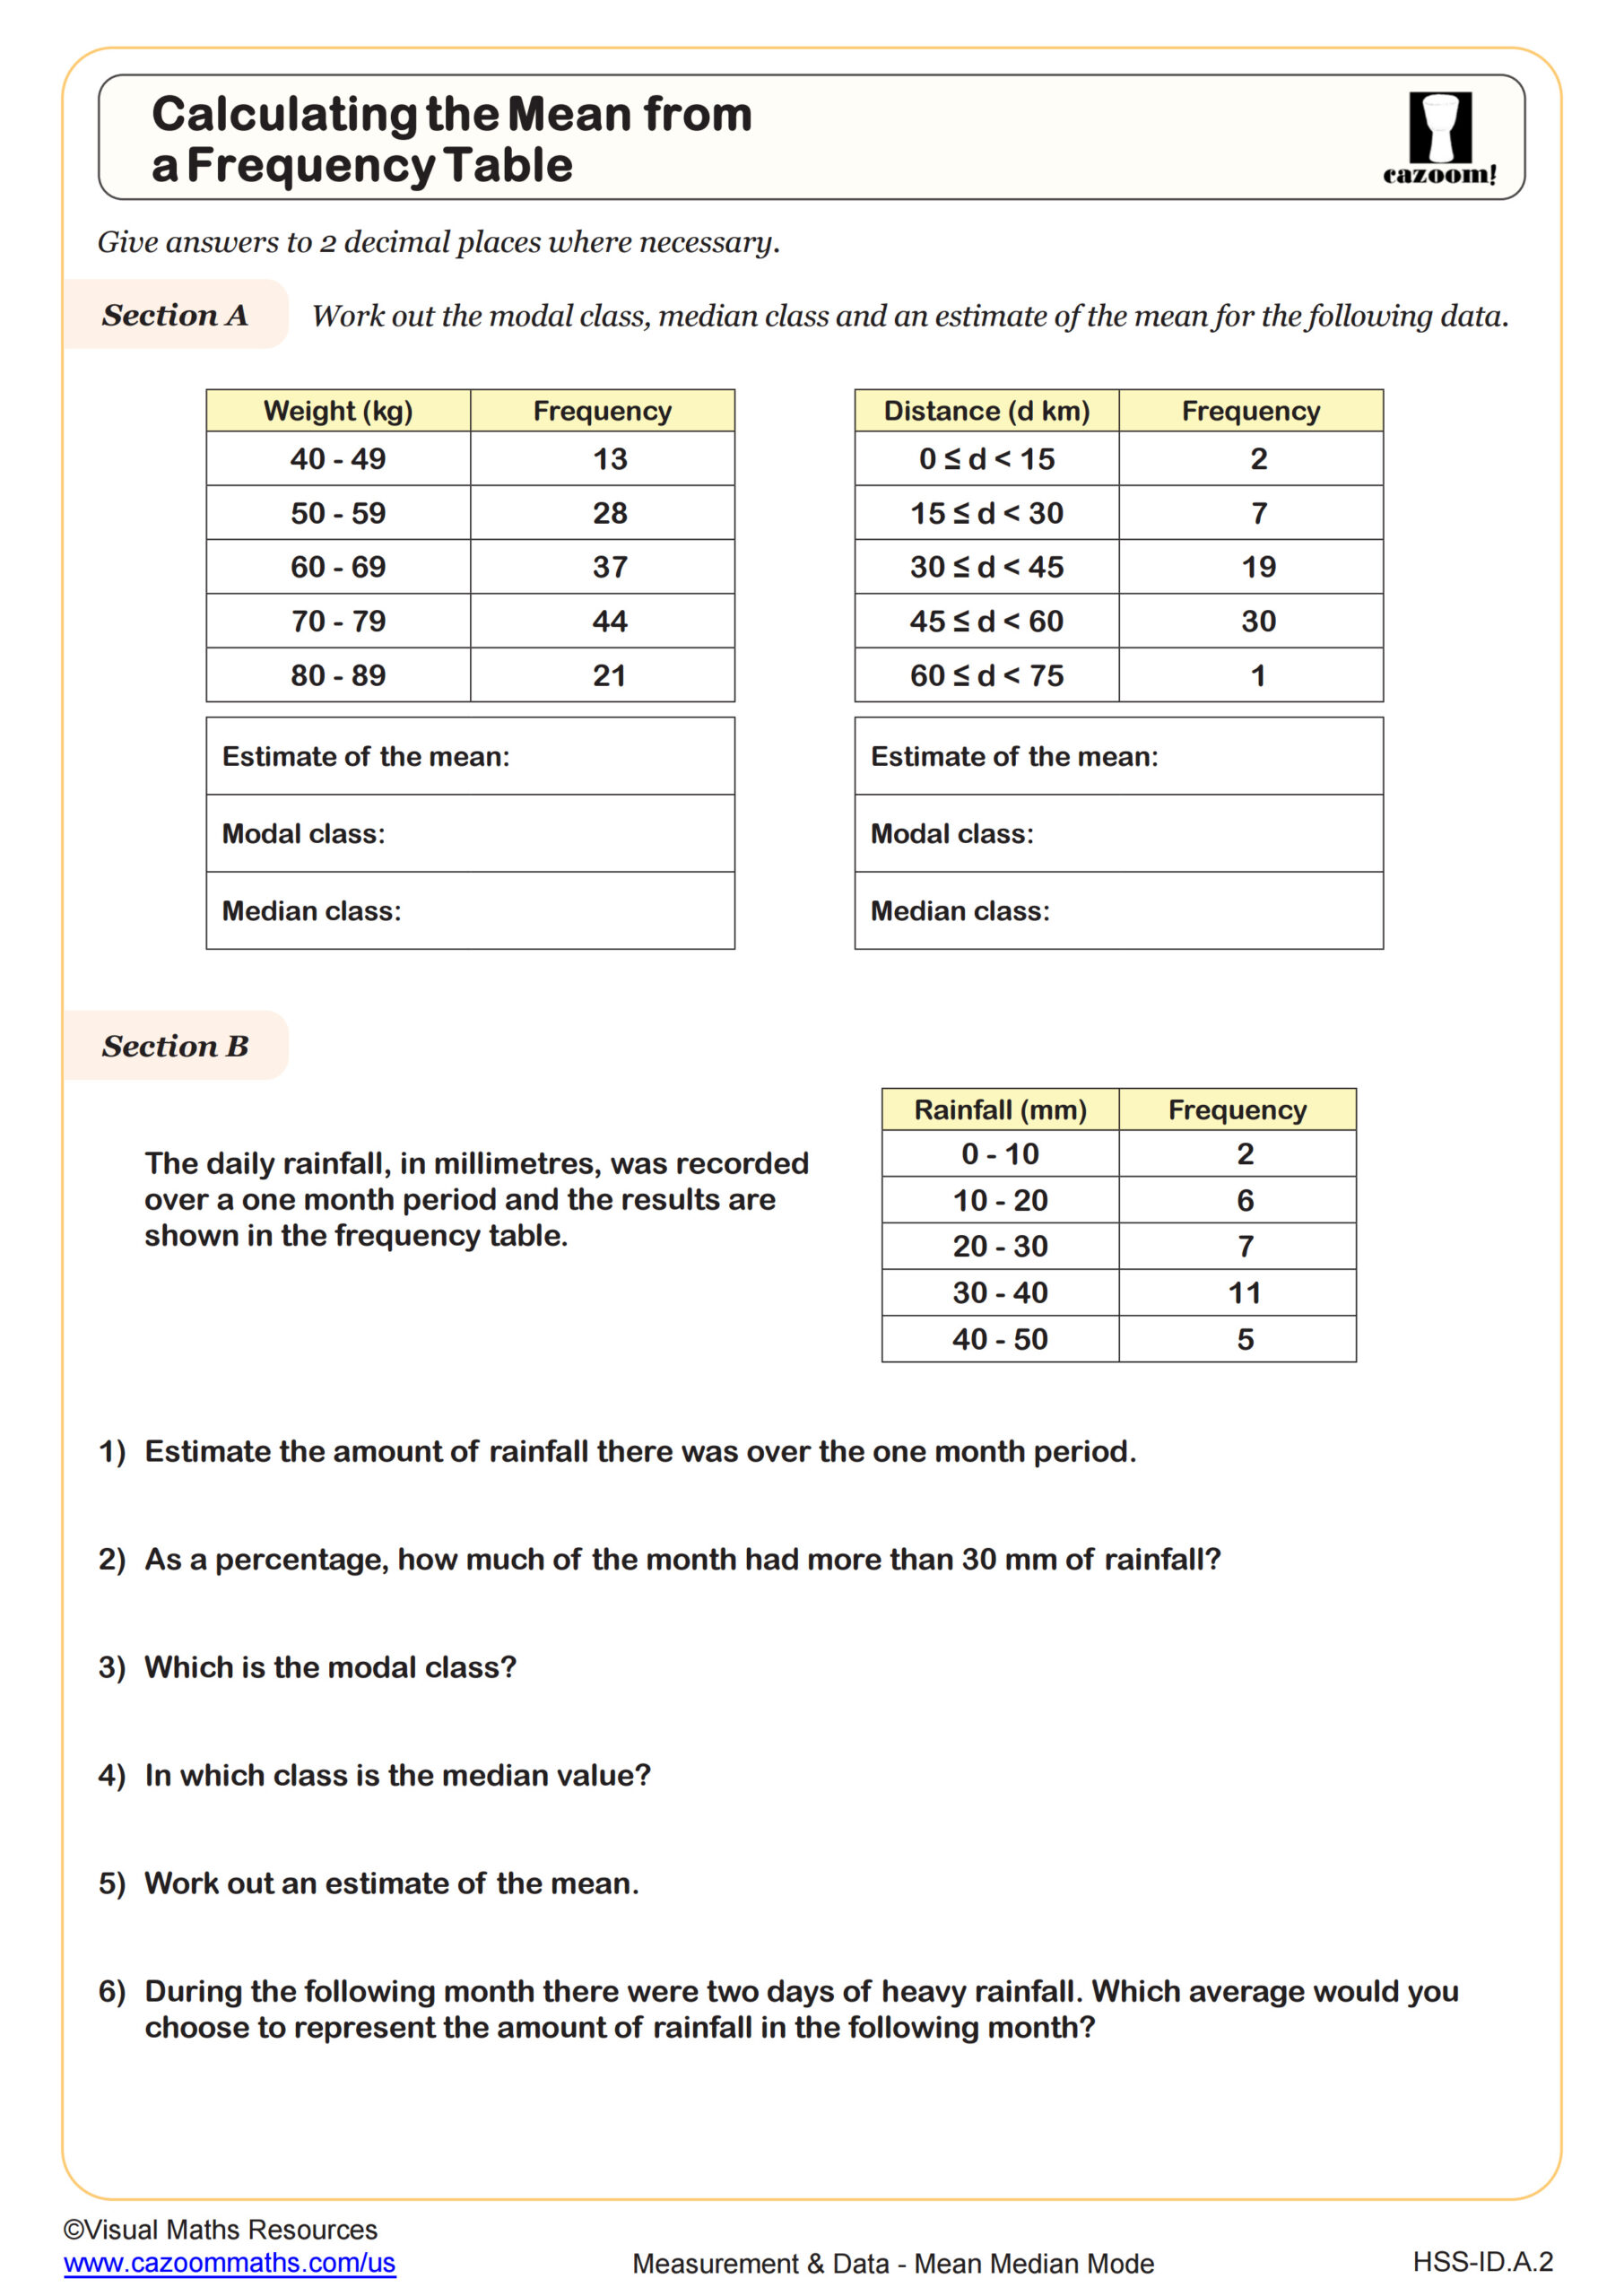
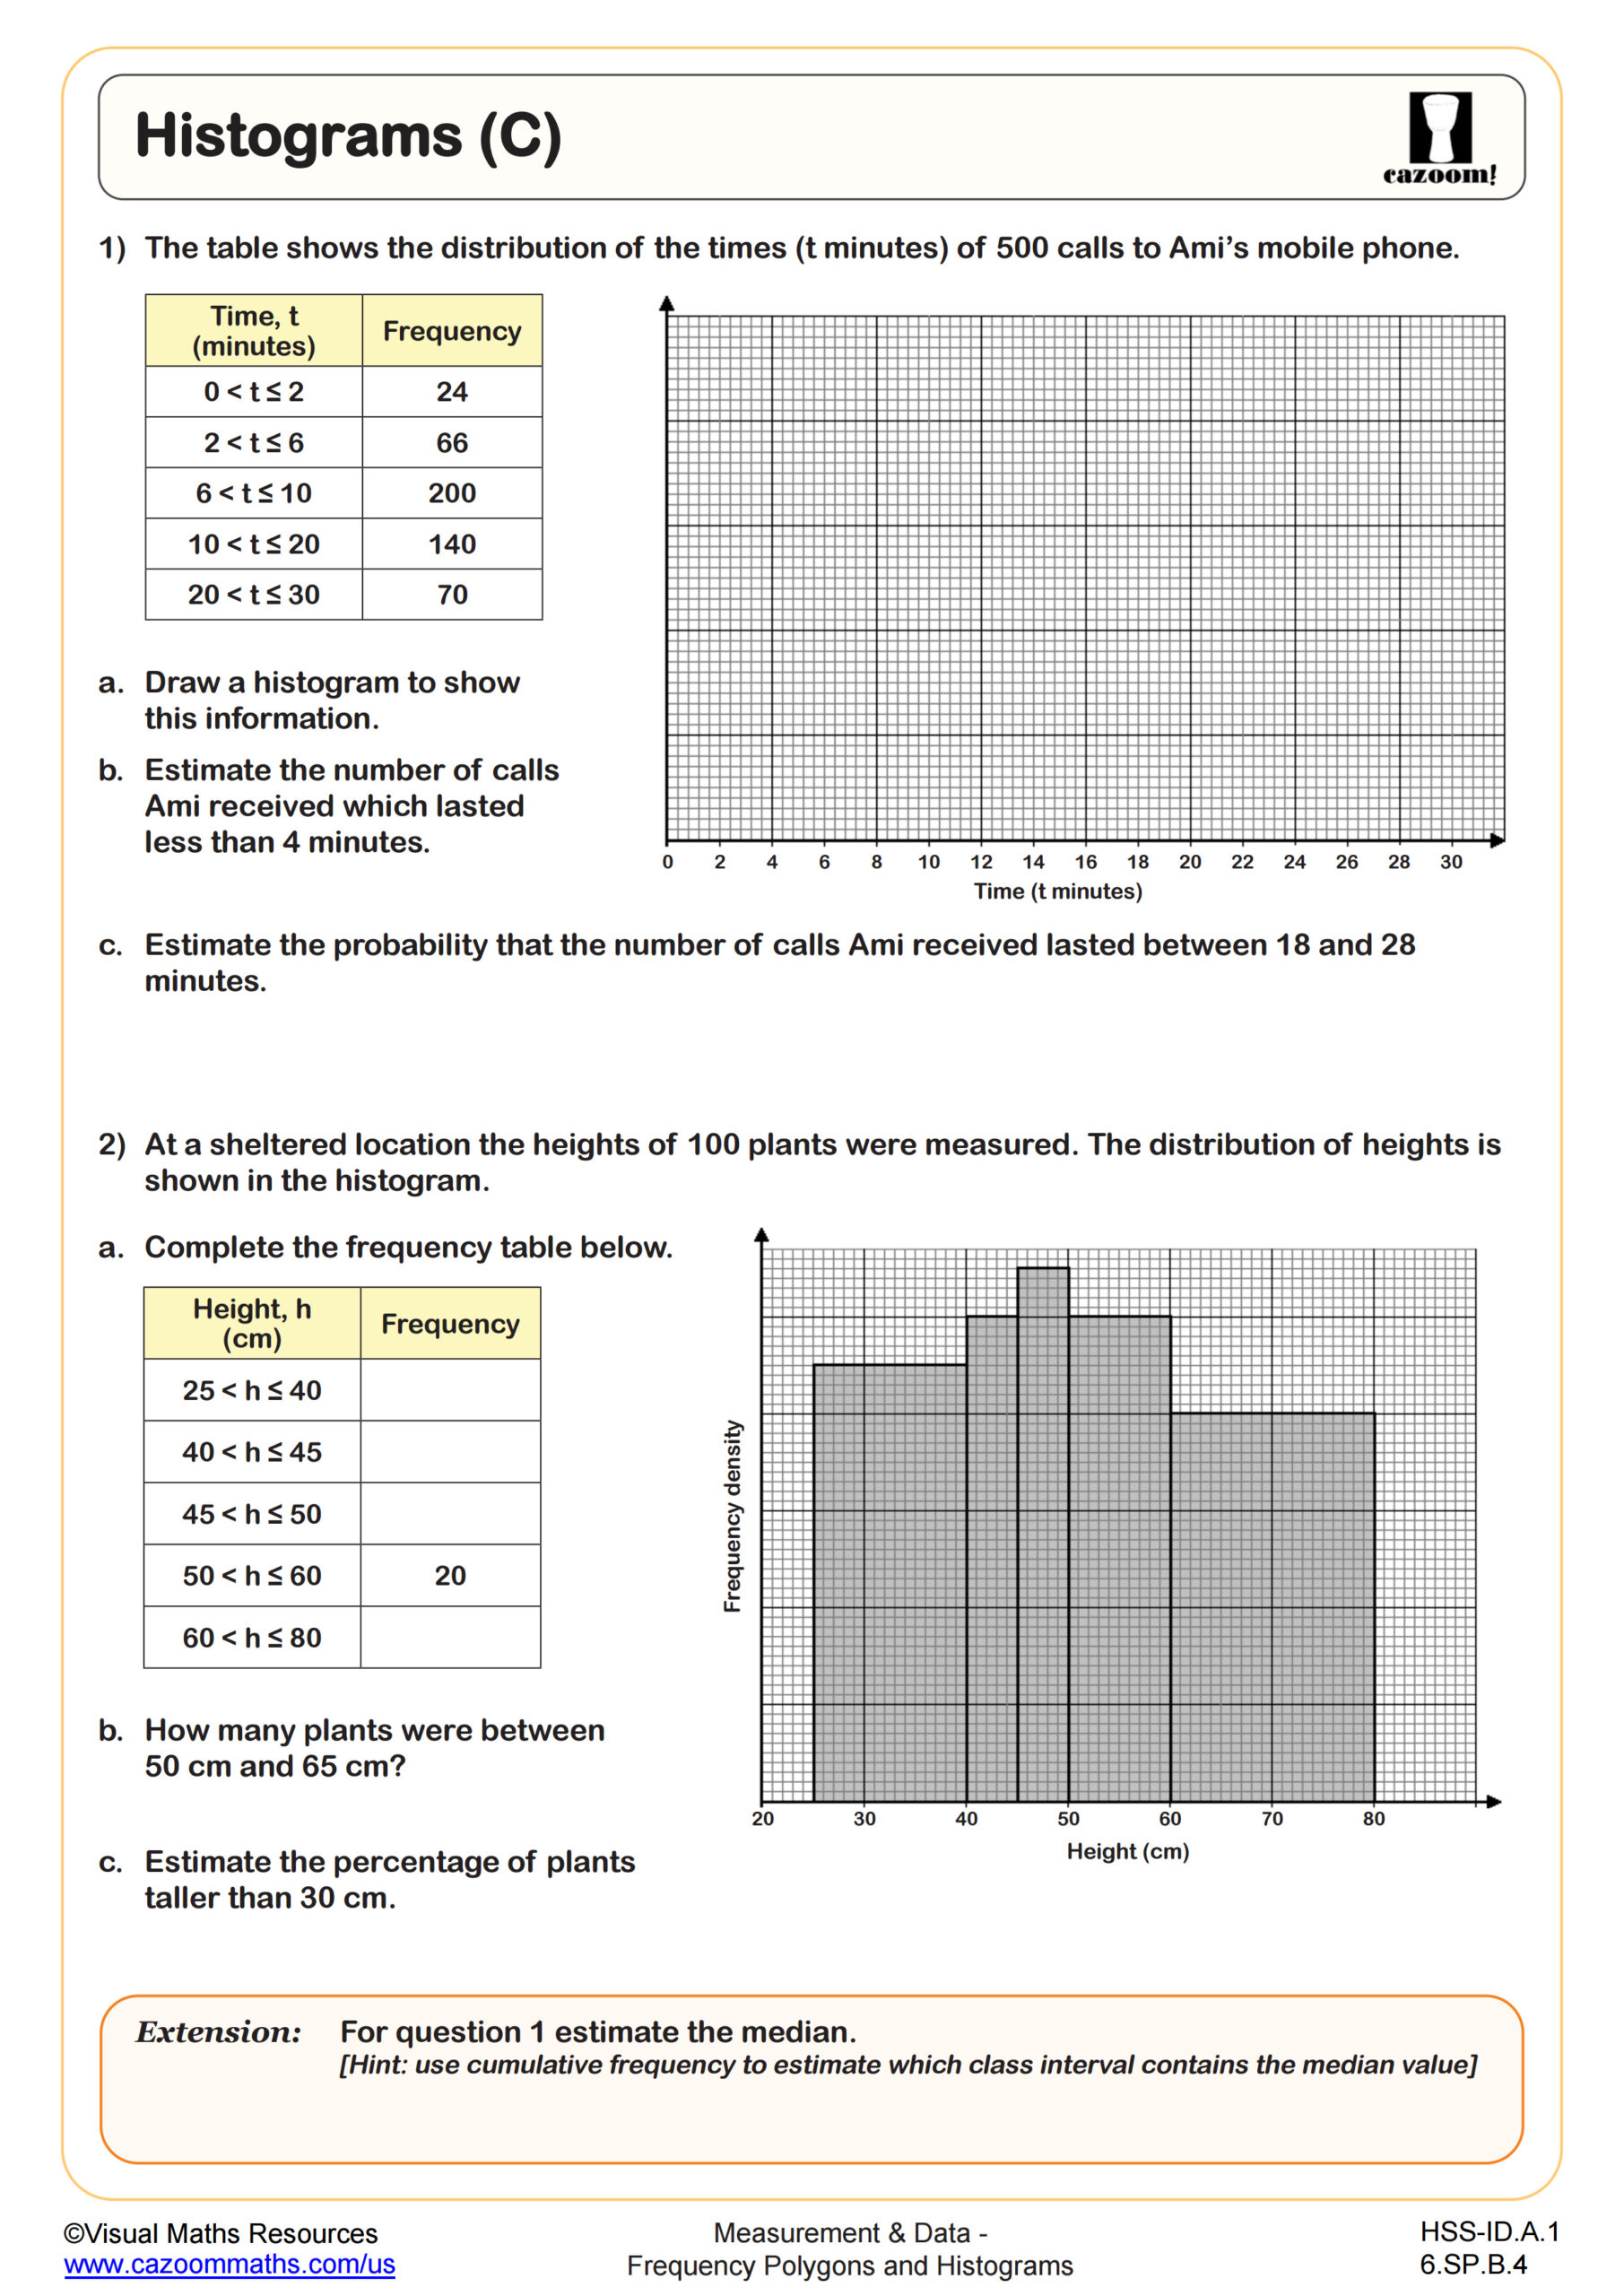
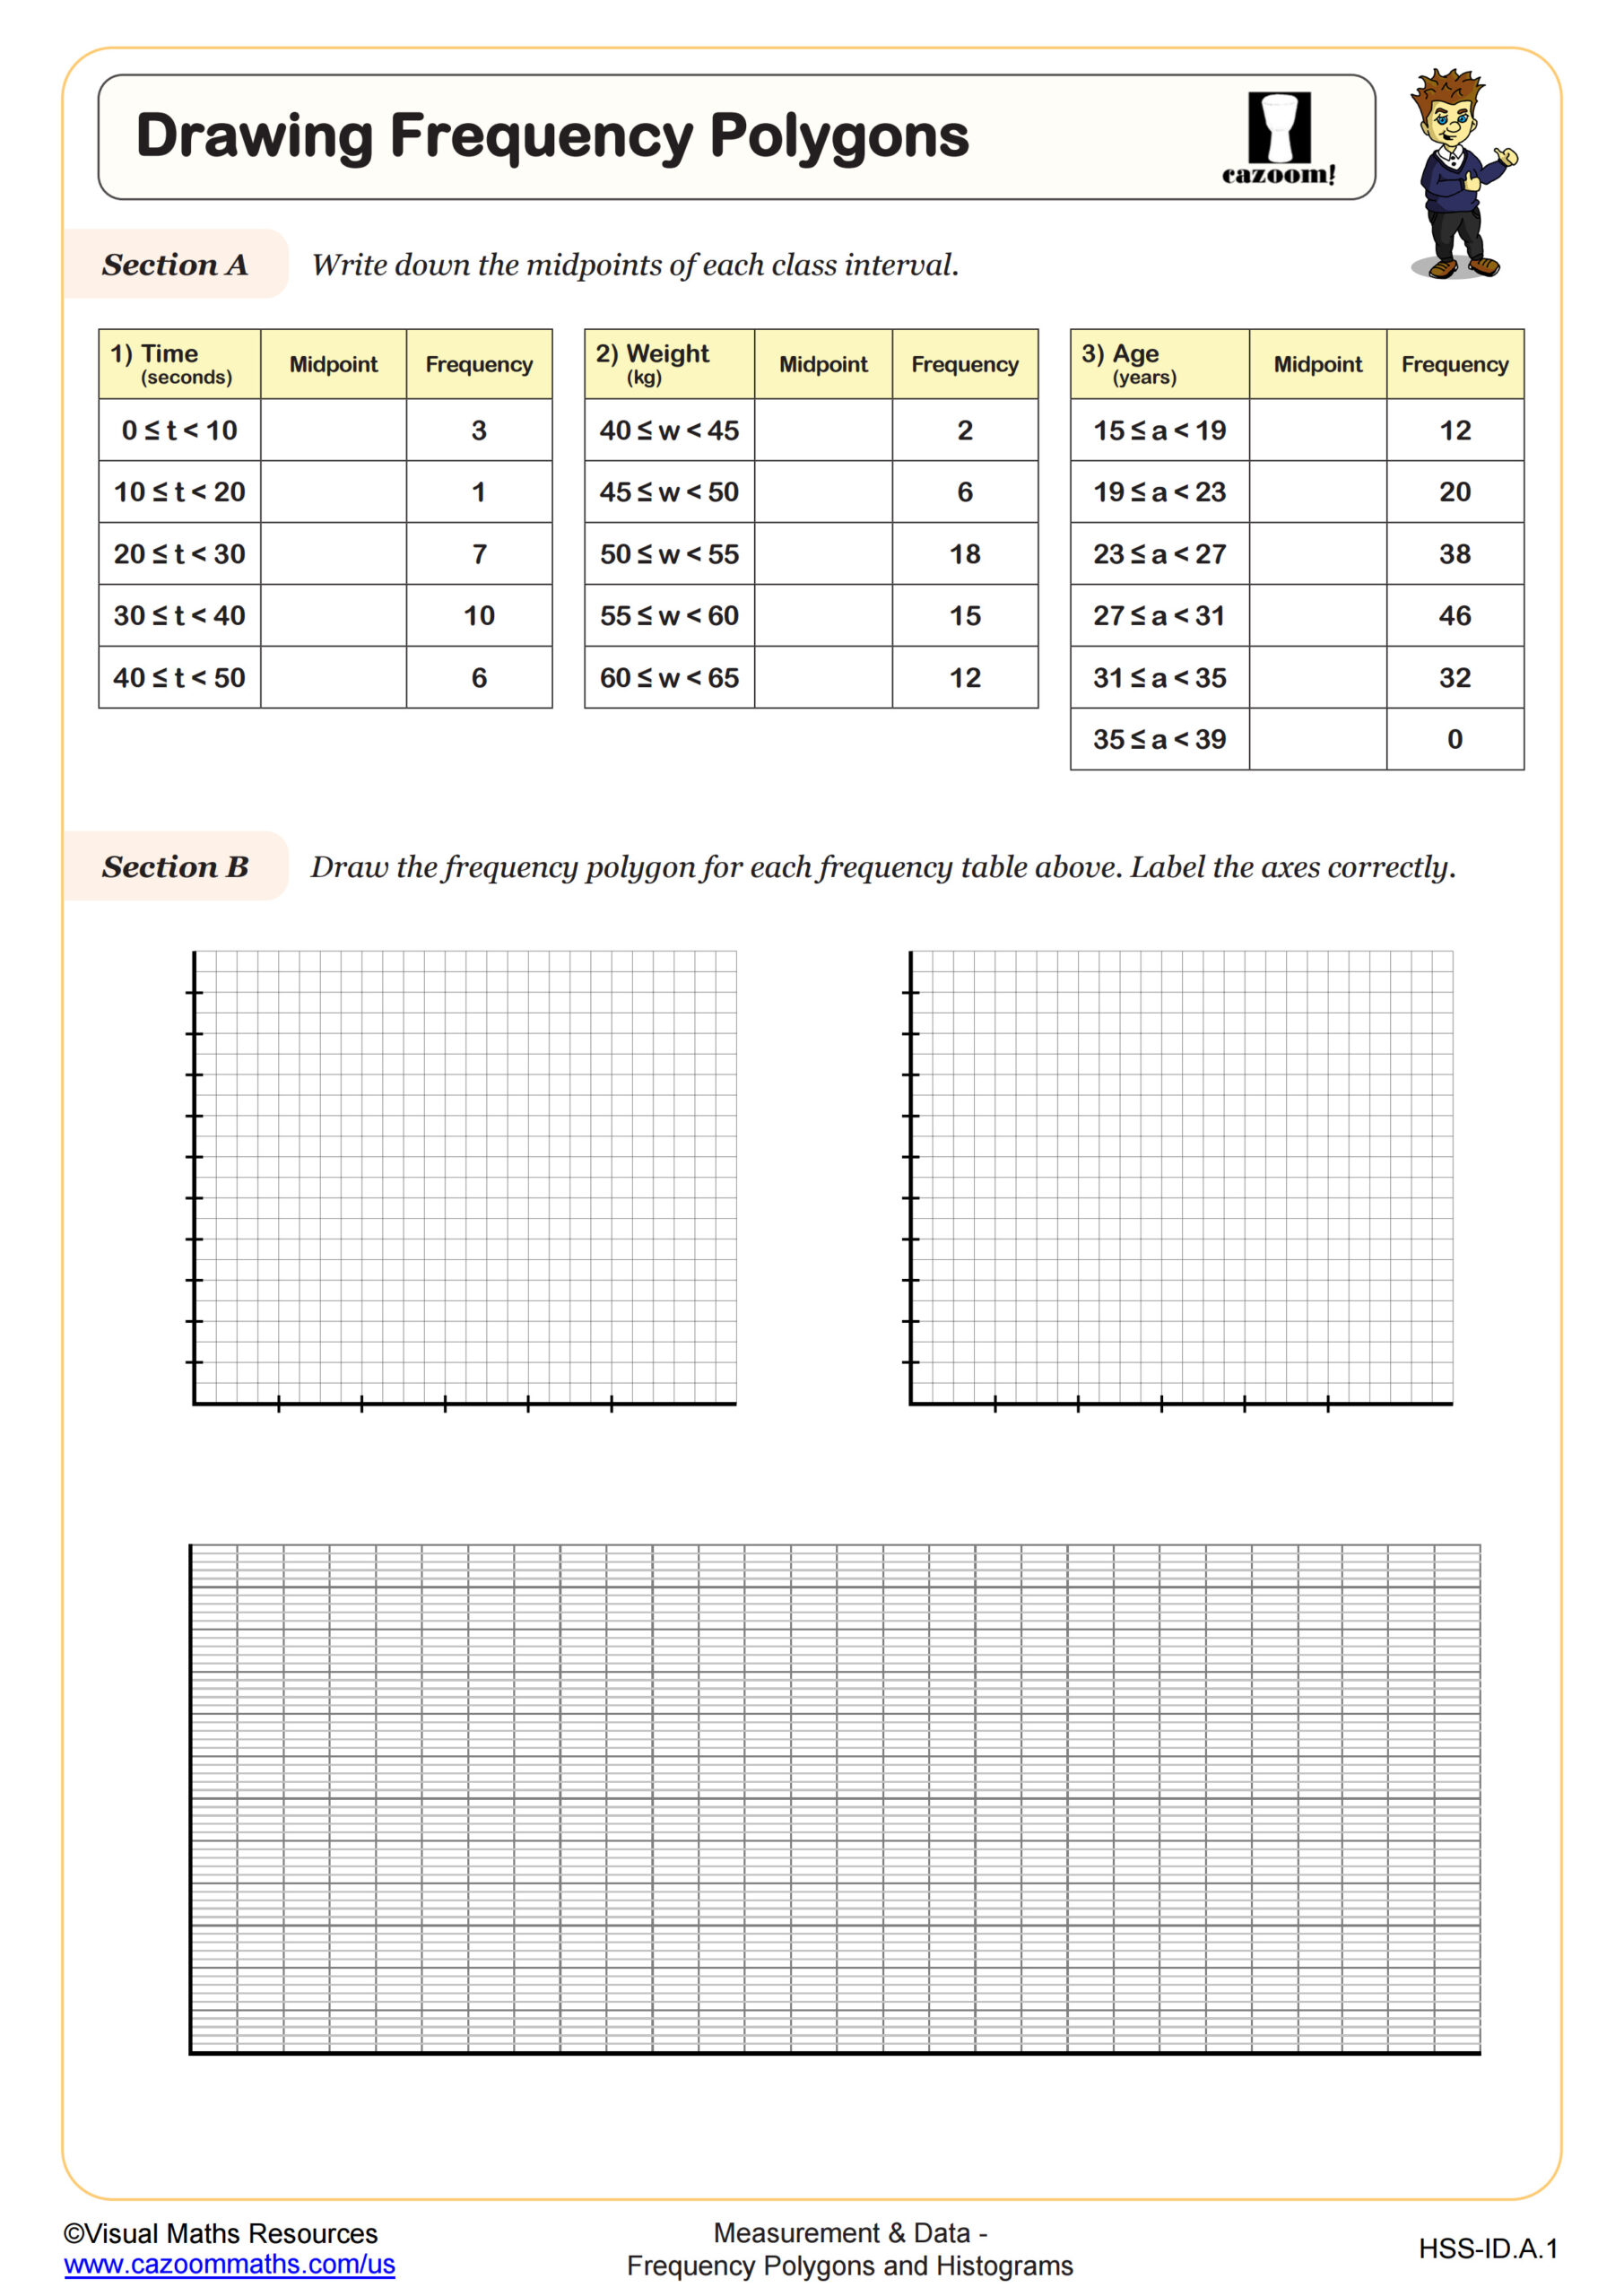
This worksheet provides some practice of drawing and reading histograms from inequal grouped frequency distributions. Section A has two frequency tables with a frequency density column to complete alongside an axes for the histogram. Section B provides completed histograms, but with a table to complete using information about the vertical scale of a frequency.
All worksheets are created by the team of experienced teachers at Cazoom Math.
 Worksheet")
RELATED TO Histograms (B) WORKSHEET
Frequently Asked Questions
This worksheet is designed for both 6th Grade and Algebra I students. The skills of interpreting frequency density and working with unequal class intervals in histograms align well with the data analysis standards at these levels. Students at both grade levels benefit from practice translating between tabular data and visual representations.