Identify Linear and Non Linear Functions WORKSHEET
Describe qualitatively the functional relationship between two quantities by analyzing a graph (e.g., where the function is increasing or decreasing, linear or nonlinear). Sketch a graph that exhibits the qualitative features of a function that has been described verbally.
Identify Linear and Non Linear Functions WORKSHEET DESCRIPTION
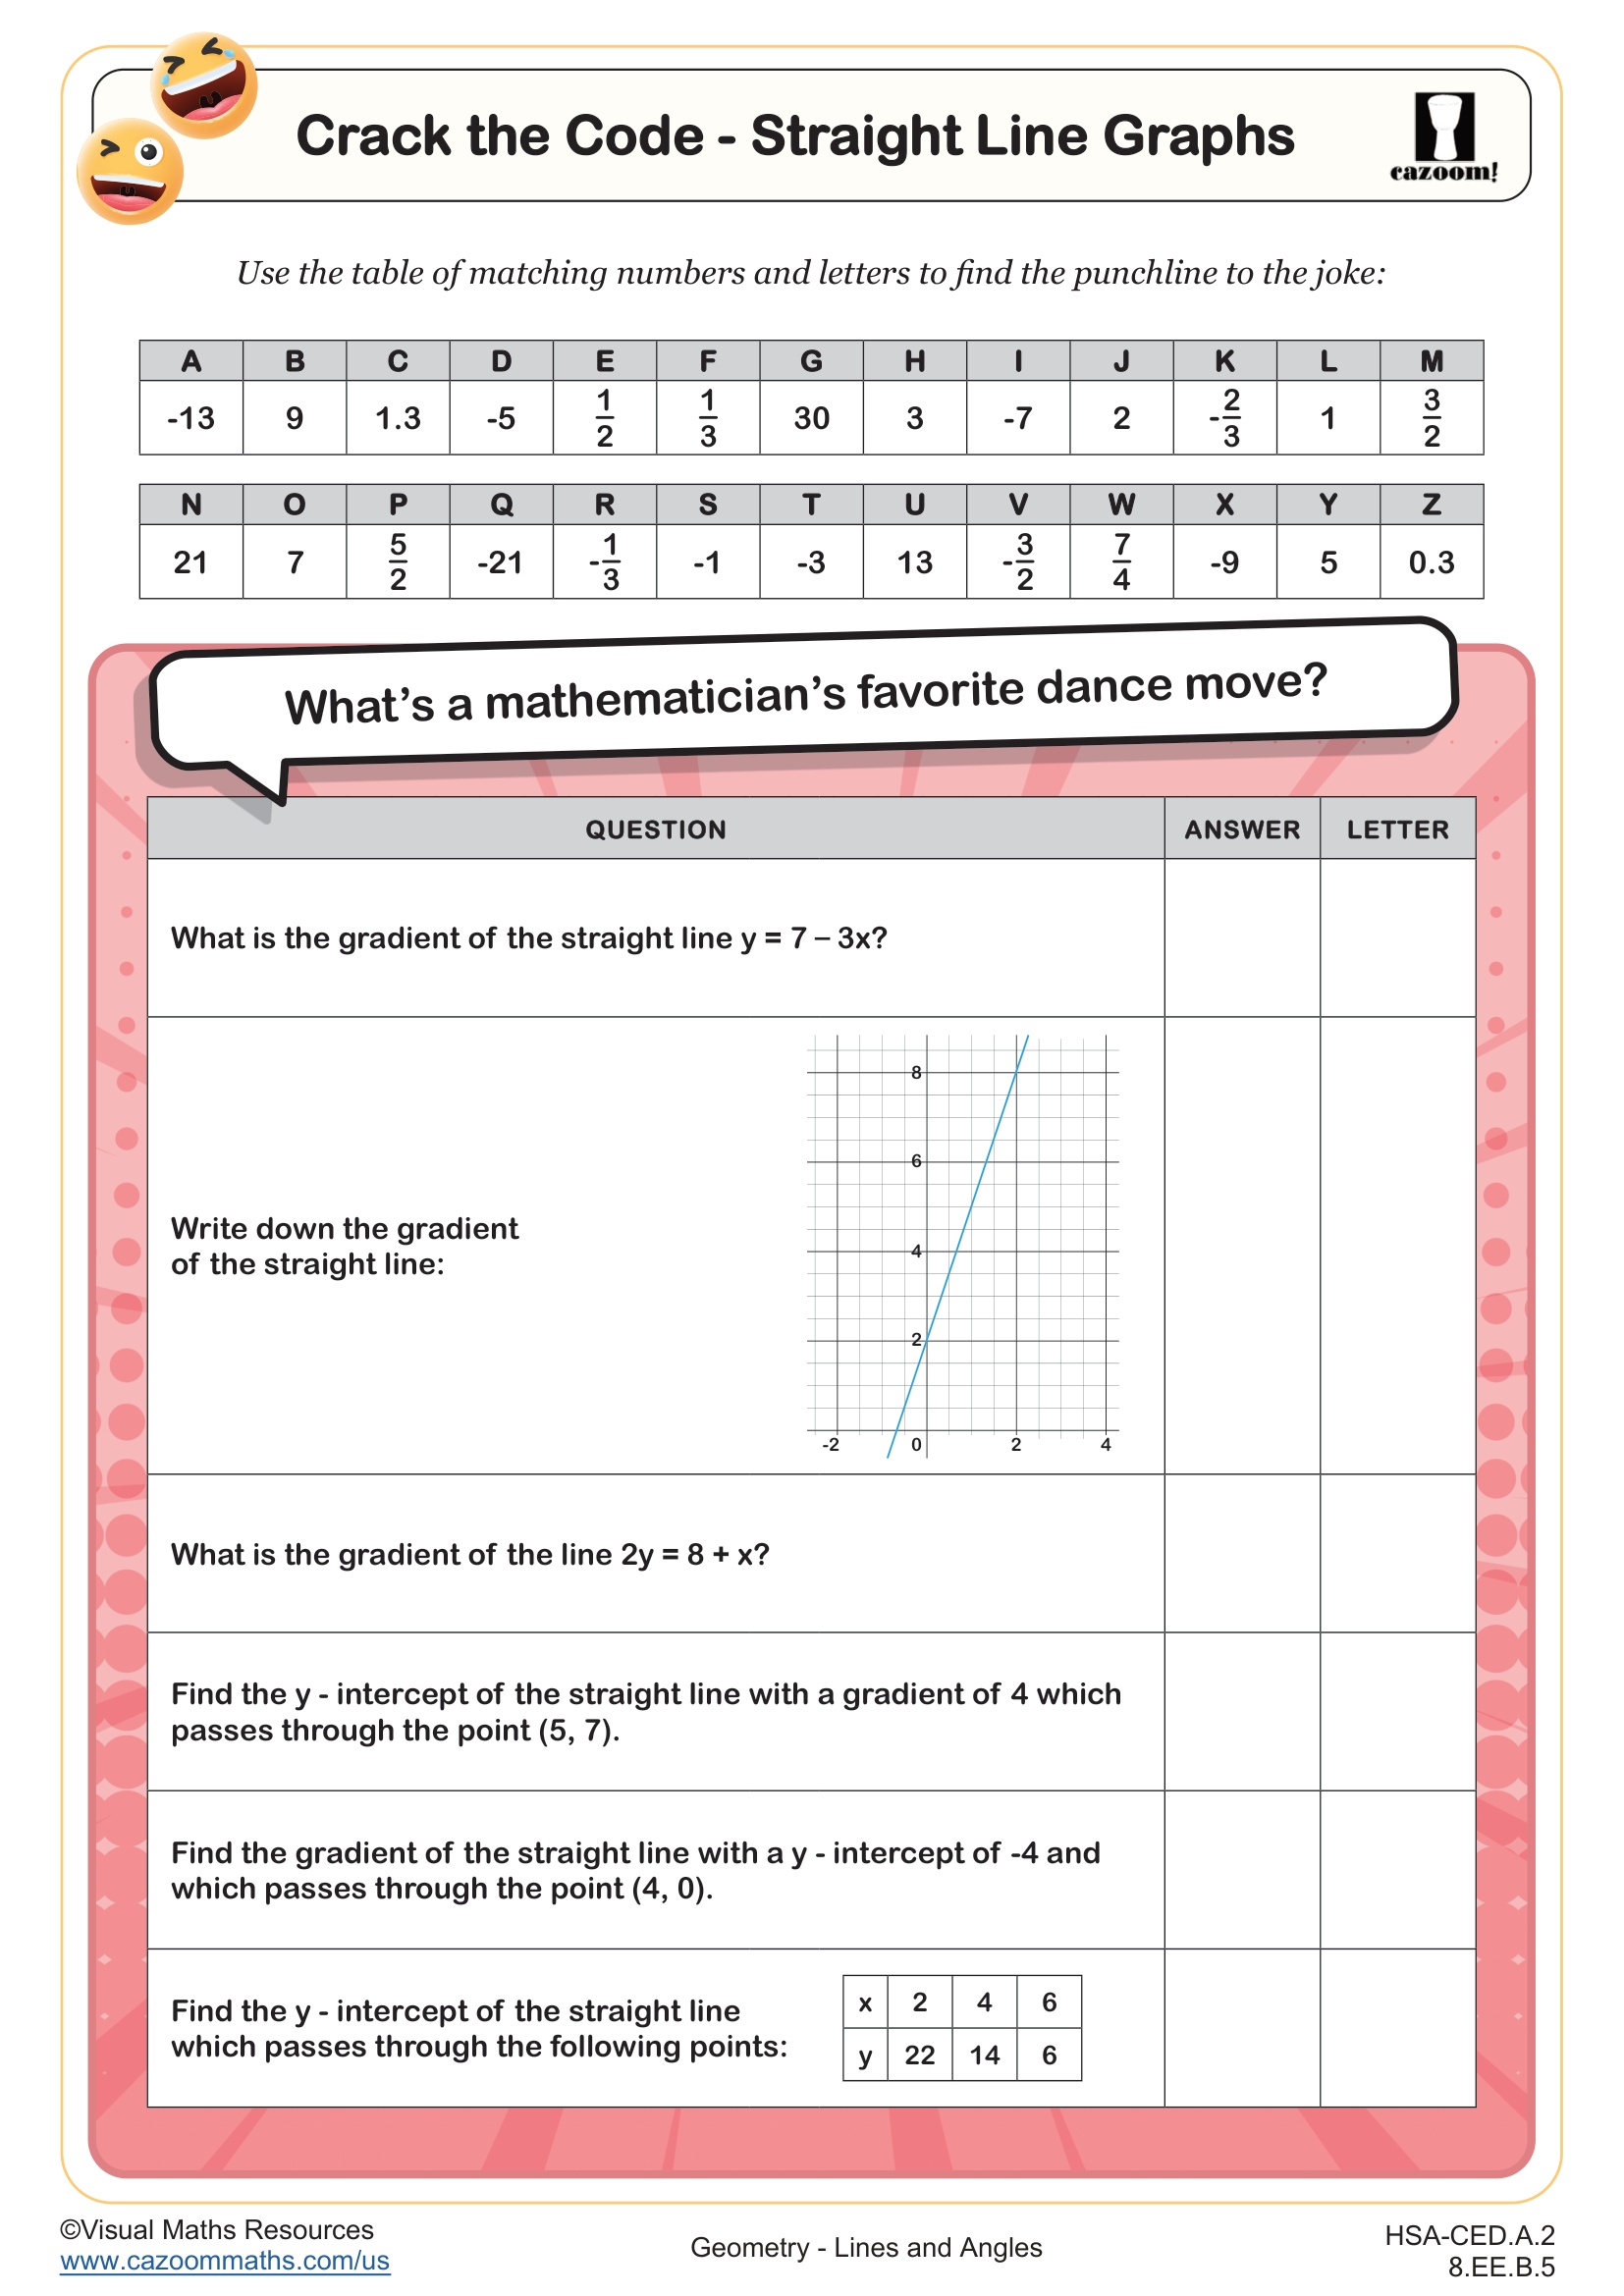
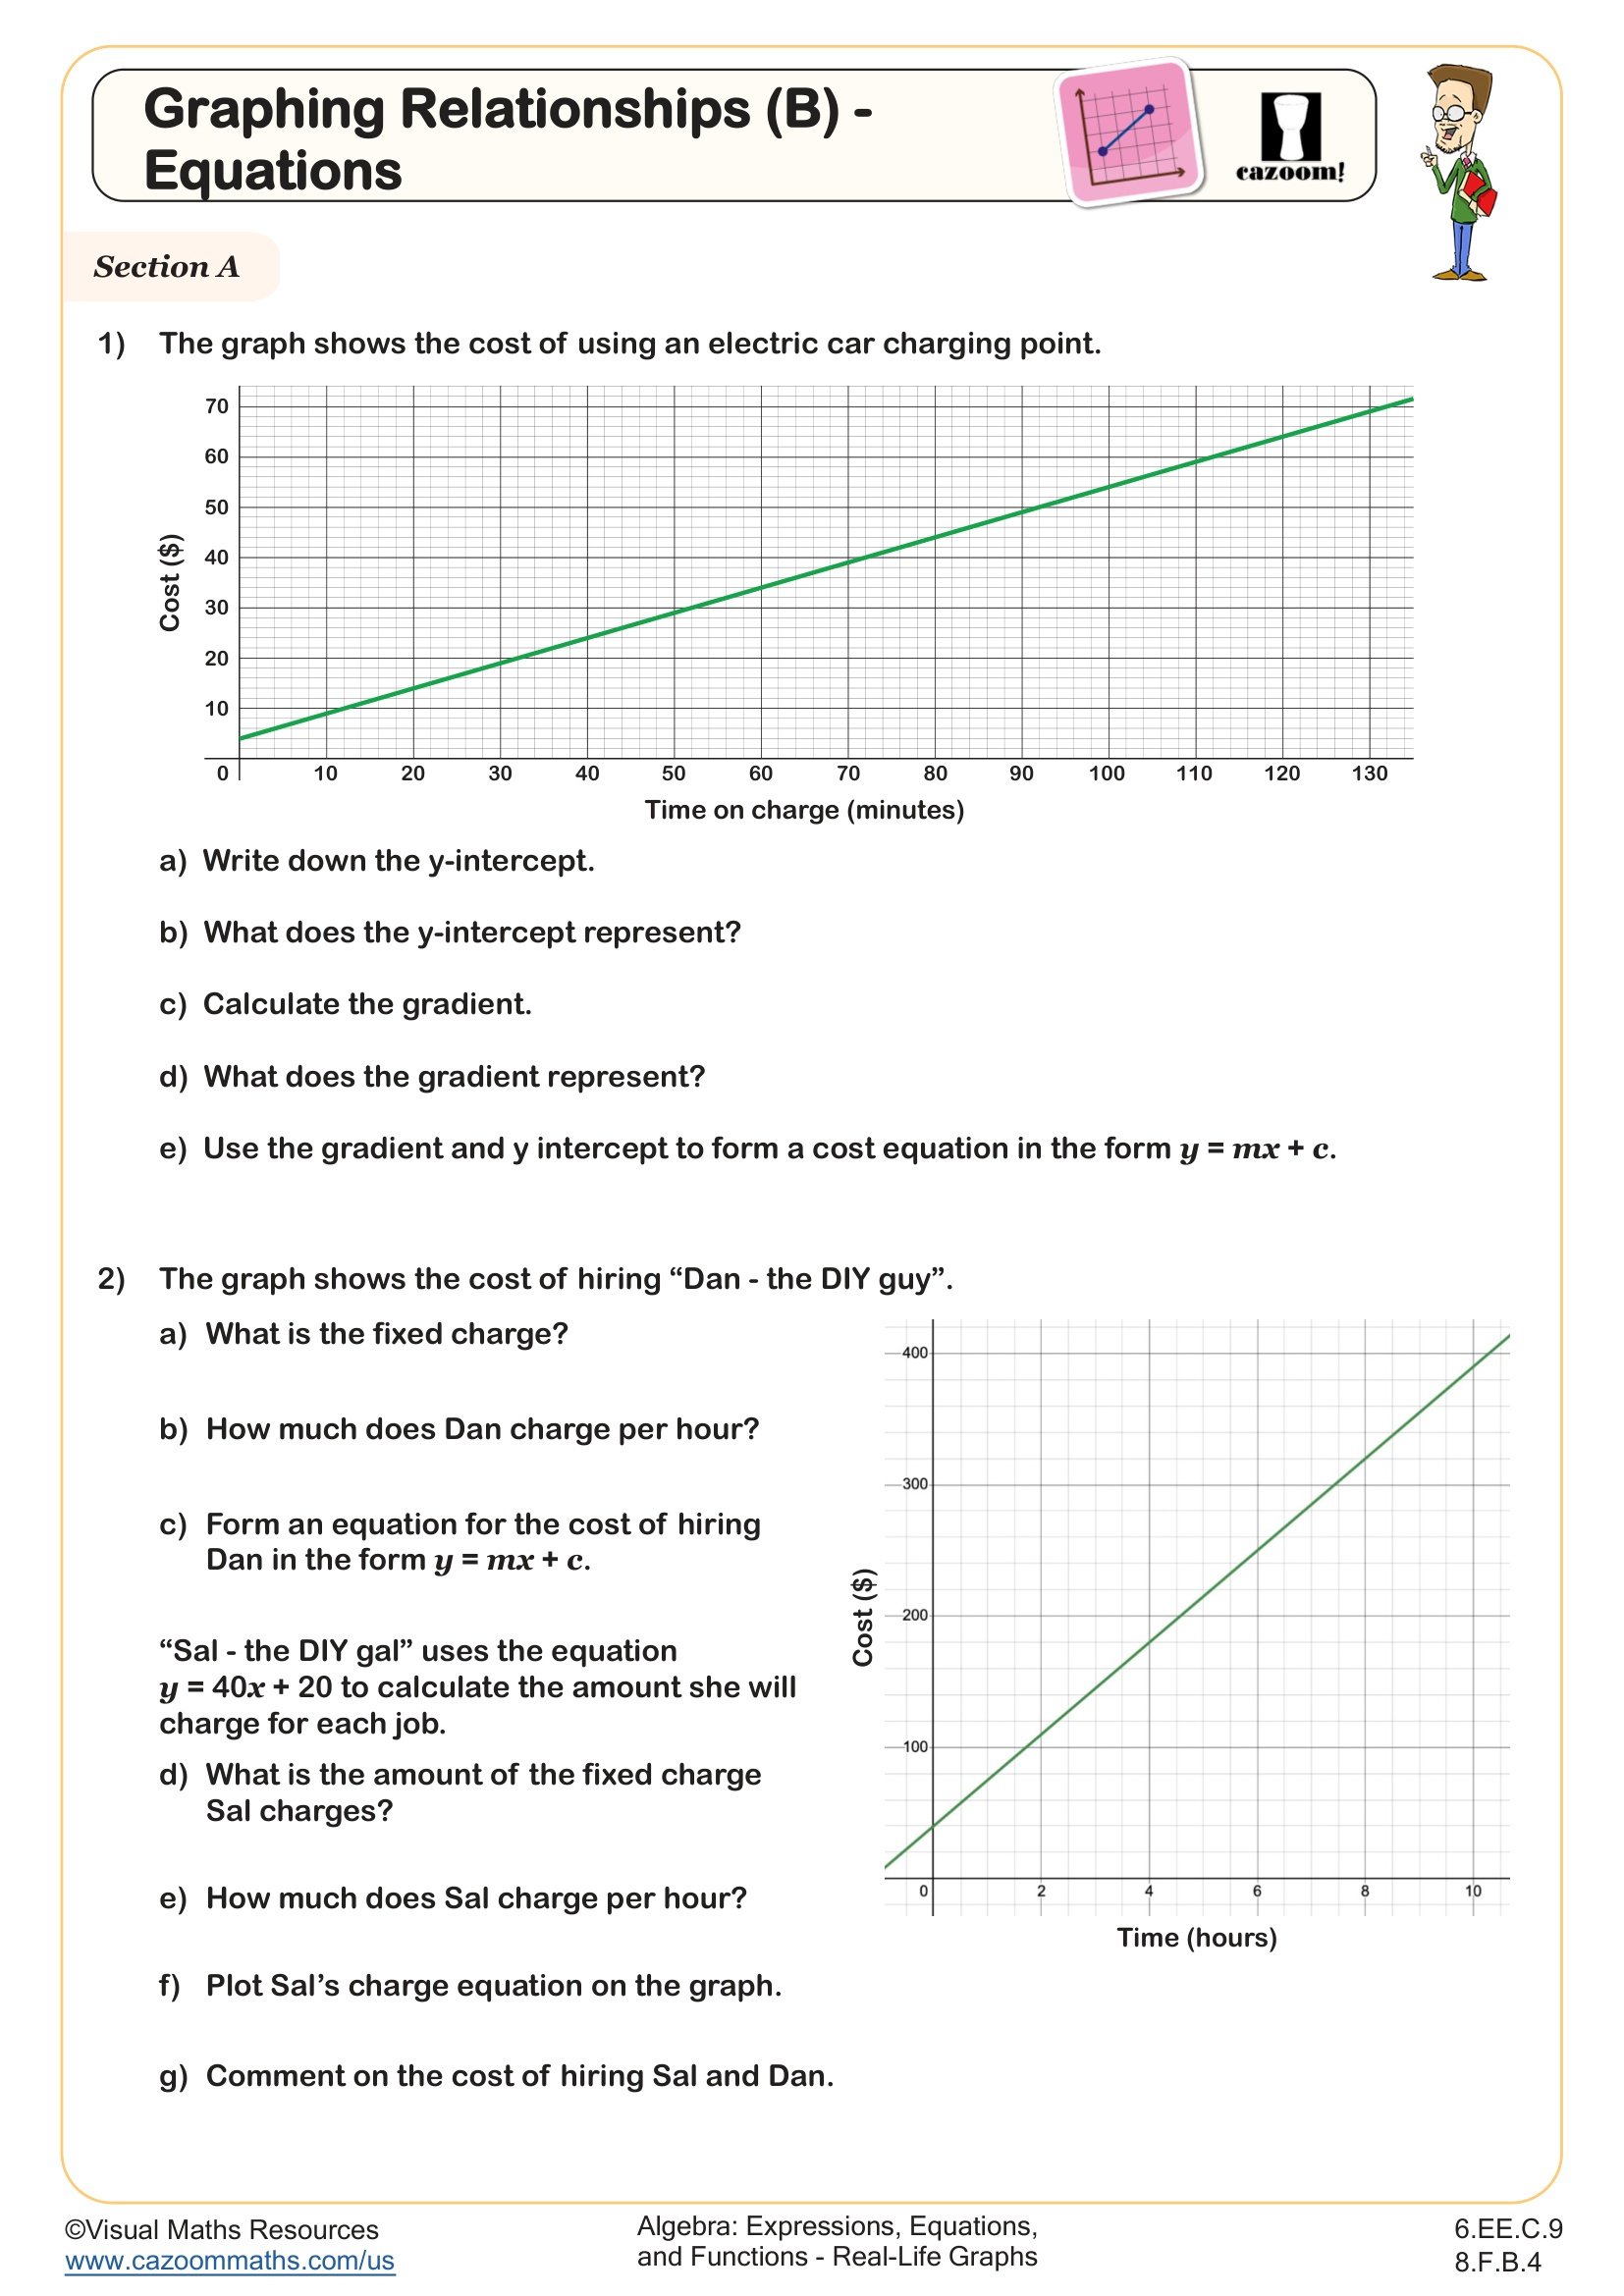
Throughout this worksheet, learners will determine whether functions are linear or nonlinear. In Section A, students will decide whether 9 graphs are linear or not. In Section B students are given 9 equations. Lastly, Section C introduces tables of values where students will analyze how changes in x affect y to determine if the relationship is linear.
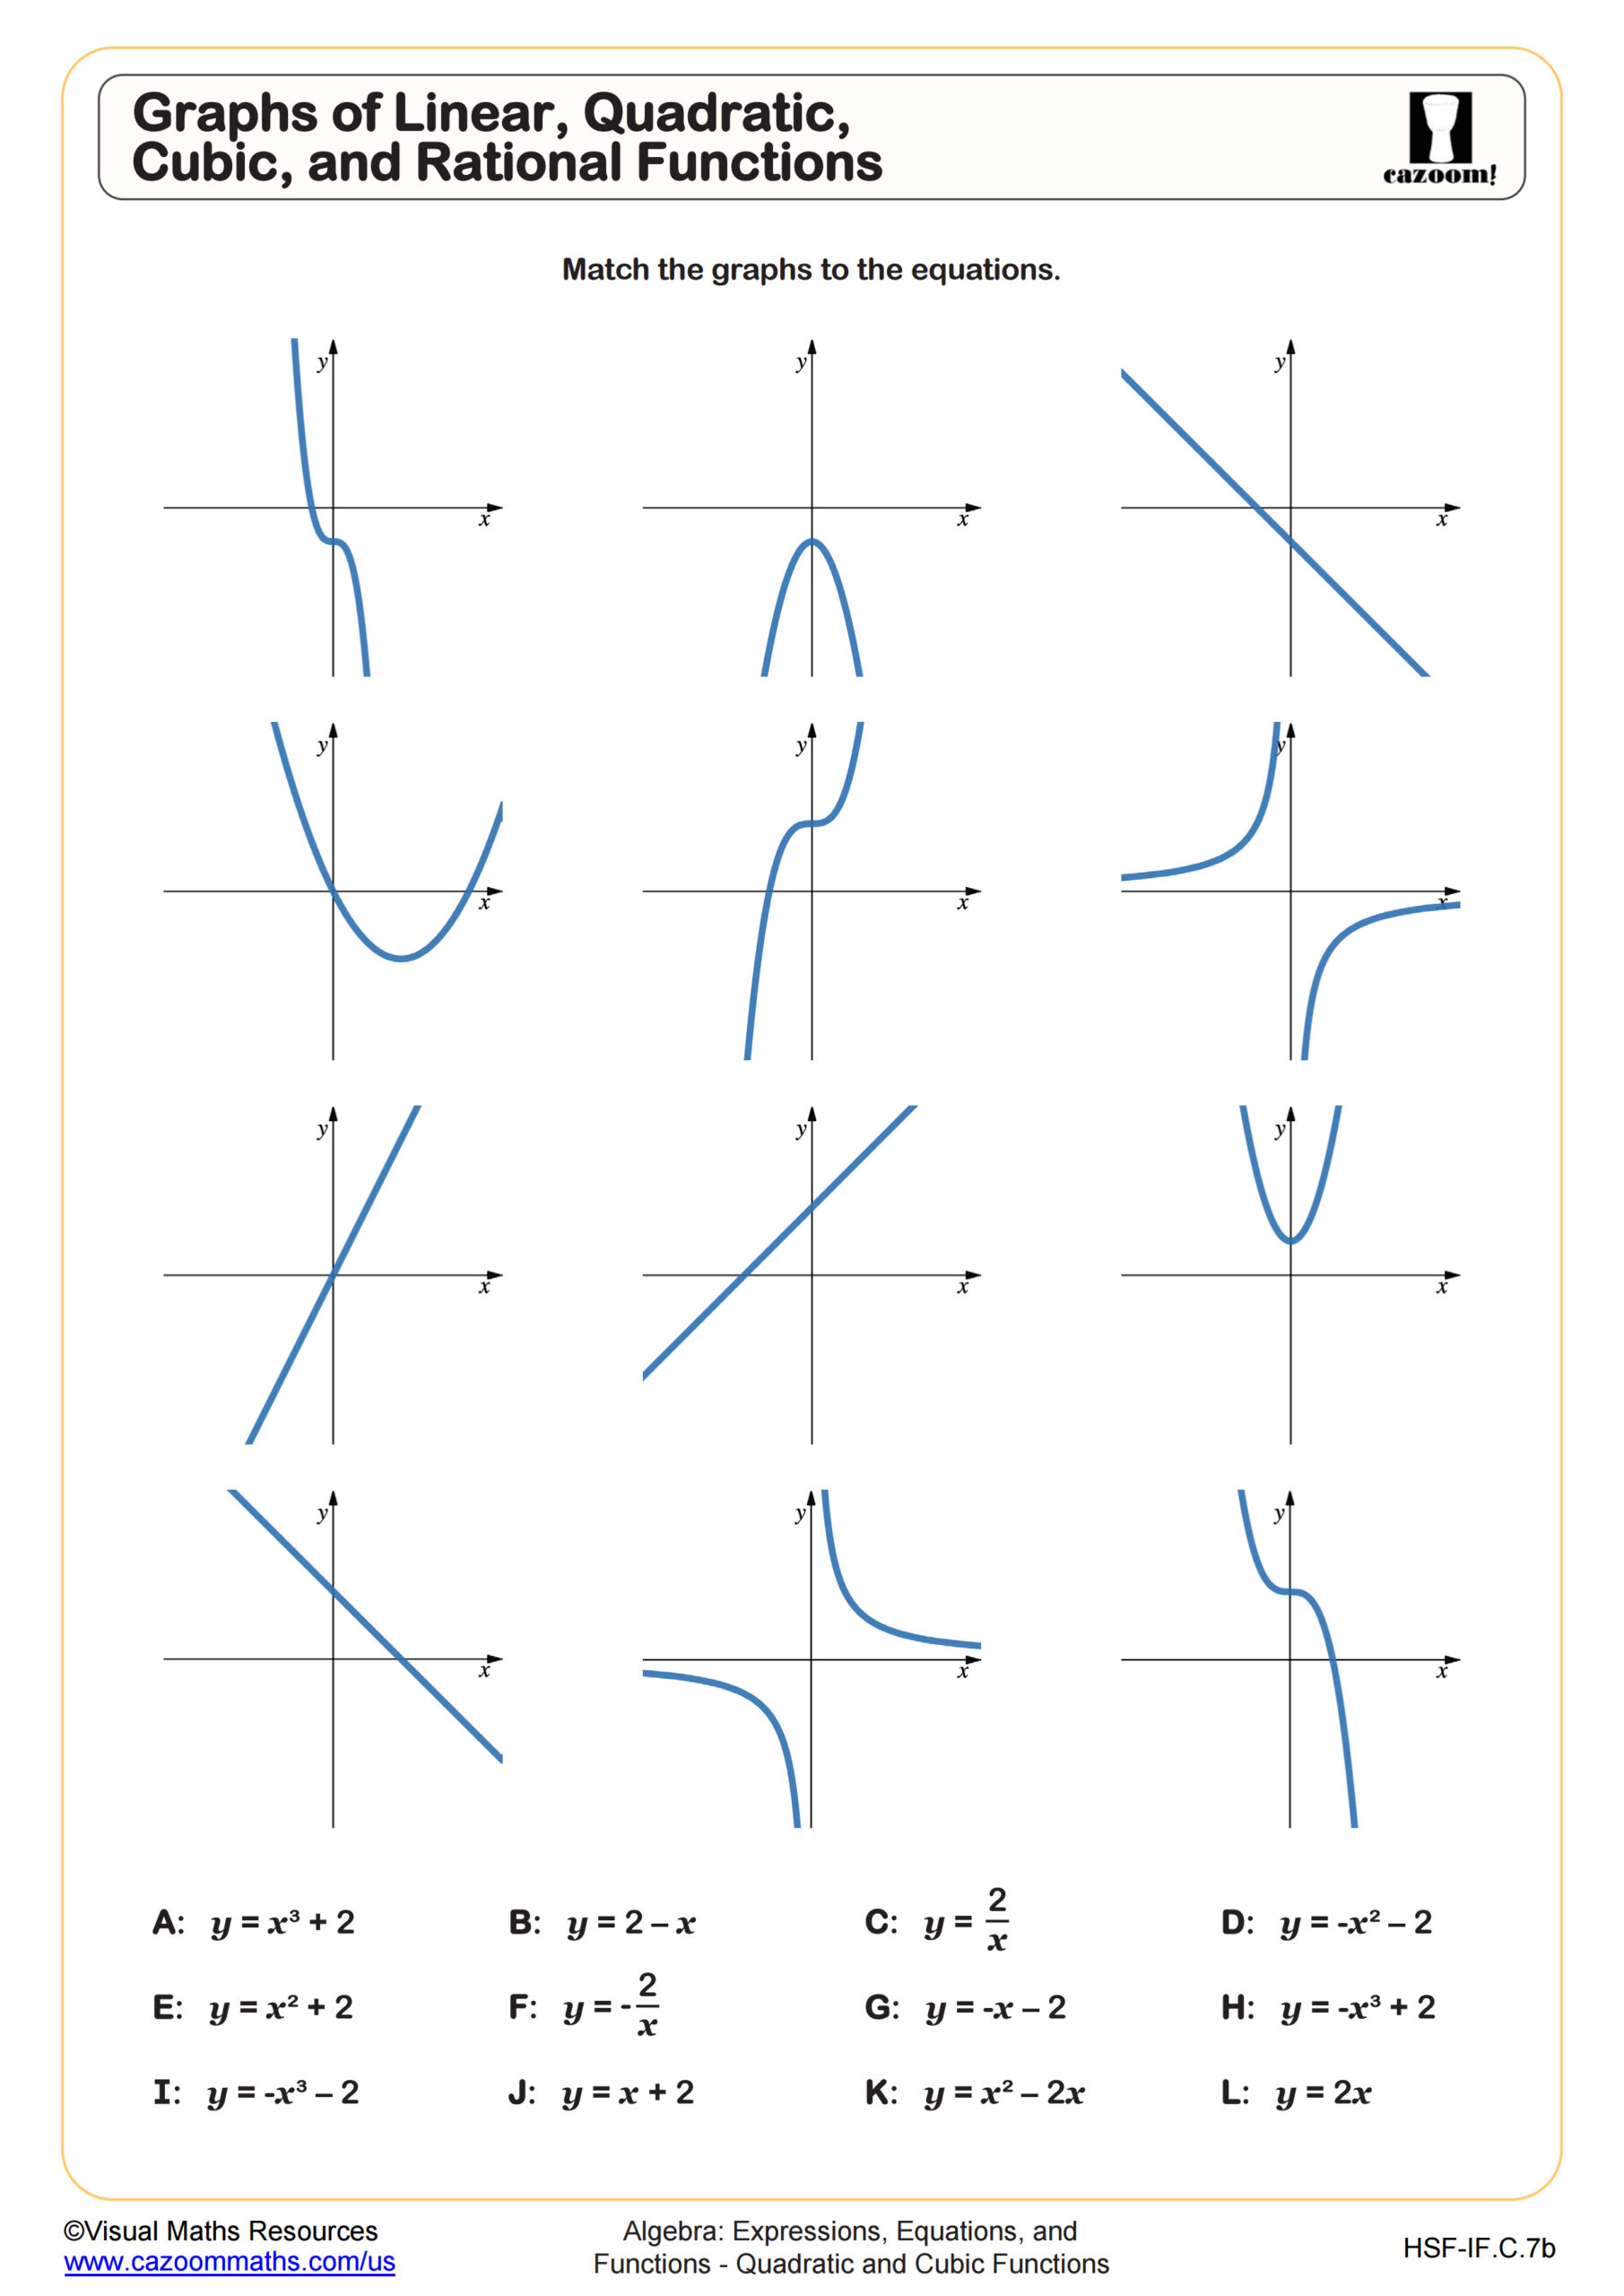
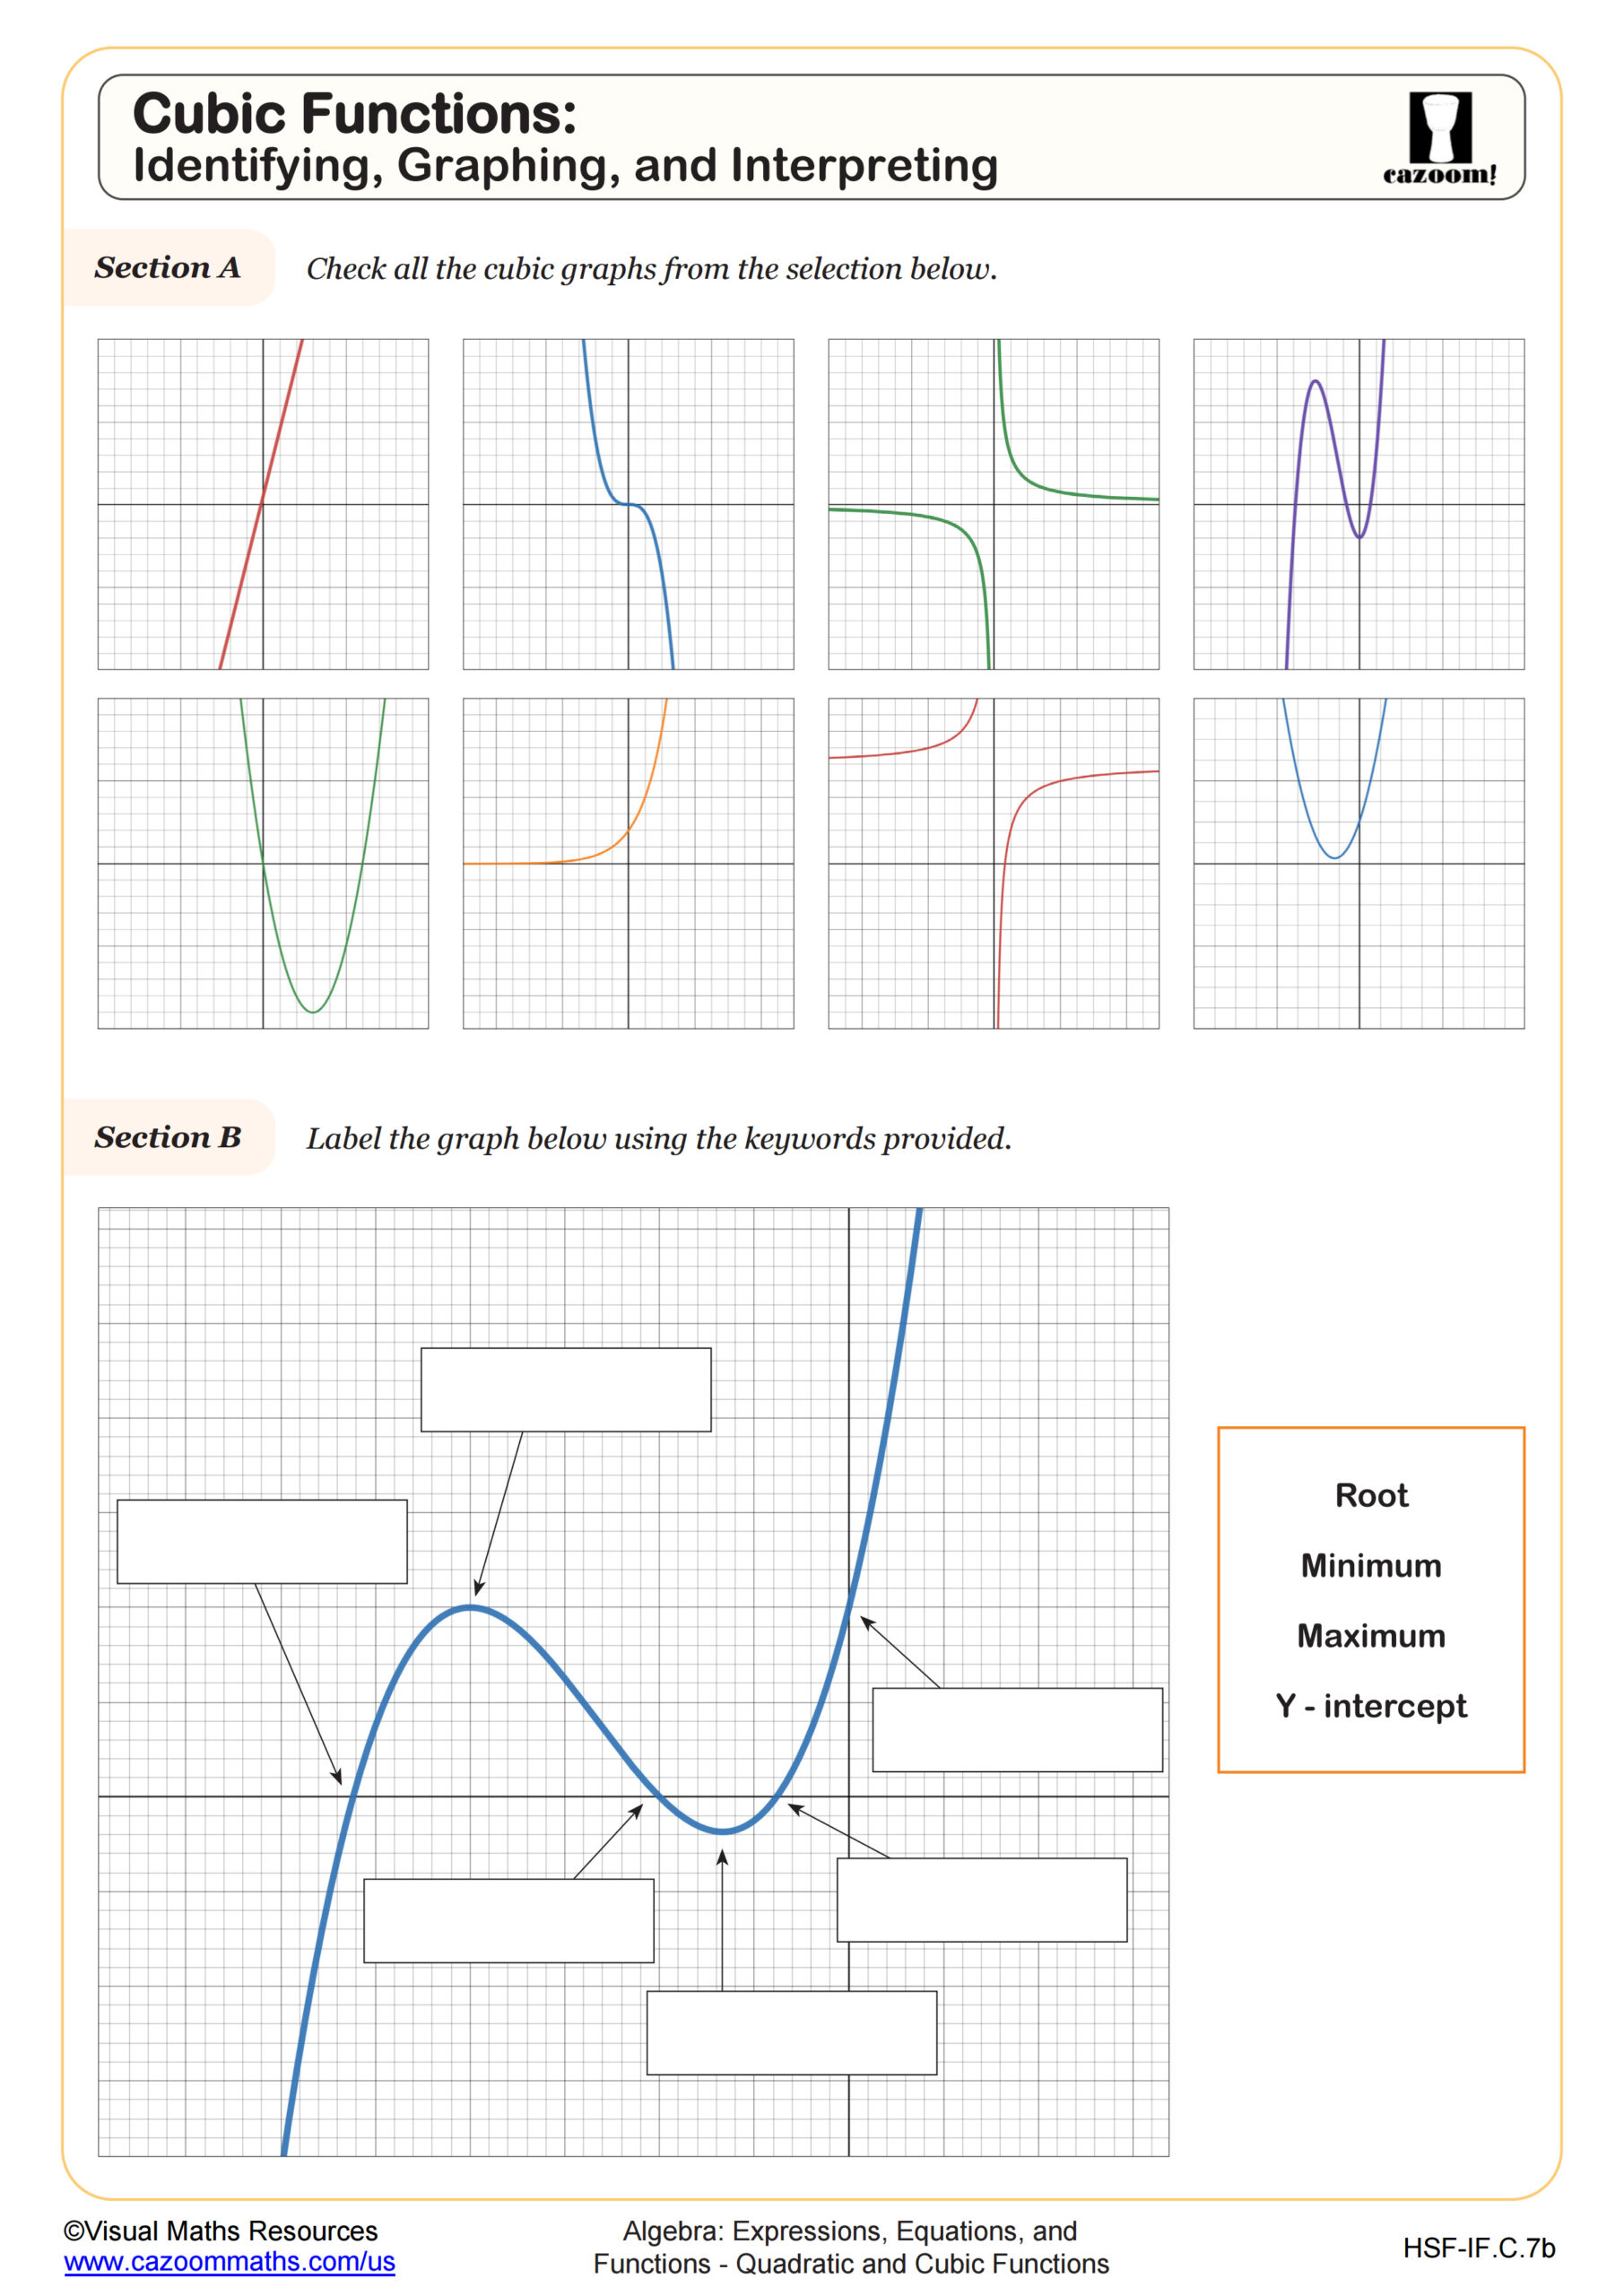
Nonlinear functions include quadratics, cubics, exponential and reciprocal.
See our worksheet “Recognising Cubics, Quadratics, Reciprocals and Straight Line Graphs” for more on this topic.
All worksheets are created by the team of experienced teachers at Cazoom Math.

RELATED TO Identify Linear and Non Linear Functions WORKSHEET
Frequently Asked Questions
This worksheet is specifically designed for 8th grade students who are learning about linear functions. At this grade level, students are building foundational skills in analyzing different types of functions and understanding how to distinguish between linear and nonlinear relationships.