Back to:
Interpreting Speed-Time Graphs WORKSHEET
Suitable for Grades: 8th Grade
CCSS: 8.F.B.5
CCSS Description: Describe qualitatively the functional relationship between two quantities by analyzing a graph (e.g., where the function is increasing or decreasing, linear or nonlinear). Sketch a graph that exhibits the qualitative features of a function that has been described verbally.
Interpreting Speed-Time Graphs WORKSHEET DESCRIPTION
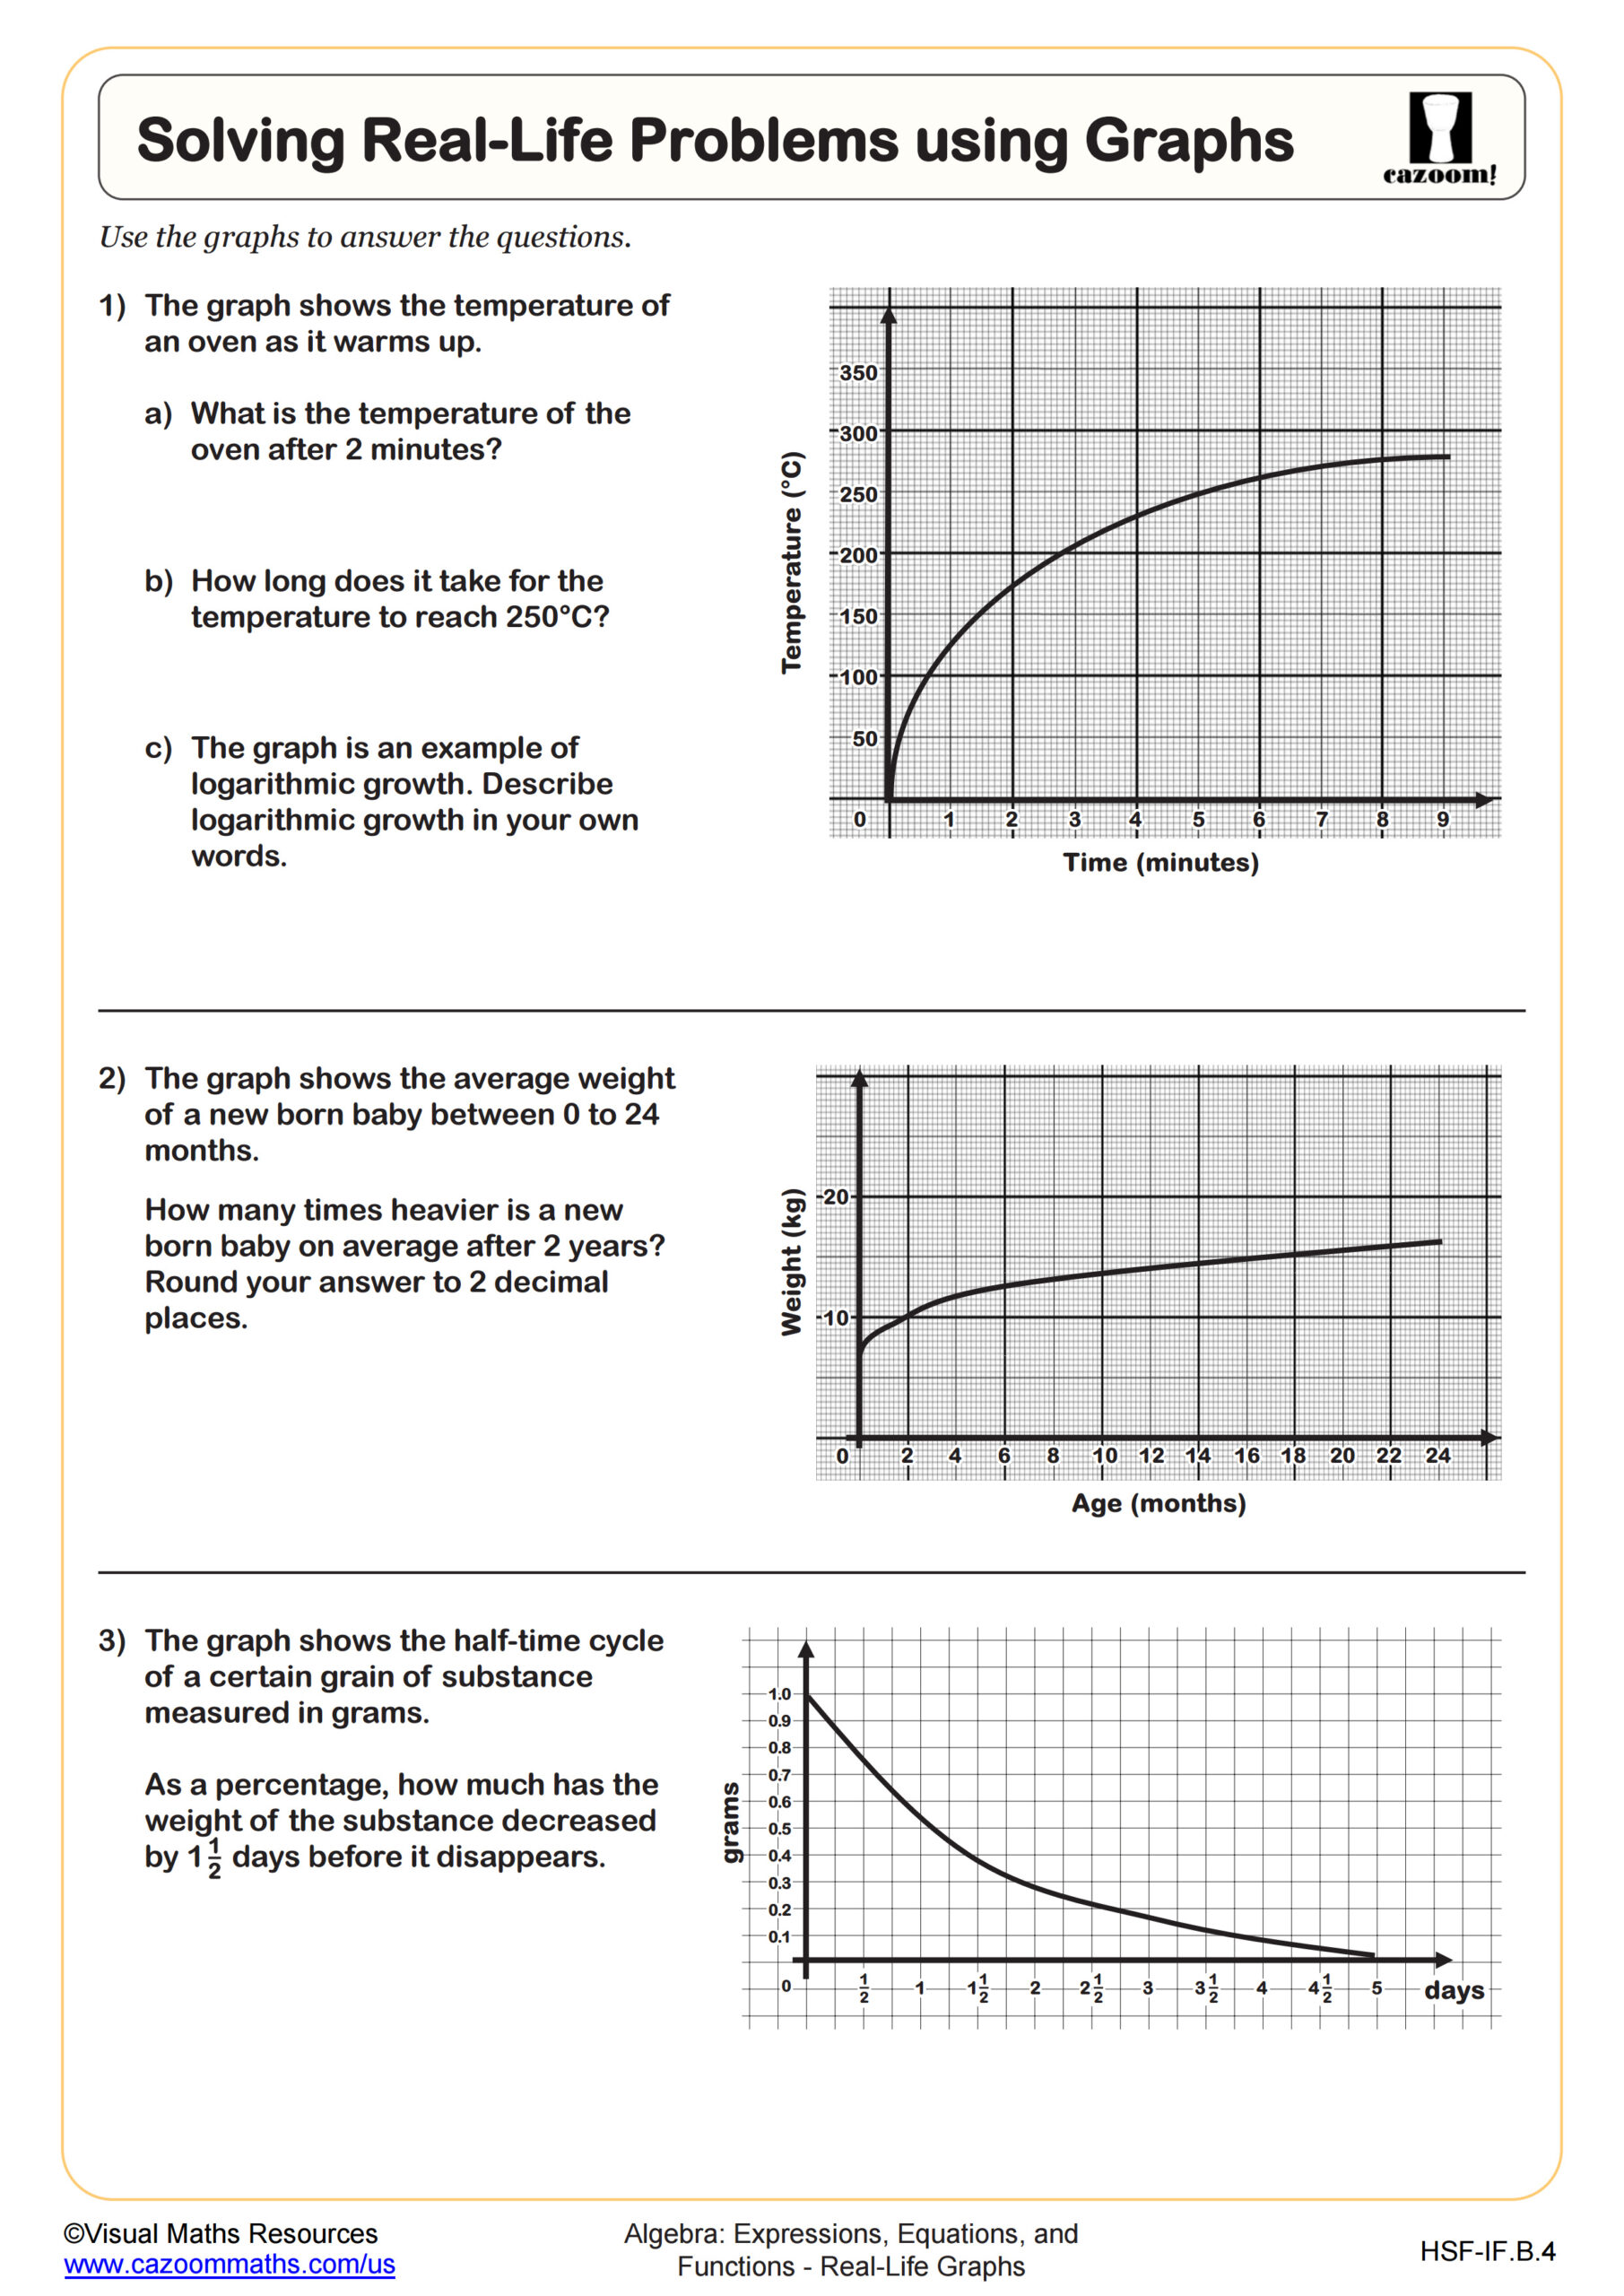
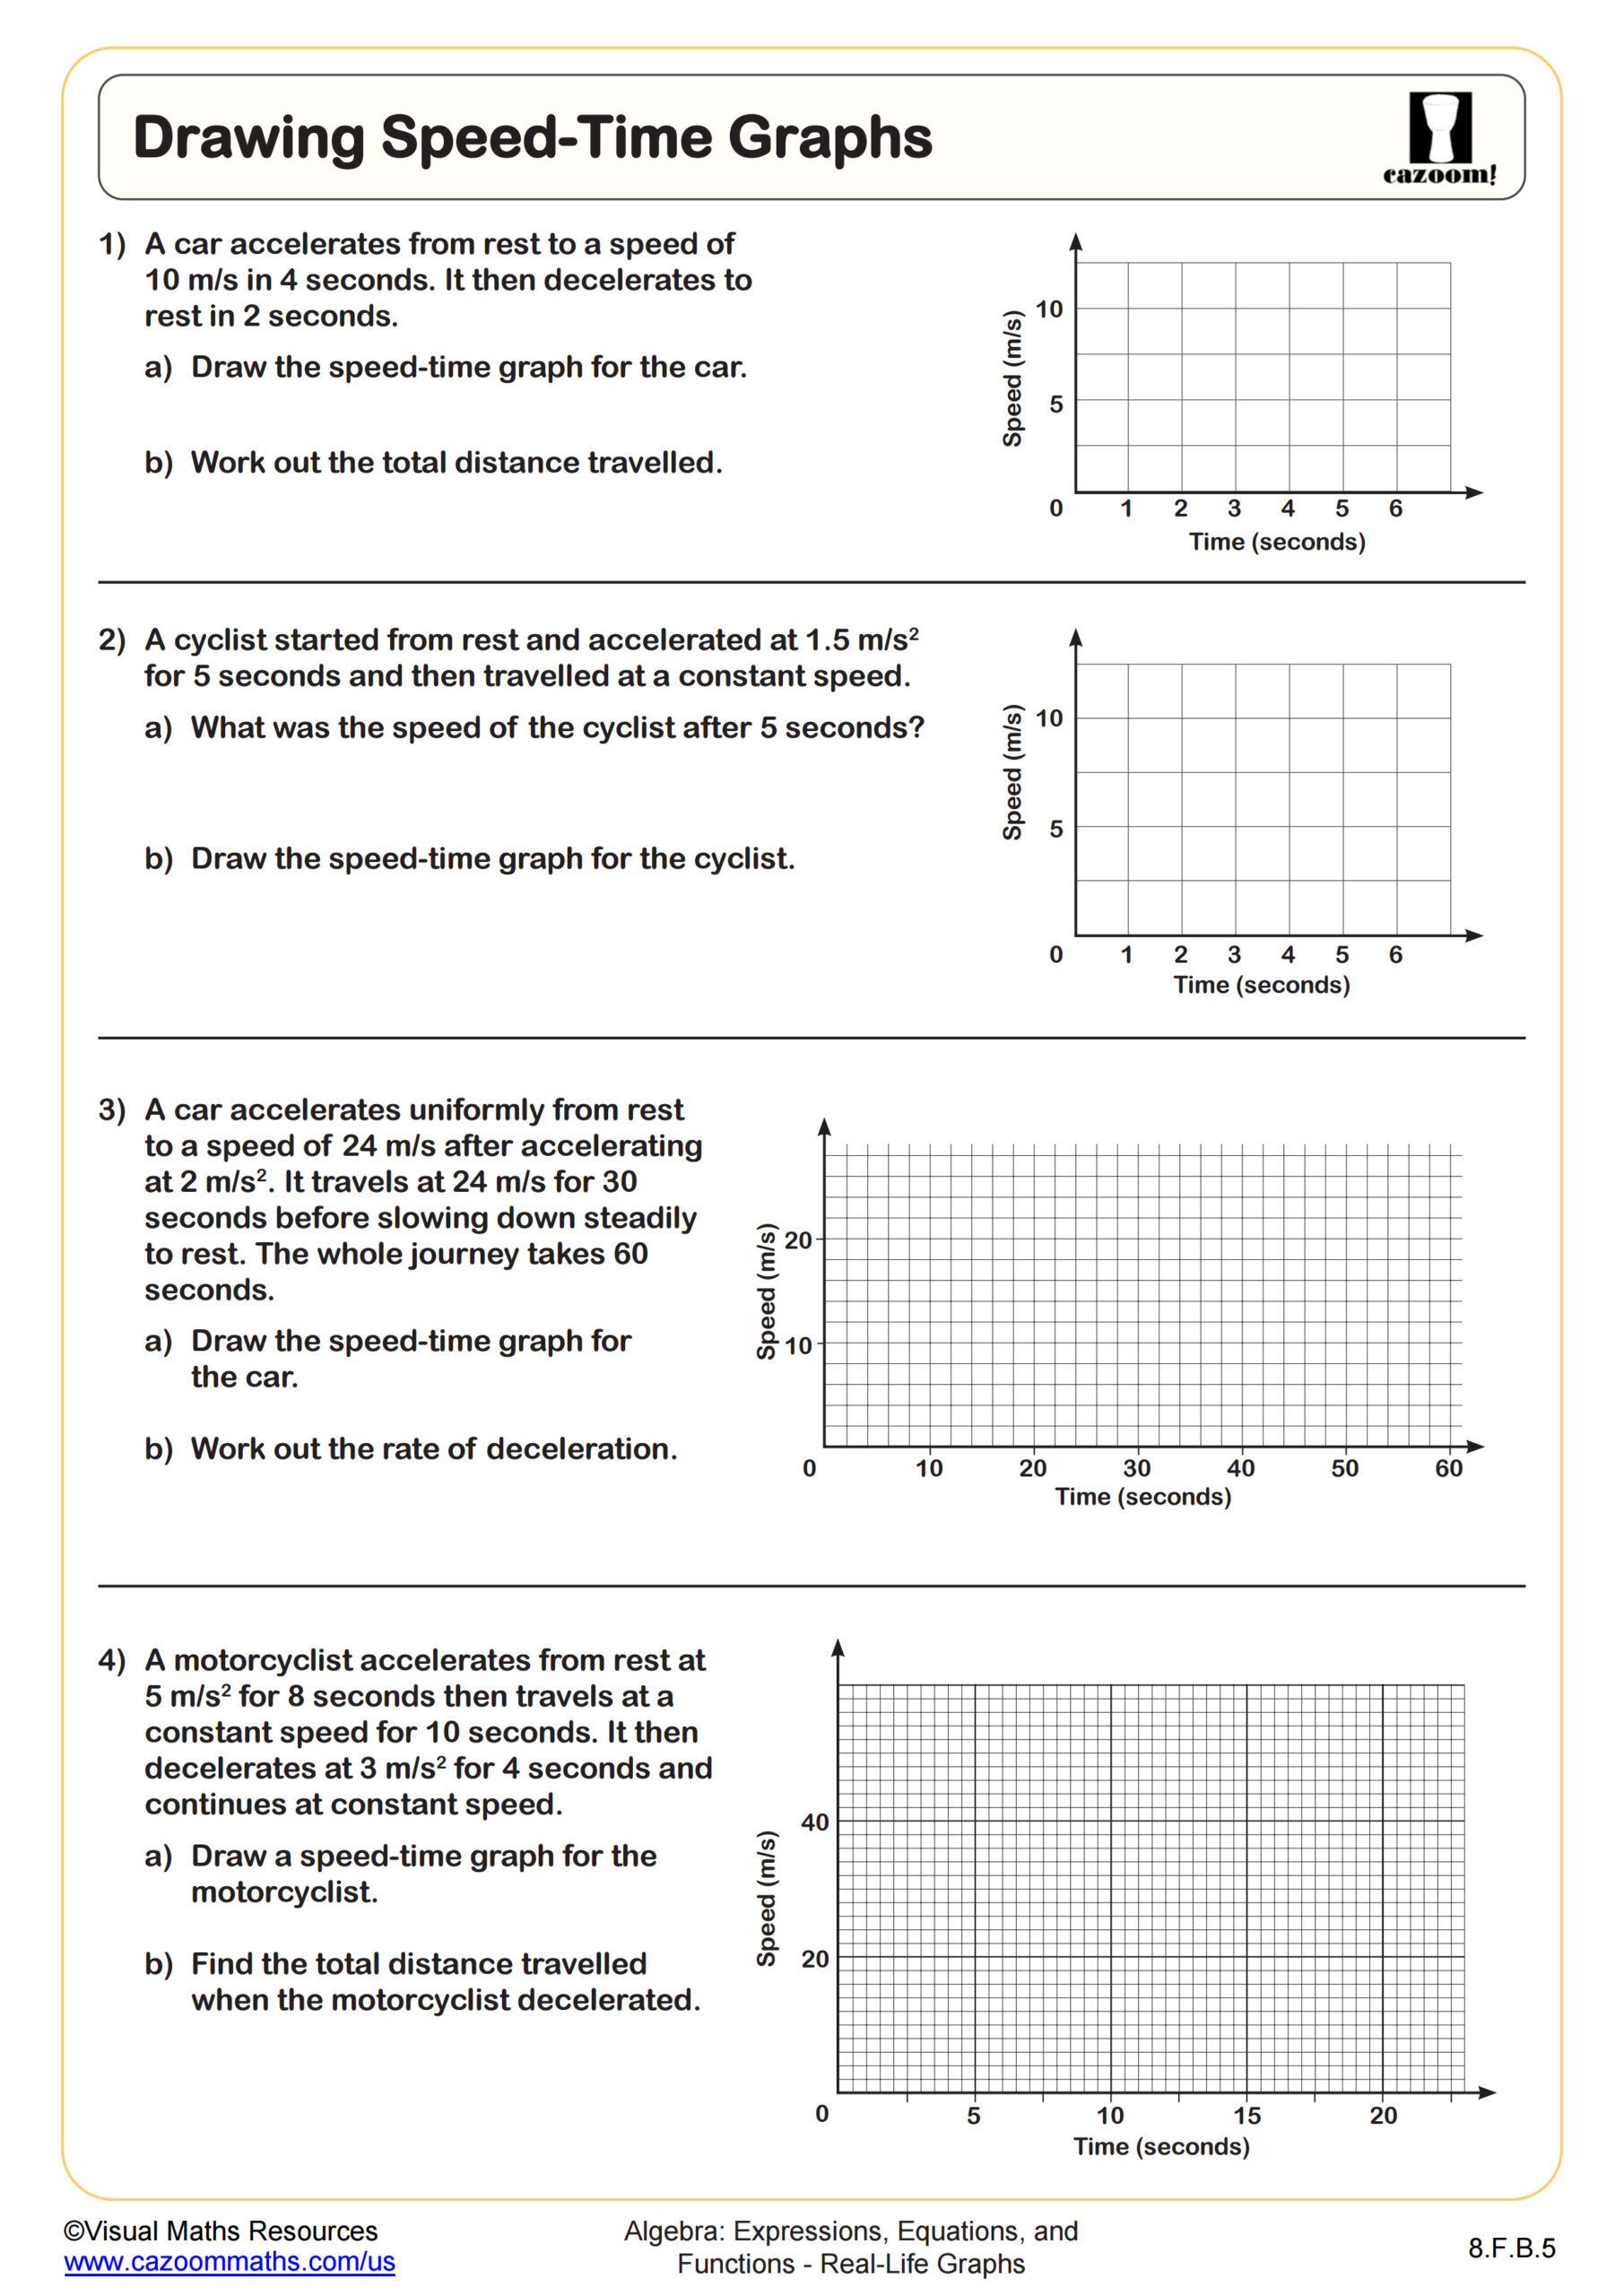
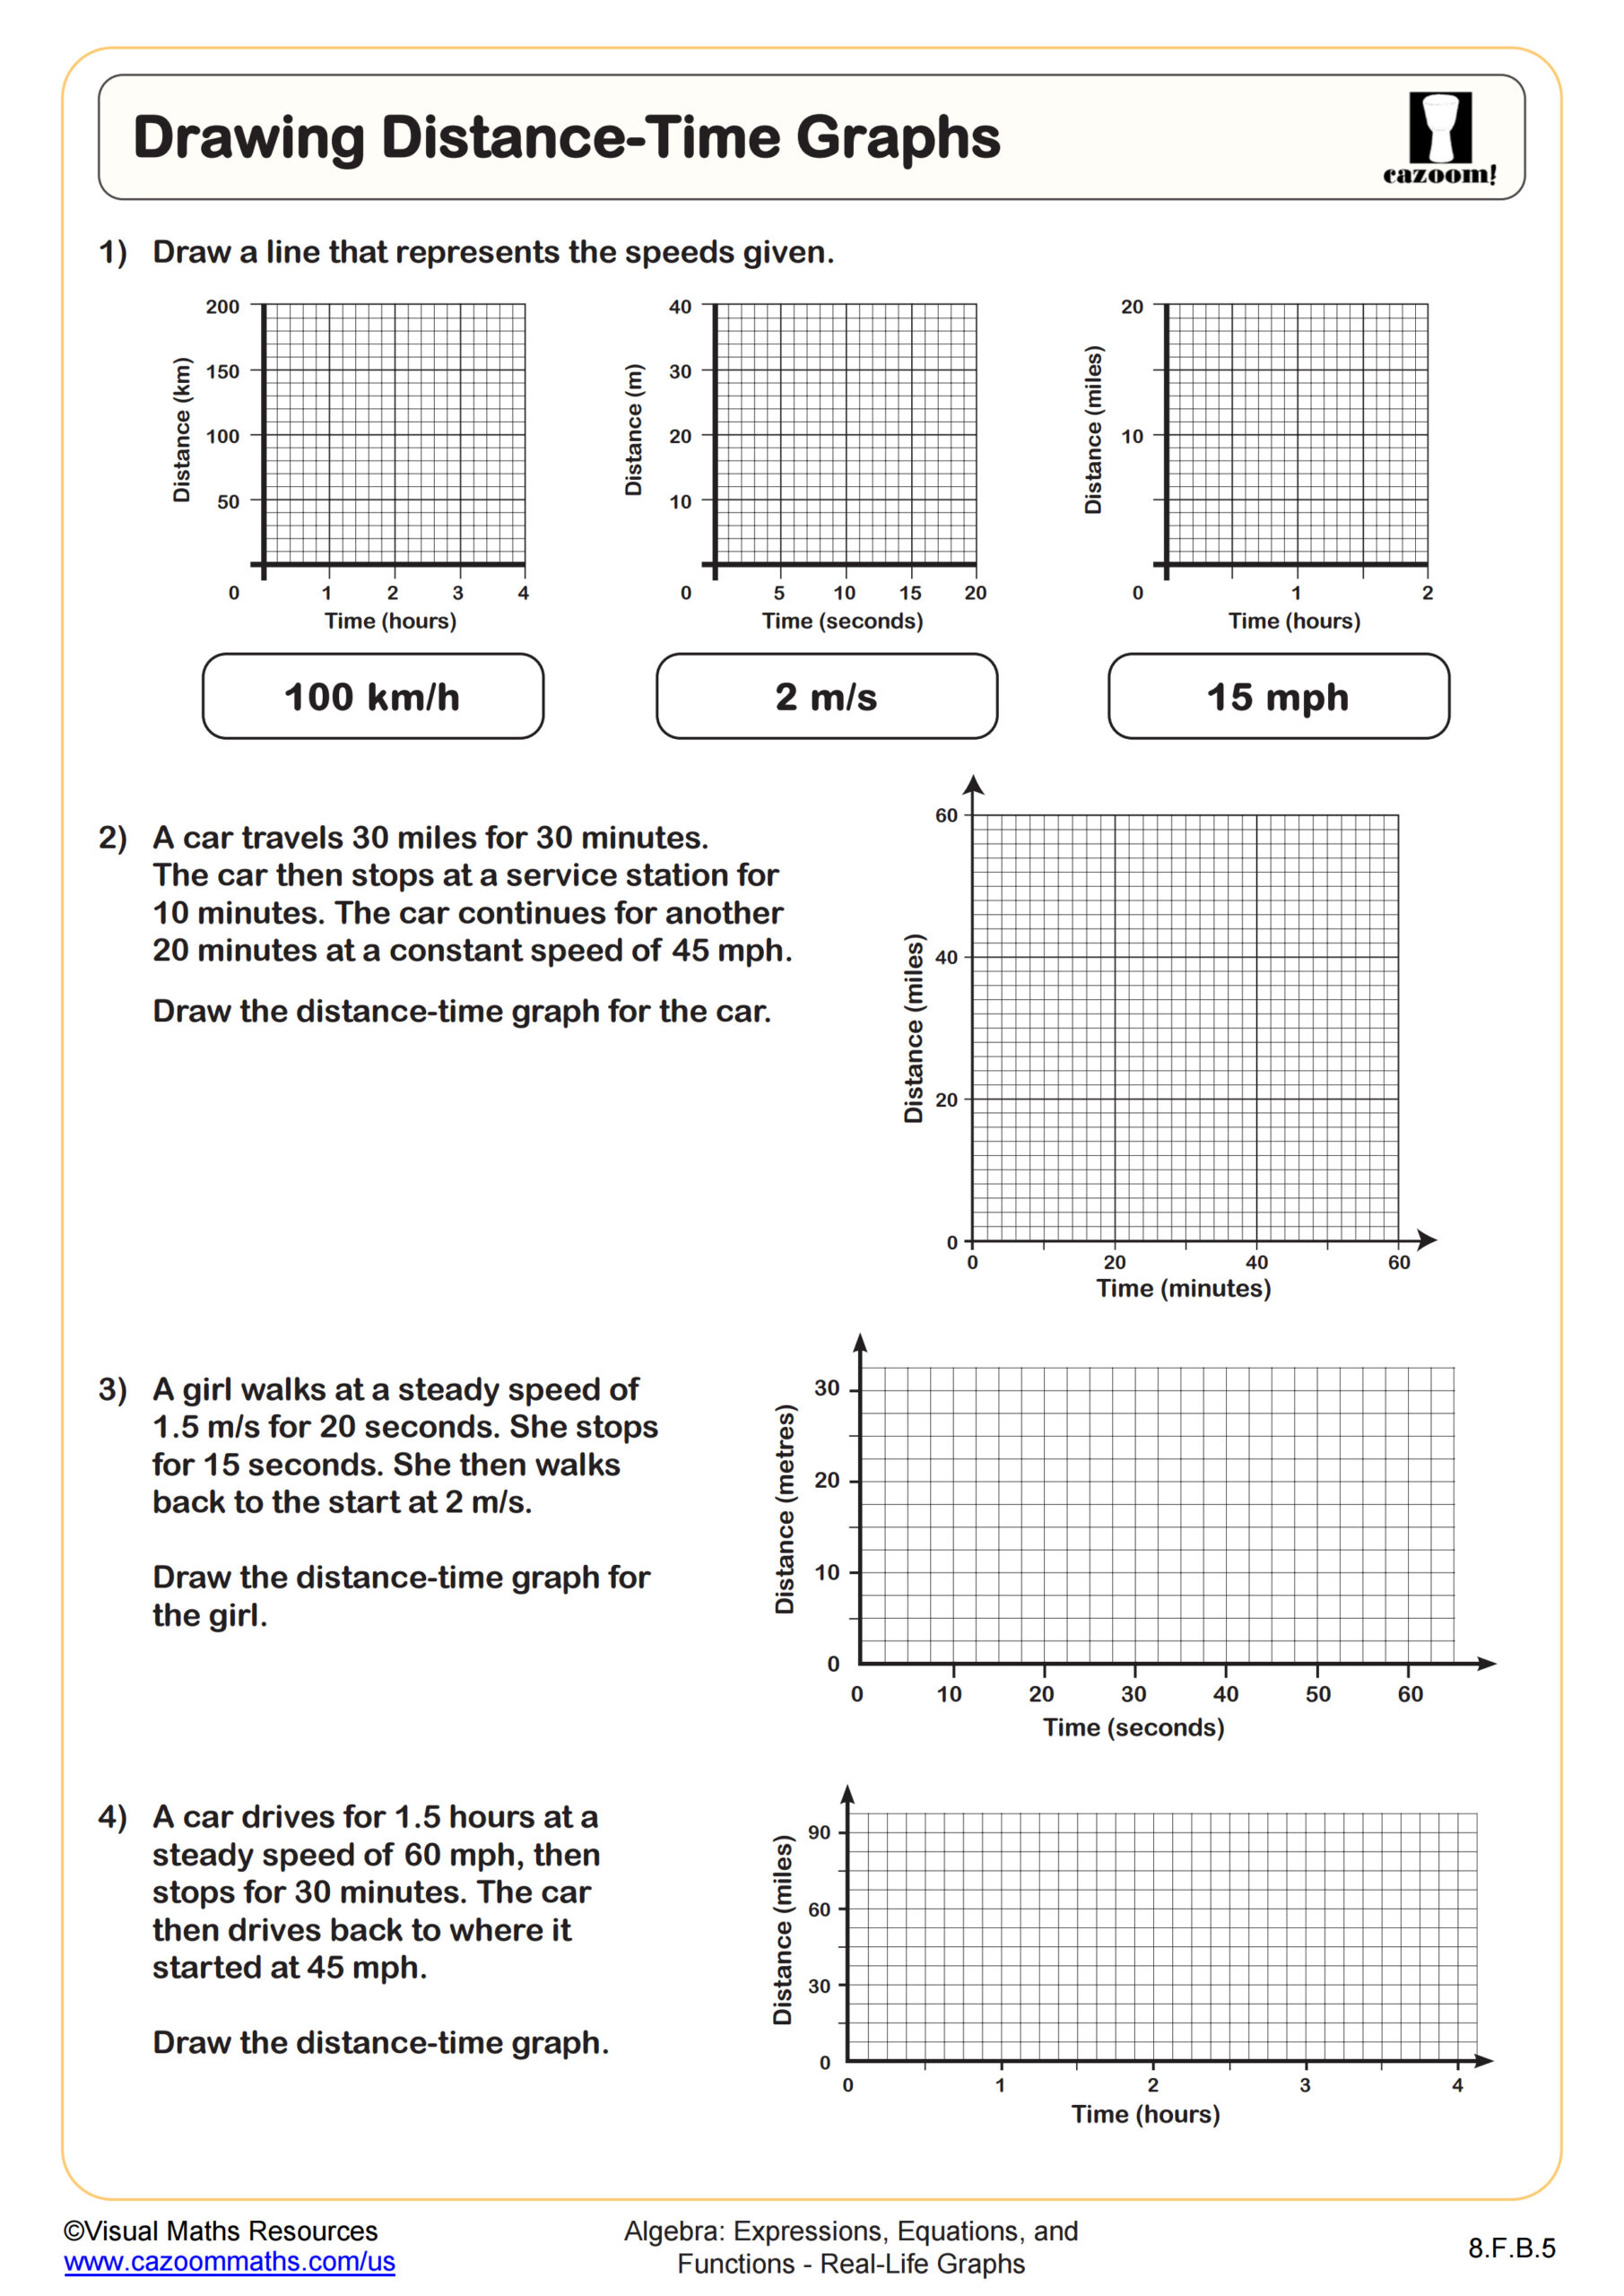
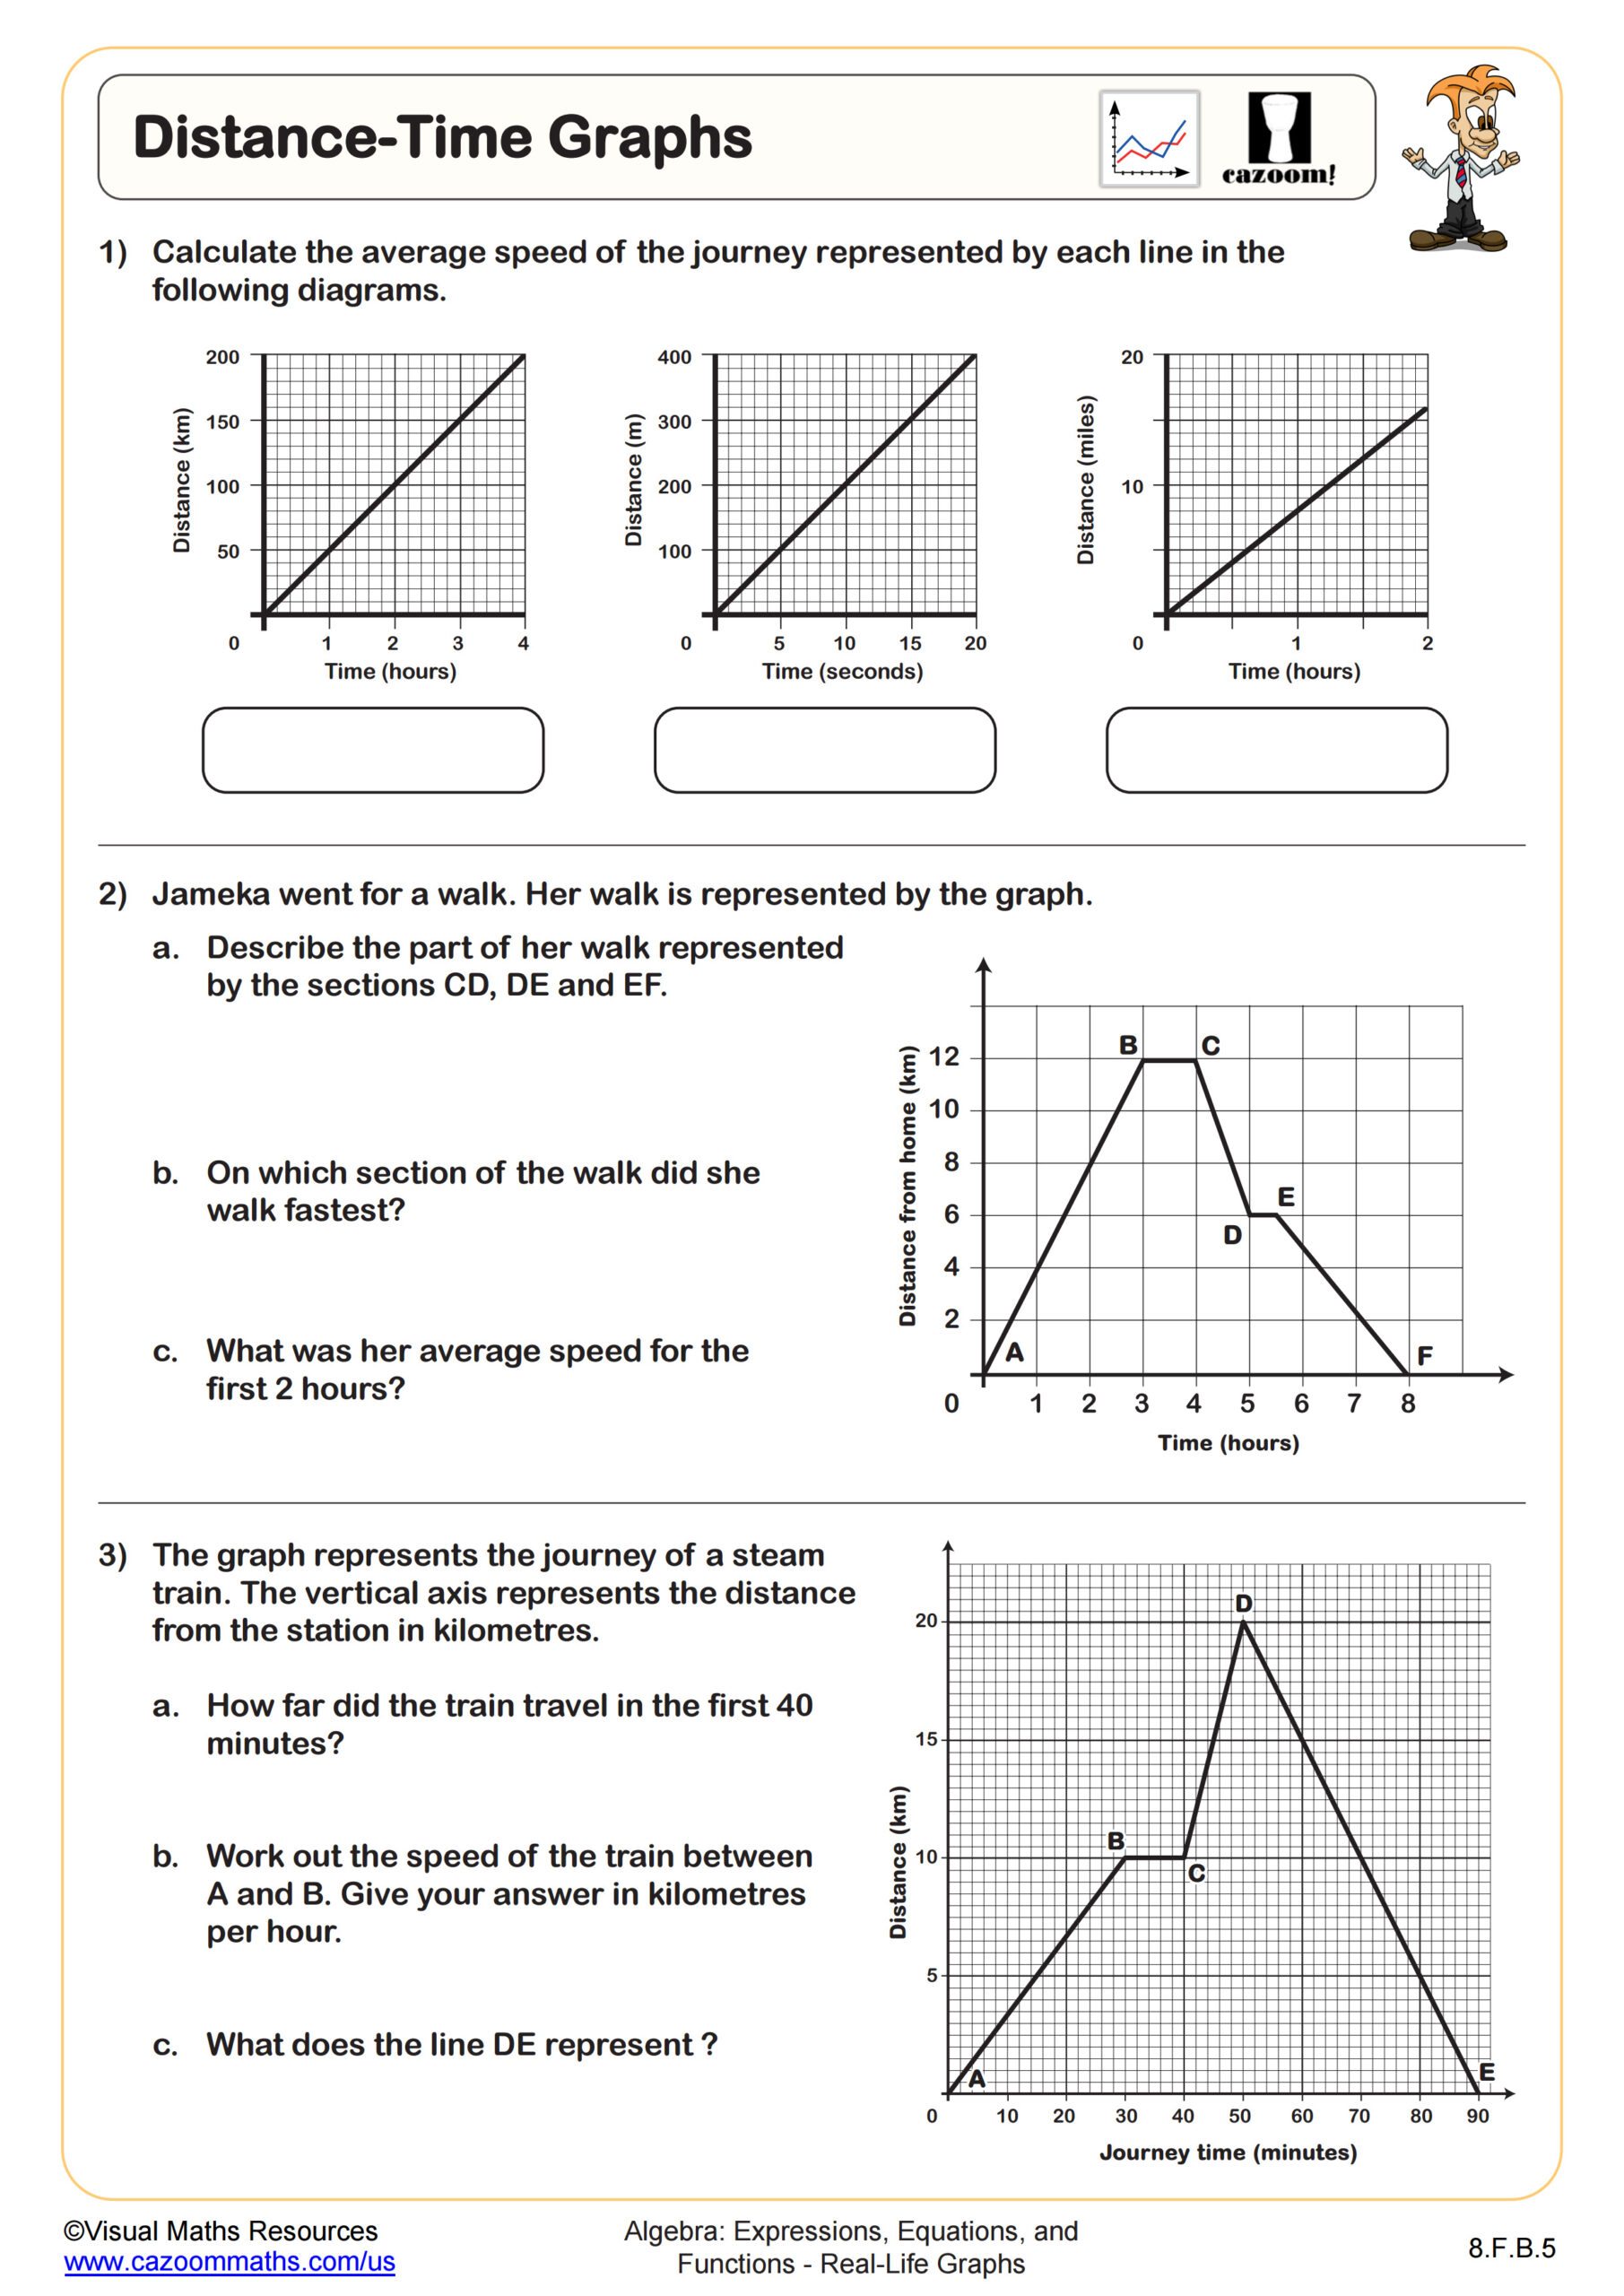
This worksheet will allow learners to practice reading from and completing speed-time graphs. It presents four questions focussing on skills such as calculating the acceleration or deceleration, finding the distance travelled in a given time period, finding the average speed for a whole journey, and describing the motion based on the shape of the graph.
All worksheets are created by the team of experienced teachers at Cazoom Math.

RELATED TO Interpreting Speed-Time Graphs WORKSHEET
Frequently Asked Questions
This interpreting speed-time graphs worksheet is designed for students in 8th Grade and aligns with Common Core State Standards.