Introduction to Graphing Linear Functions WORKSHEET
Introduction to Graphing Linear Functions WORKSHEET DESCRIPTION
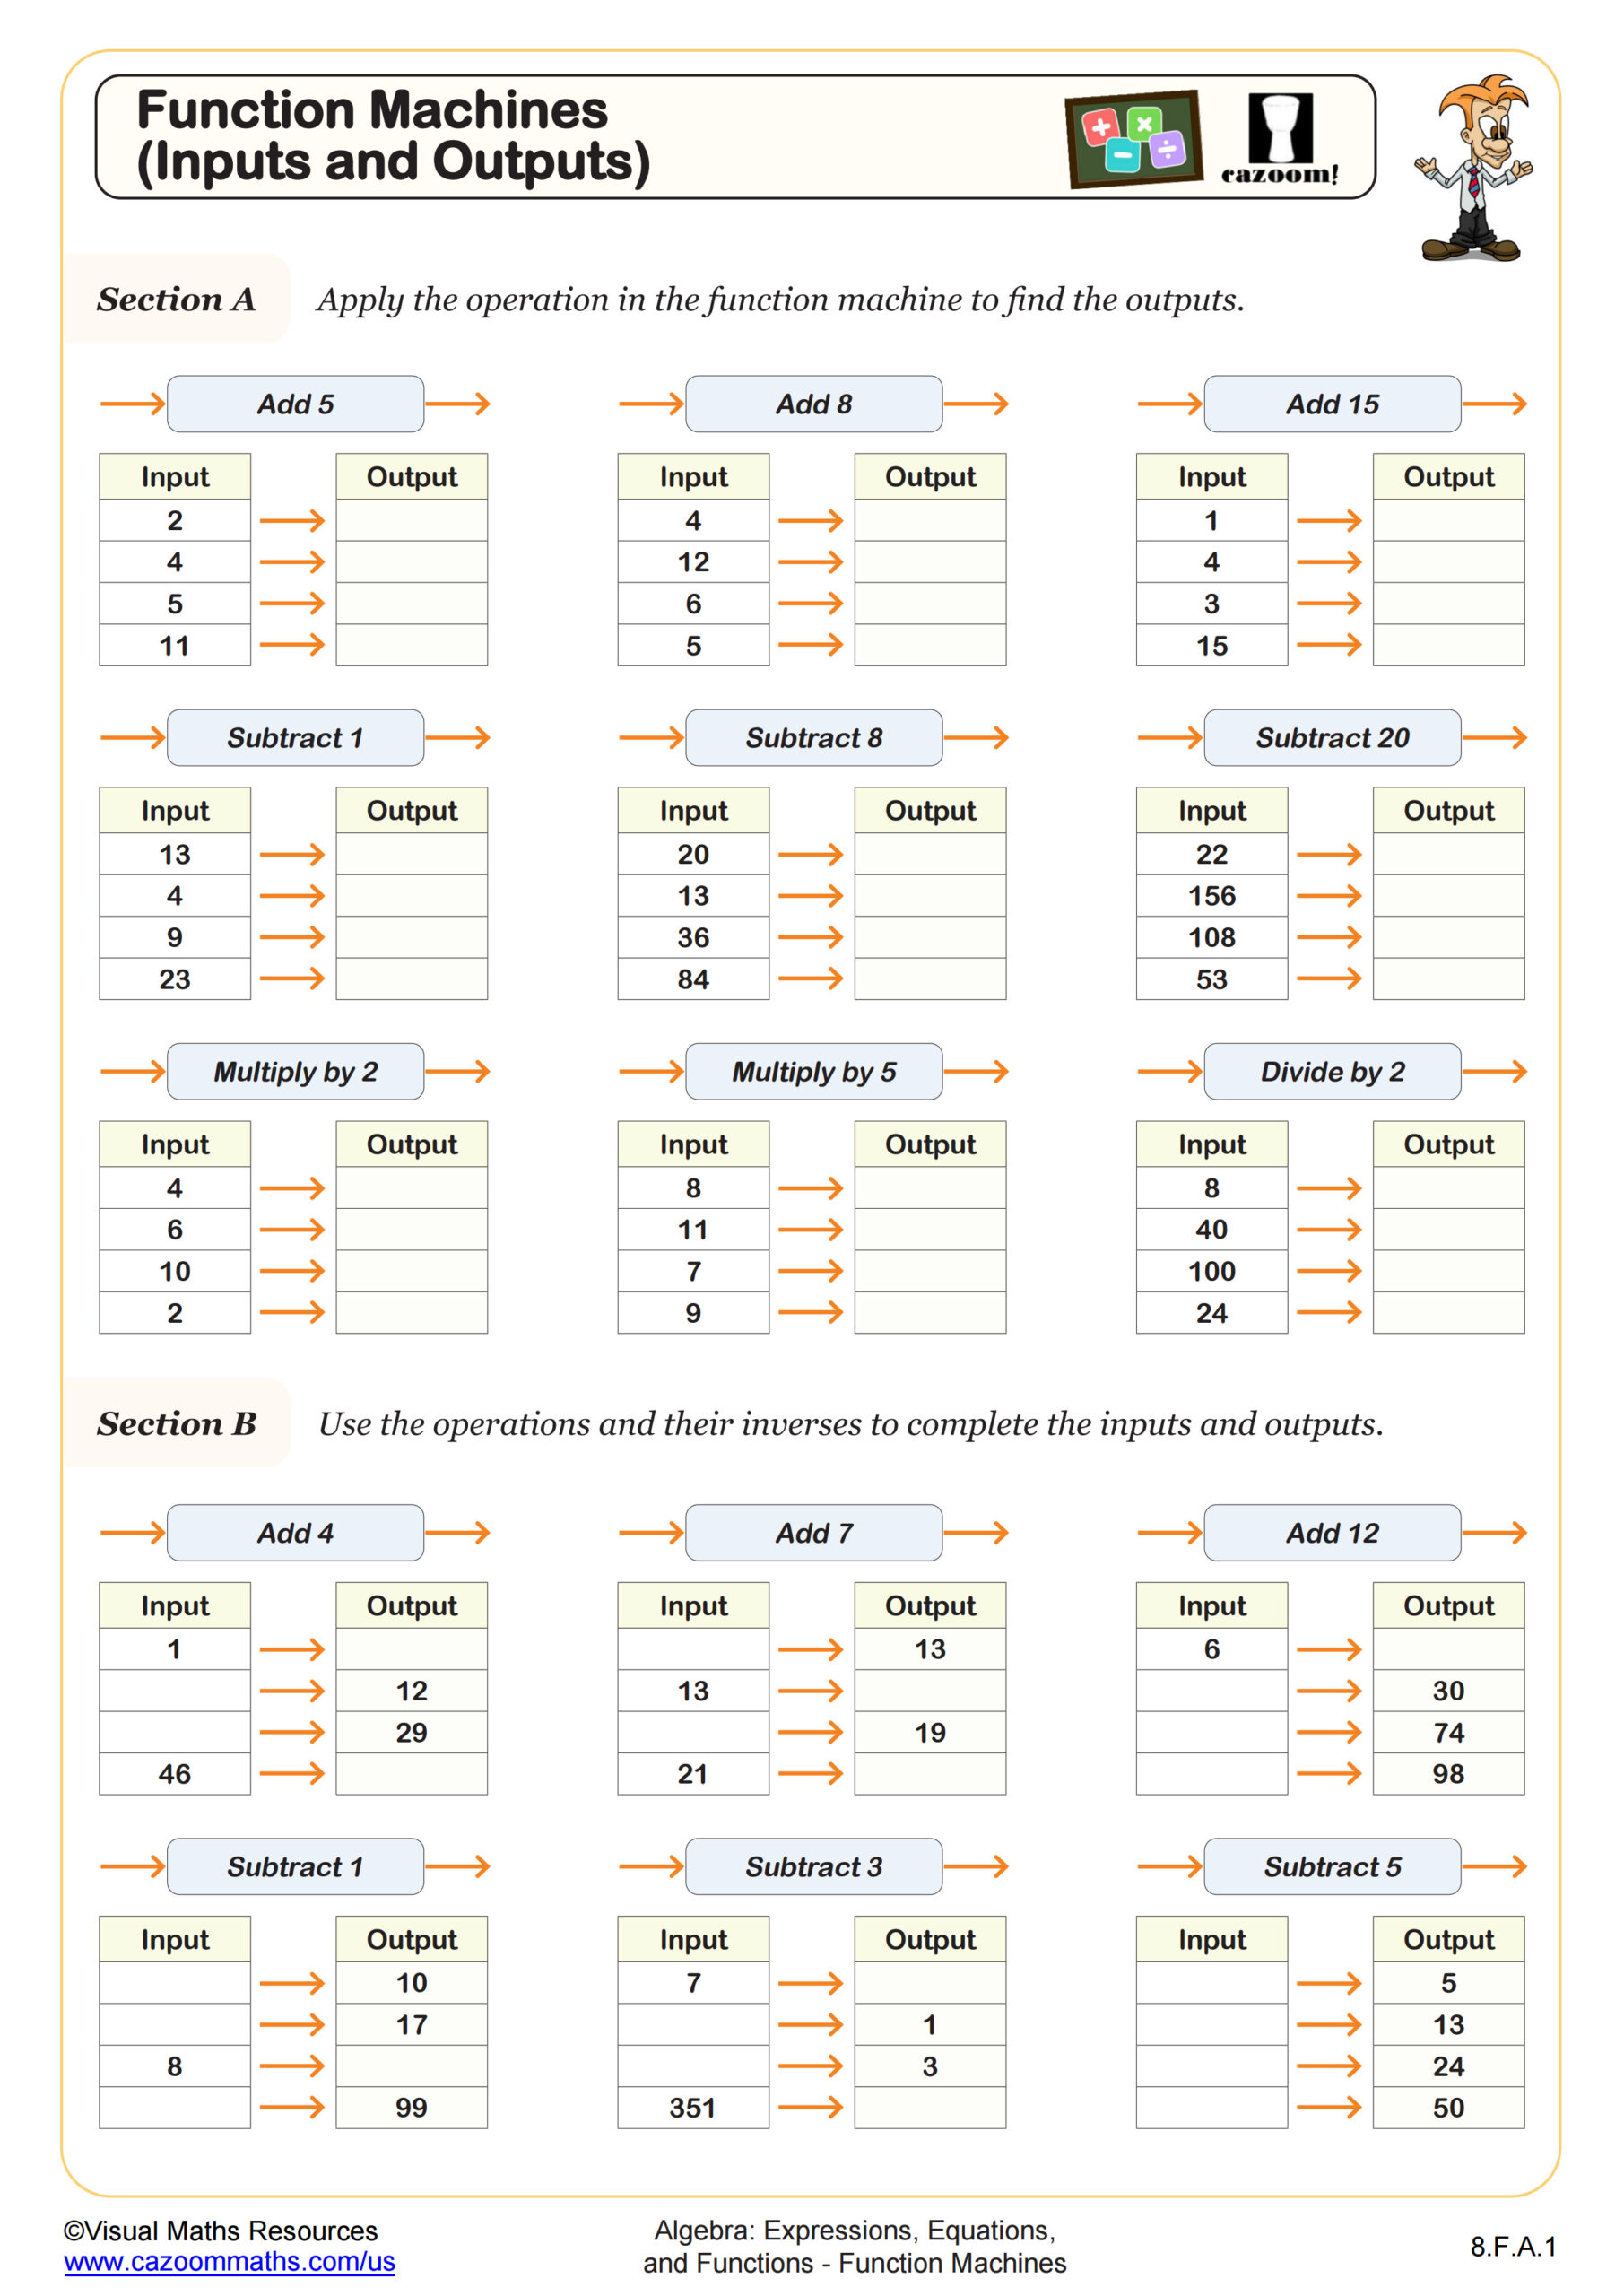
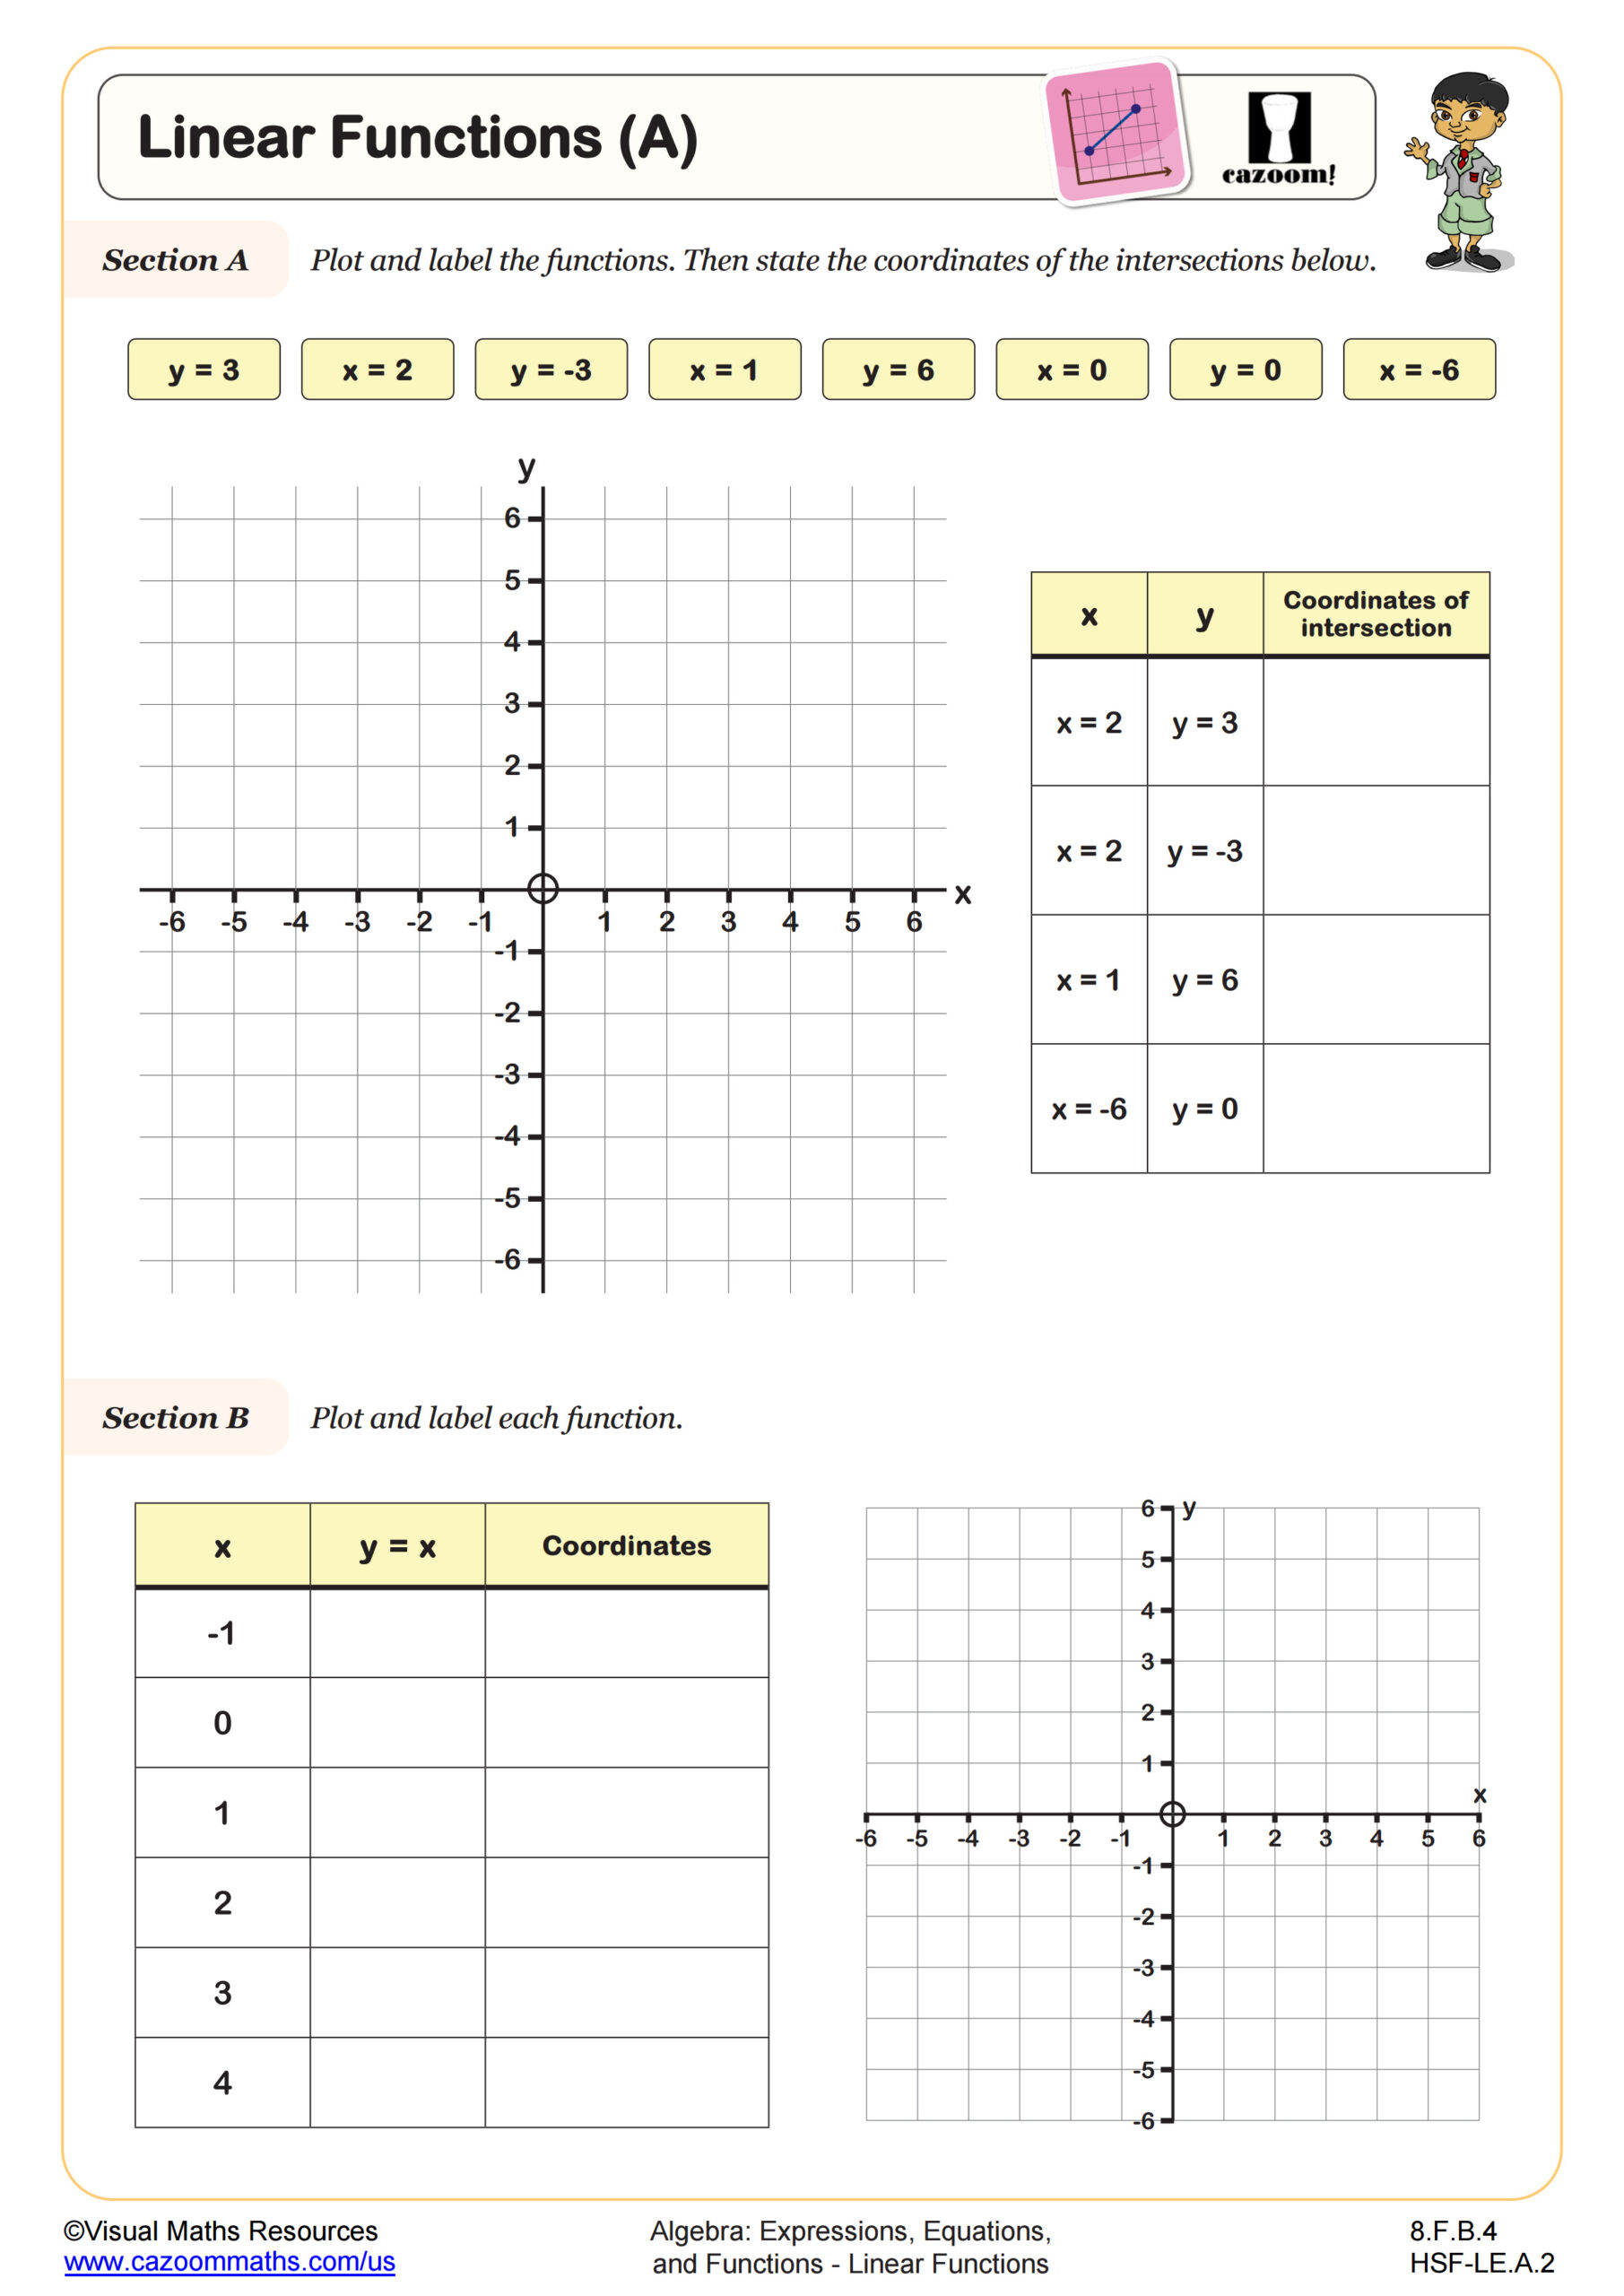
Students will learn how to draw straight line graphs in the first quadrant using function machines and tables of values to generate coordinate pairs. Ensure students are equipped with a ruler and pencil before they begin drawing their lines.
In section A, students will plot the graphs of y = x + 1, y = x + 3 and y = 2x. Learners will be provided with a function machine, a table of values for x between 0 and 3, and and three separate coordinate grids.
Next, in section B , students will plot the graphs of equations such as y = 2x + 1. The scaffolding provided decreases as the section progresses. However, a function machine, table of values, and separate coordinate grids are provided for each equation.
All straight lines have positive integer slopes and integer y intercepts.
All worksheets are created by the team of experienced teachers at Cazoom Math.

RELATED TO Introduction to Graphing Linear Functions WORKSHEET
Frequently Asked Questions
This introduction to graphing linear functions worksheet is designed for students in 8th Grade and Algebra I and aligns with Common Core State Standards.