Investigating Linear Functions WORKSHEET
For a function that models a relationship between two quantities, interpret key features of graphs and tables in terms of the quantities, and sketch graphs showing key features given a verbal description of the relationship. Key features include: intercepts; intervals where the function is increasing, decreasing, positive, or negative; relative maximums and minimums; symmetries; end behavior; and periodicity.
Investigating Linear Functions WORKSHEET DESCRIPTION
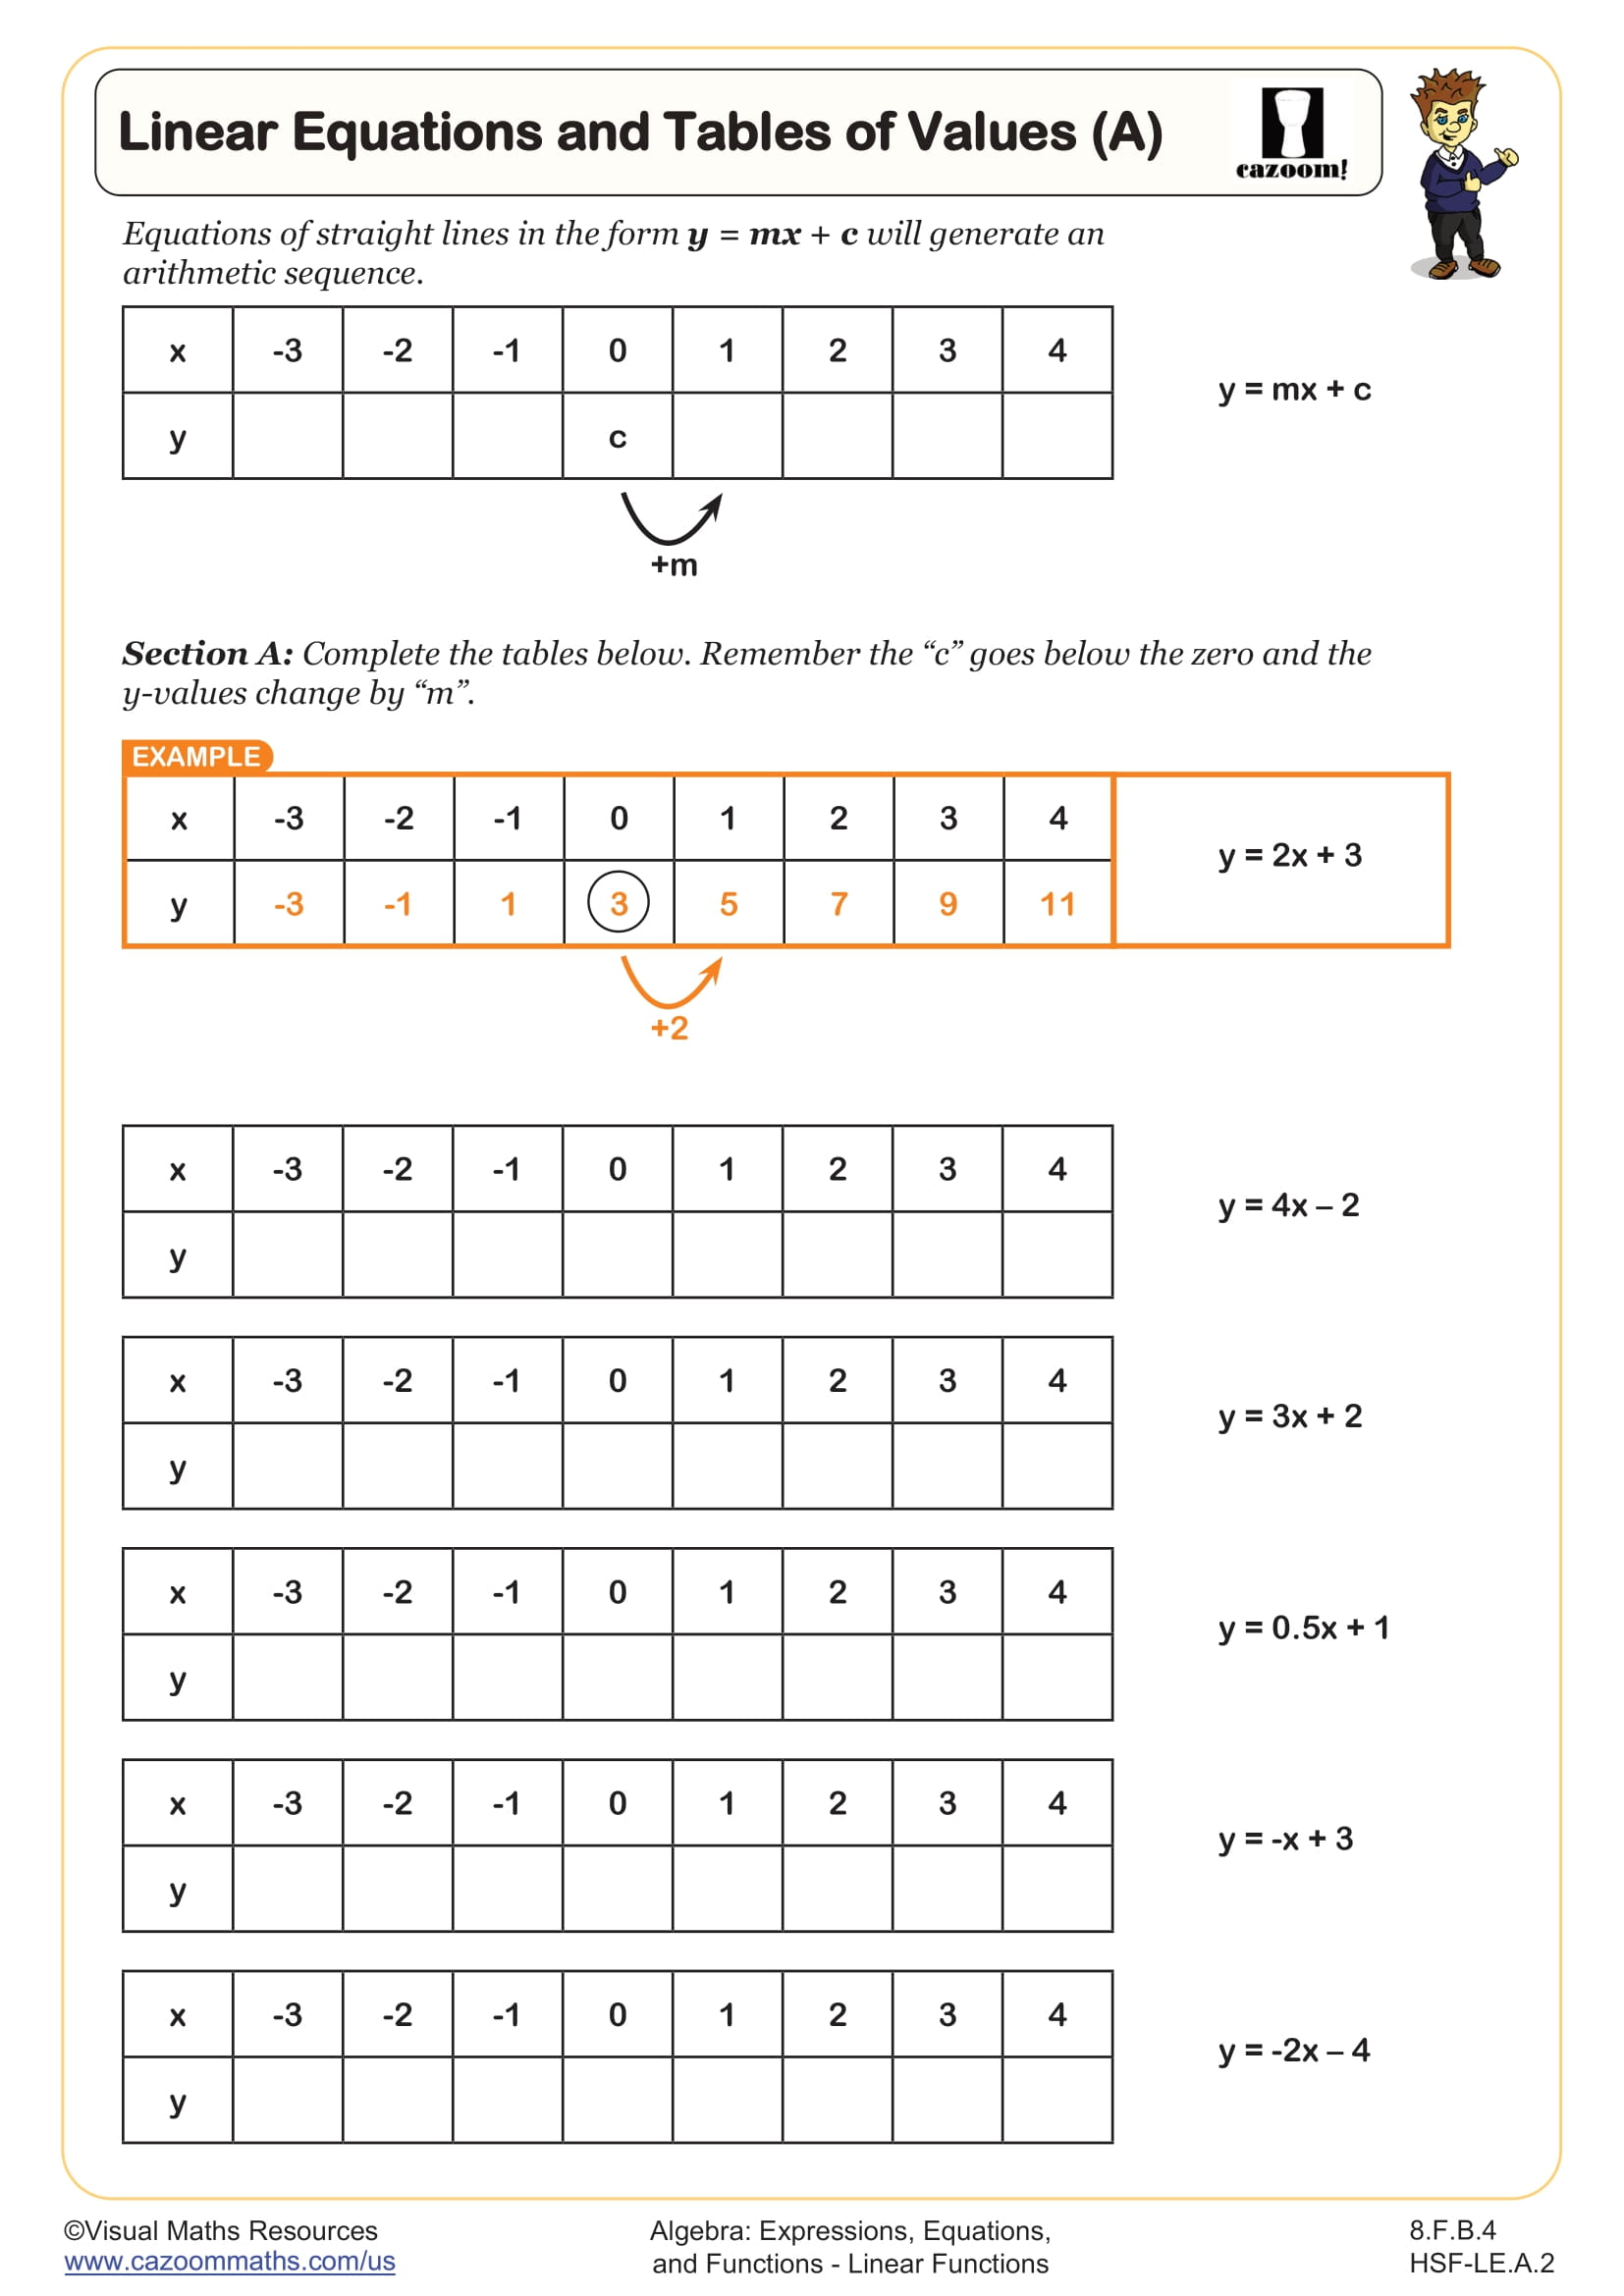
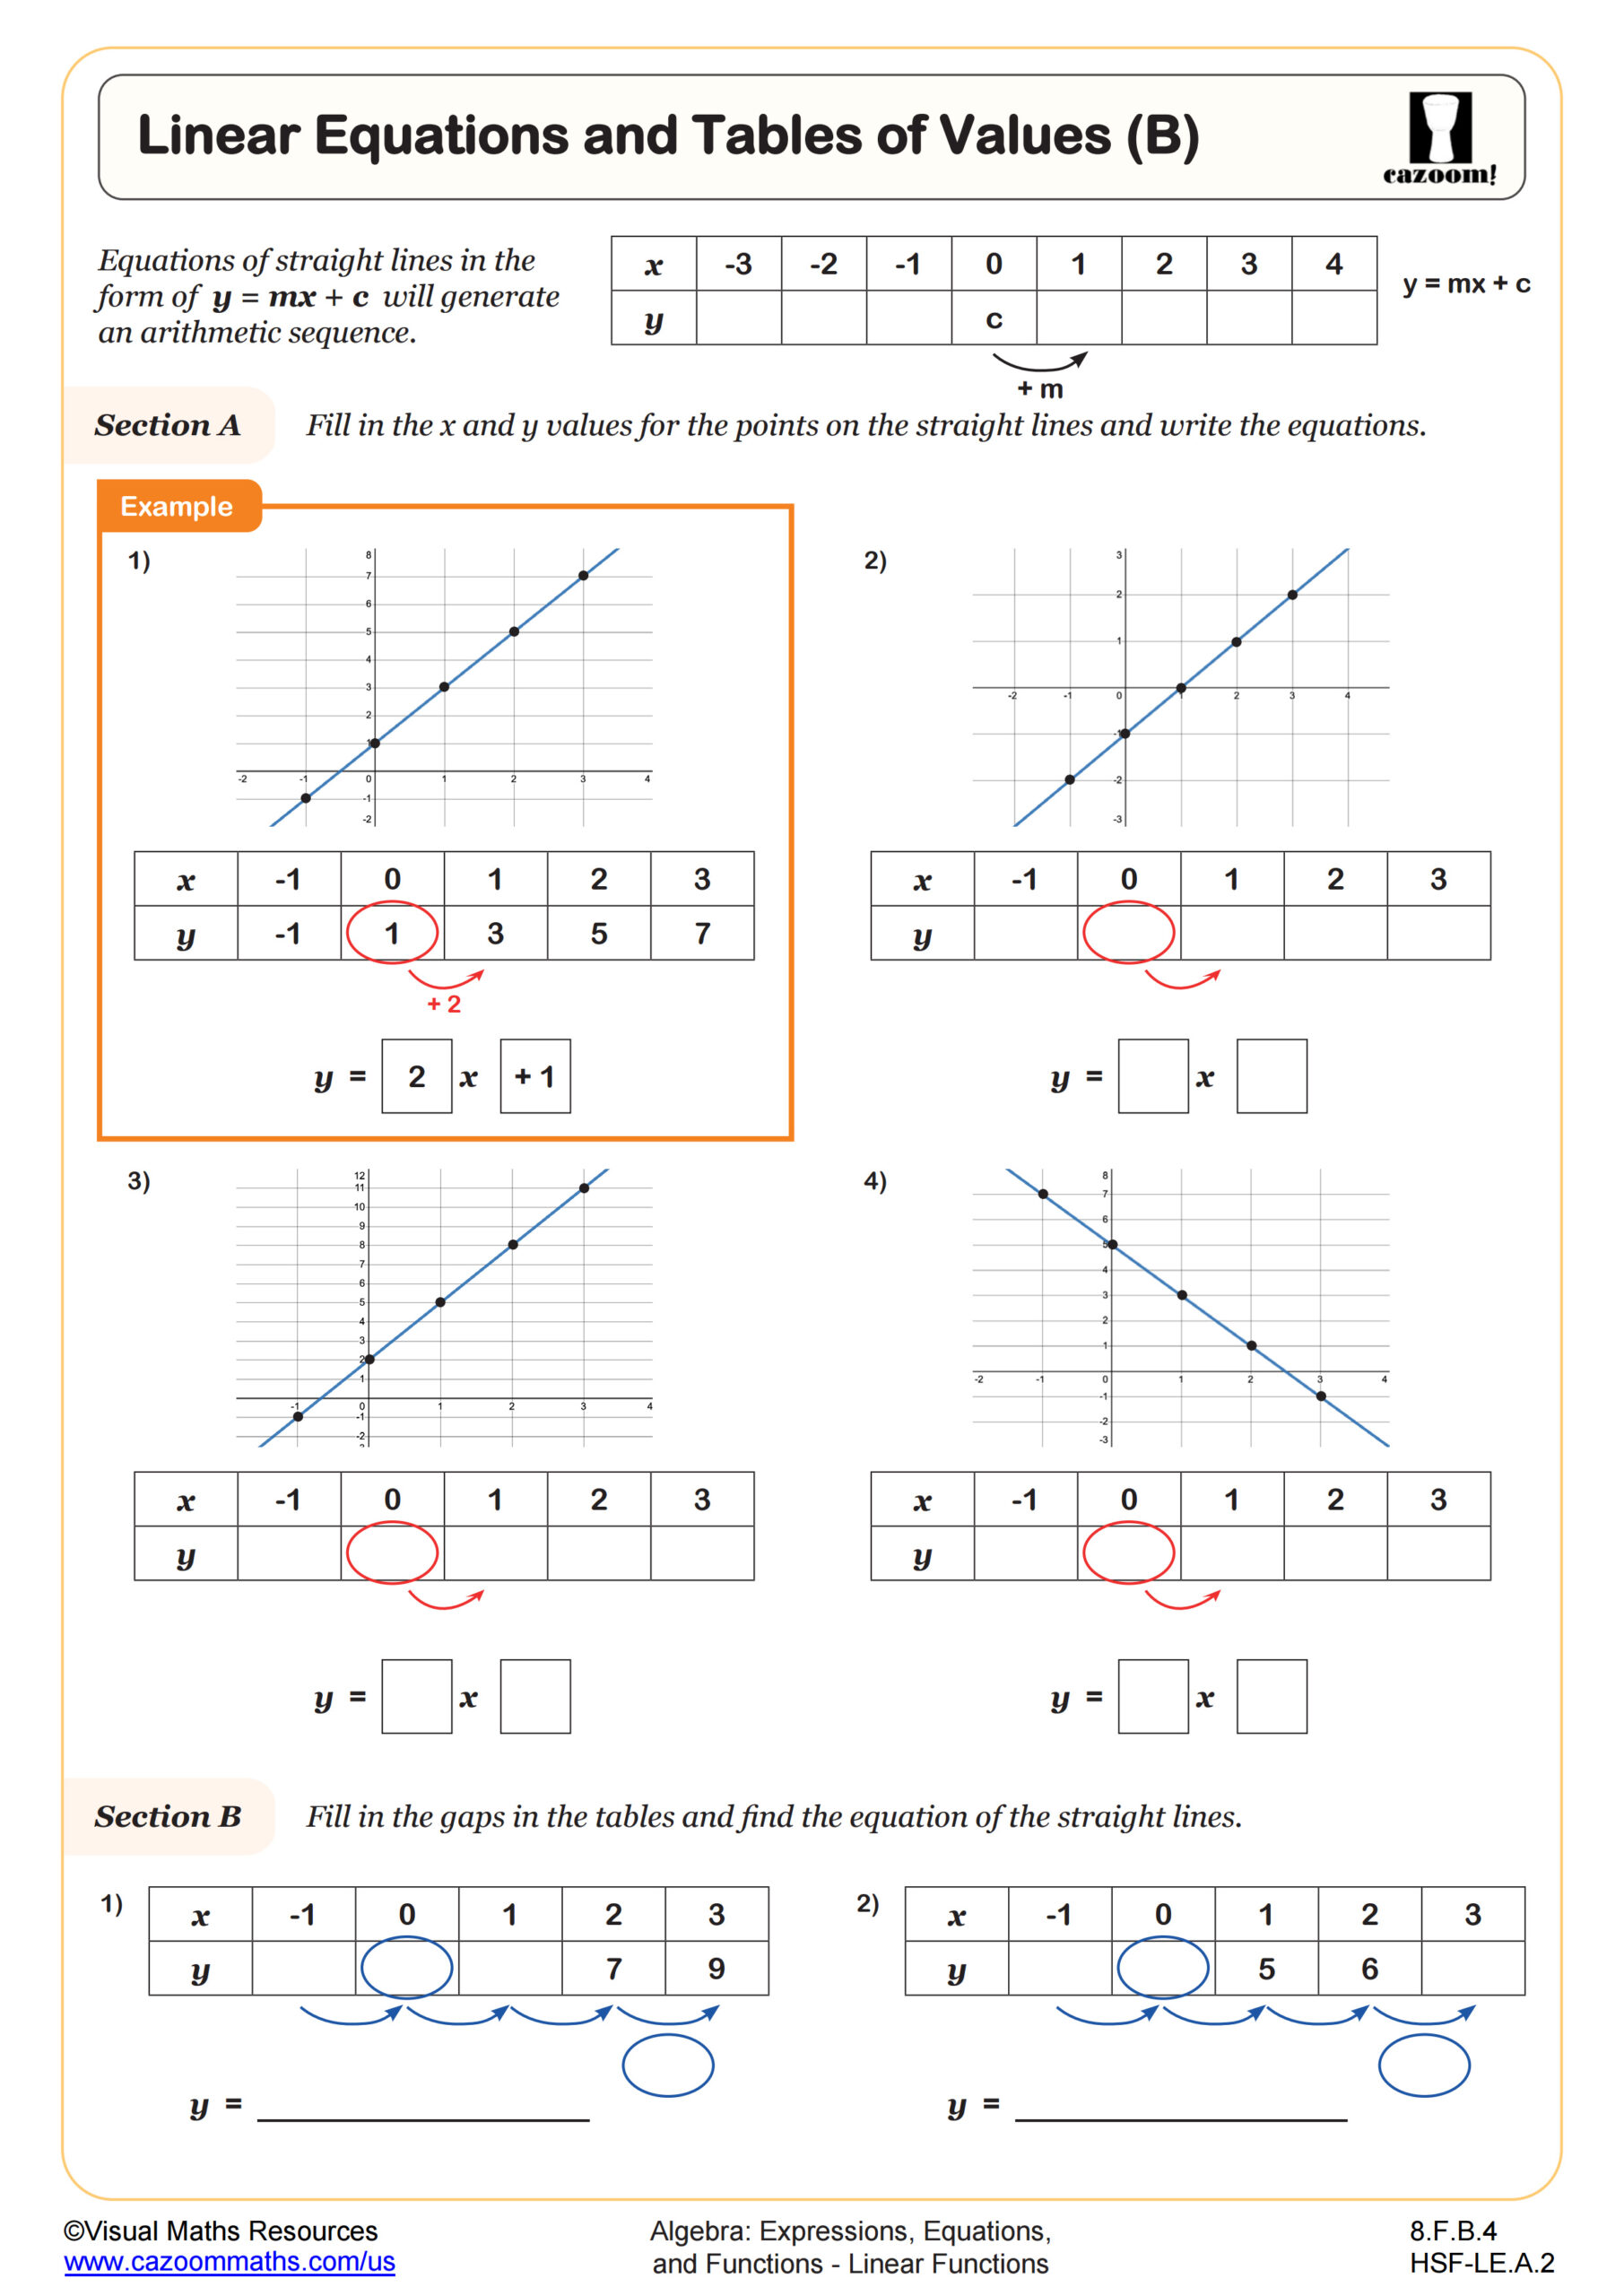
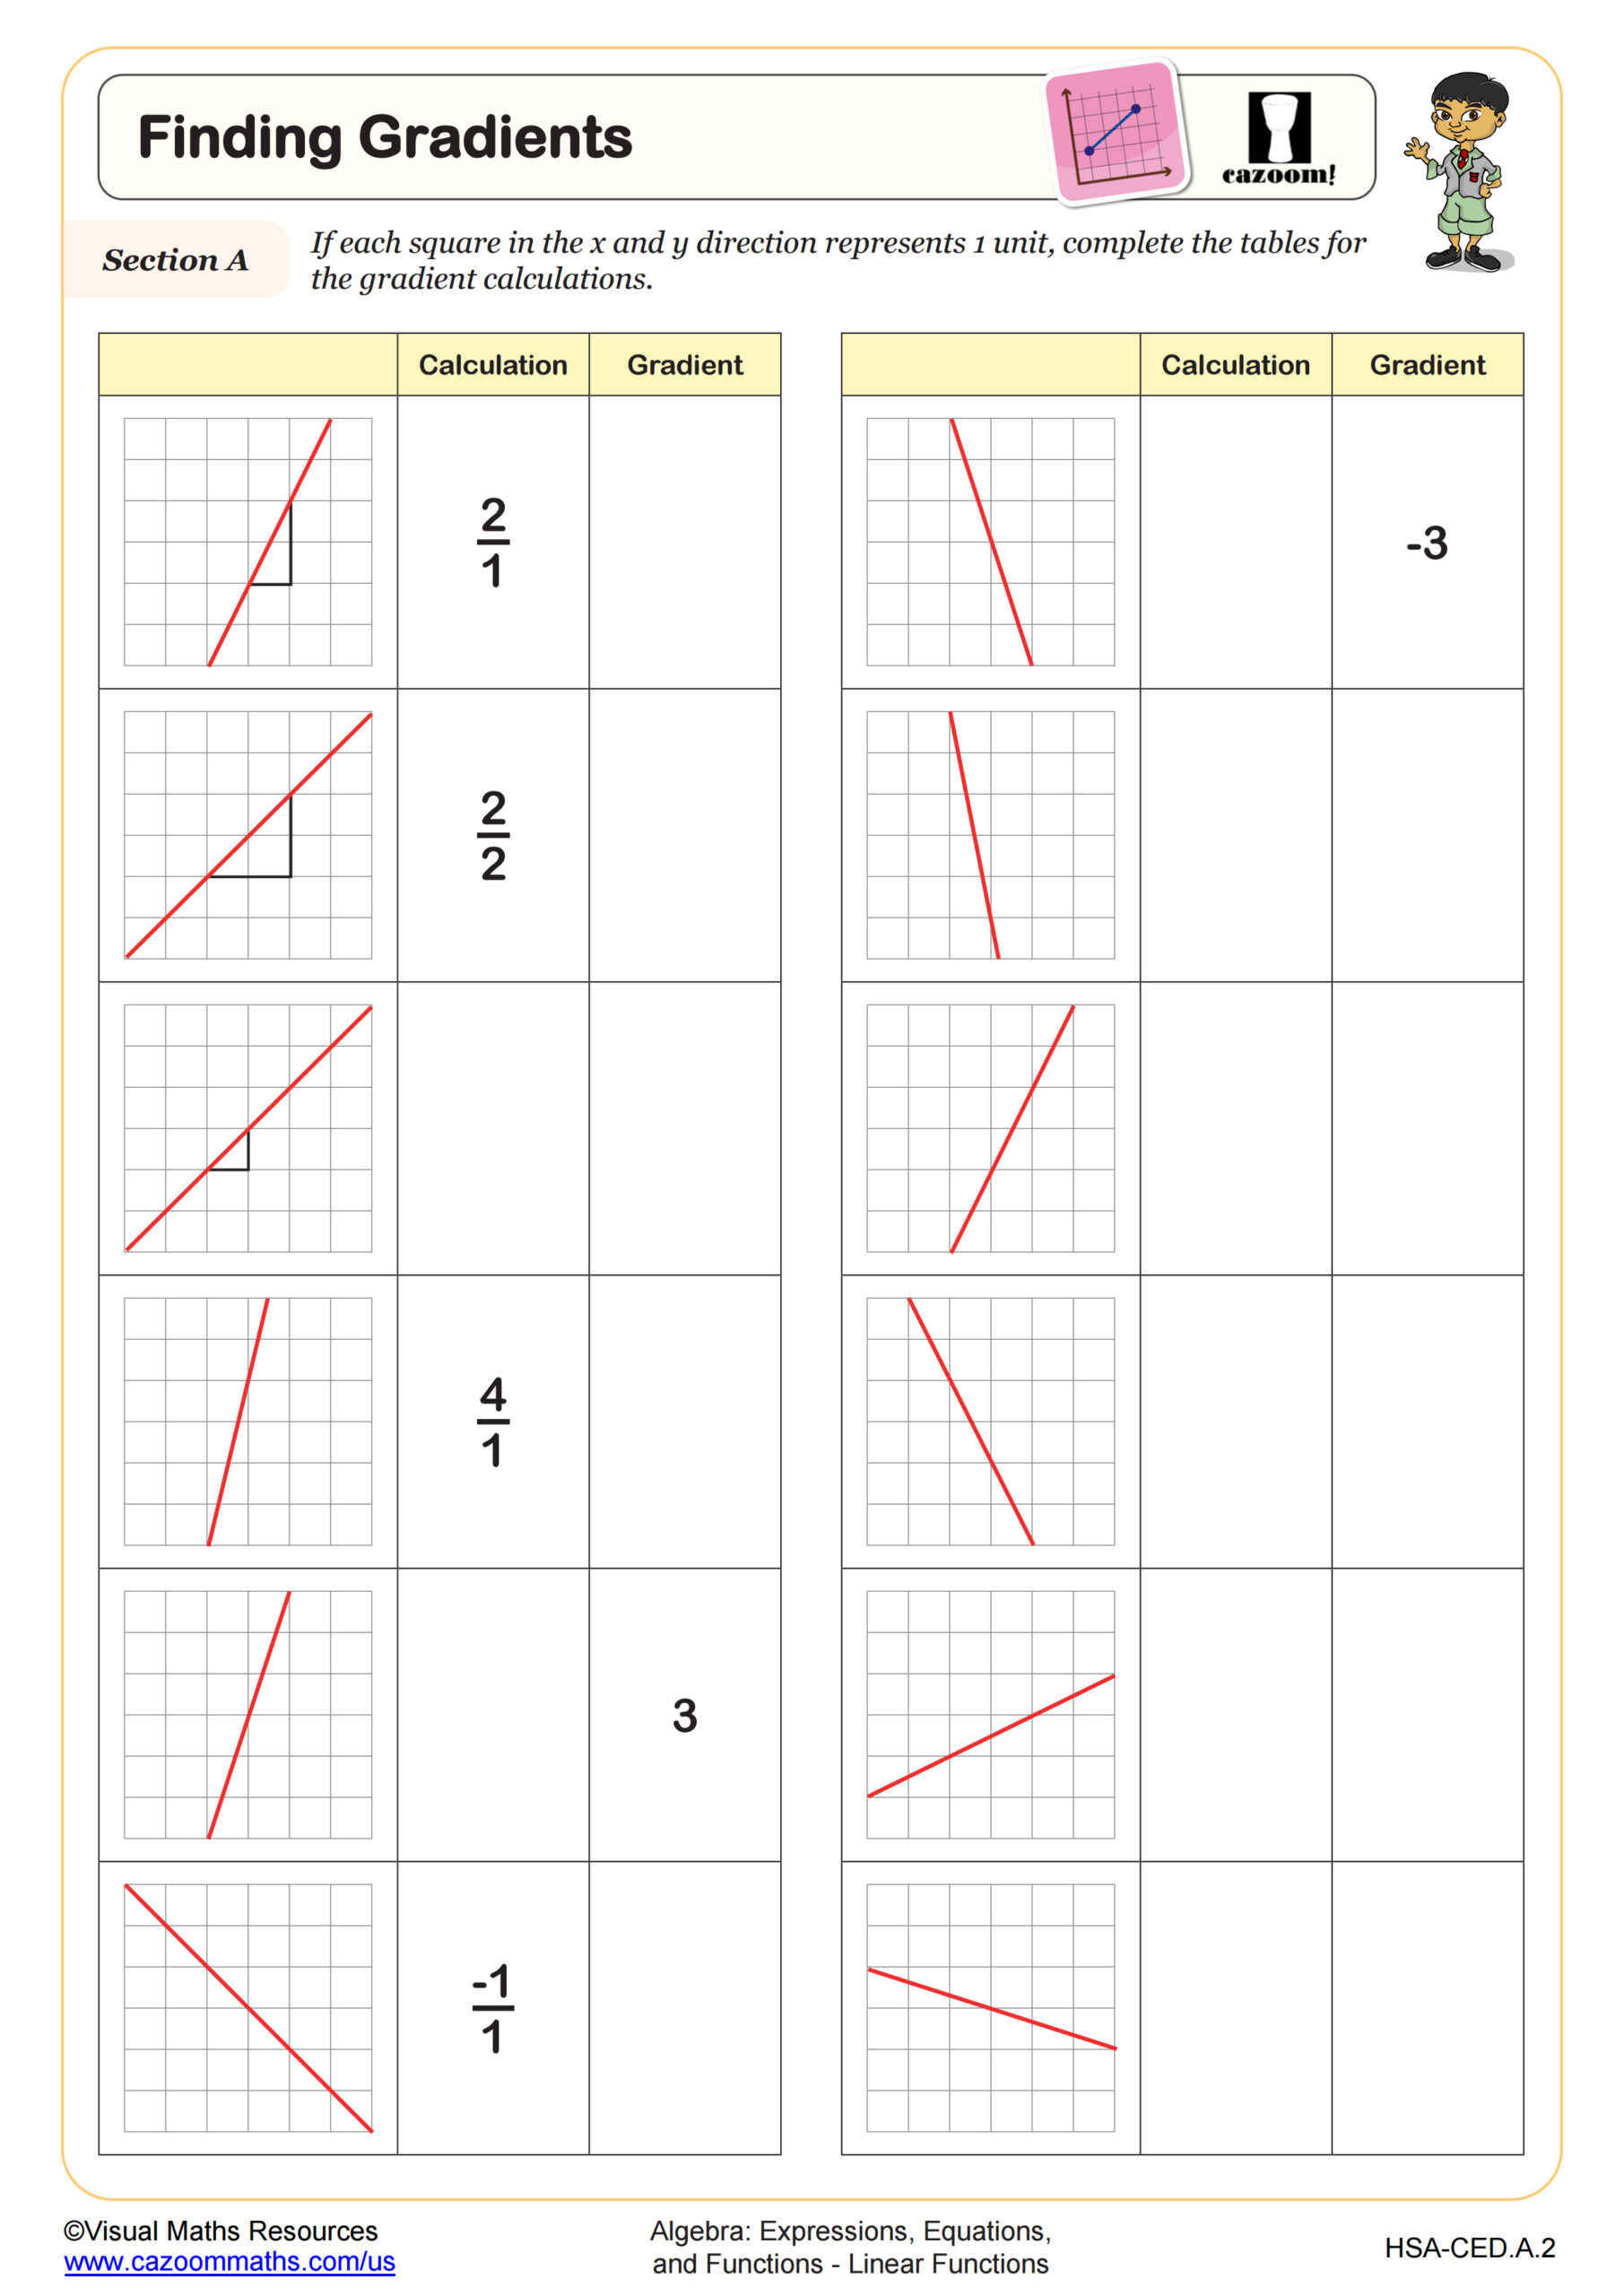
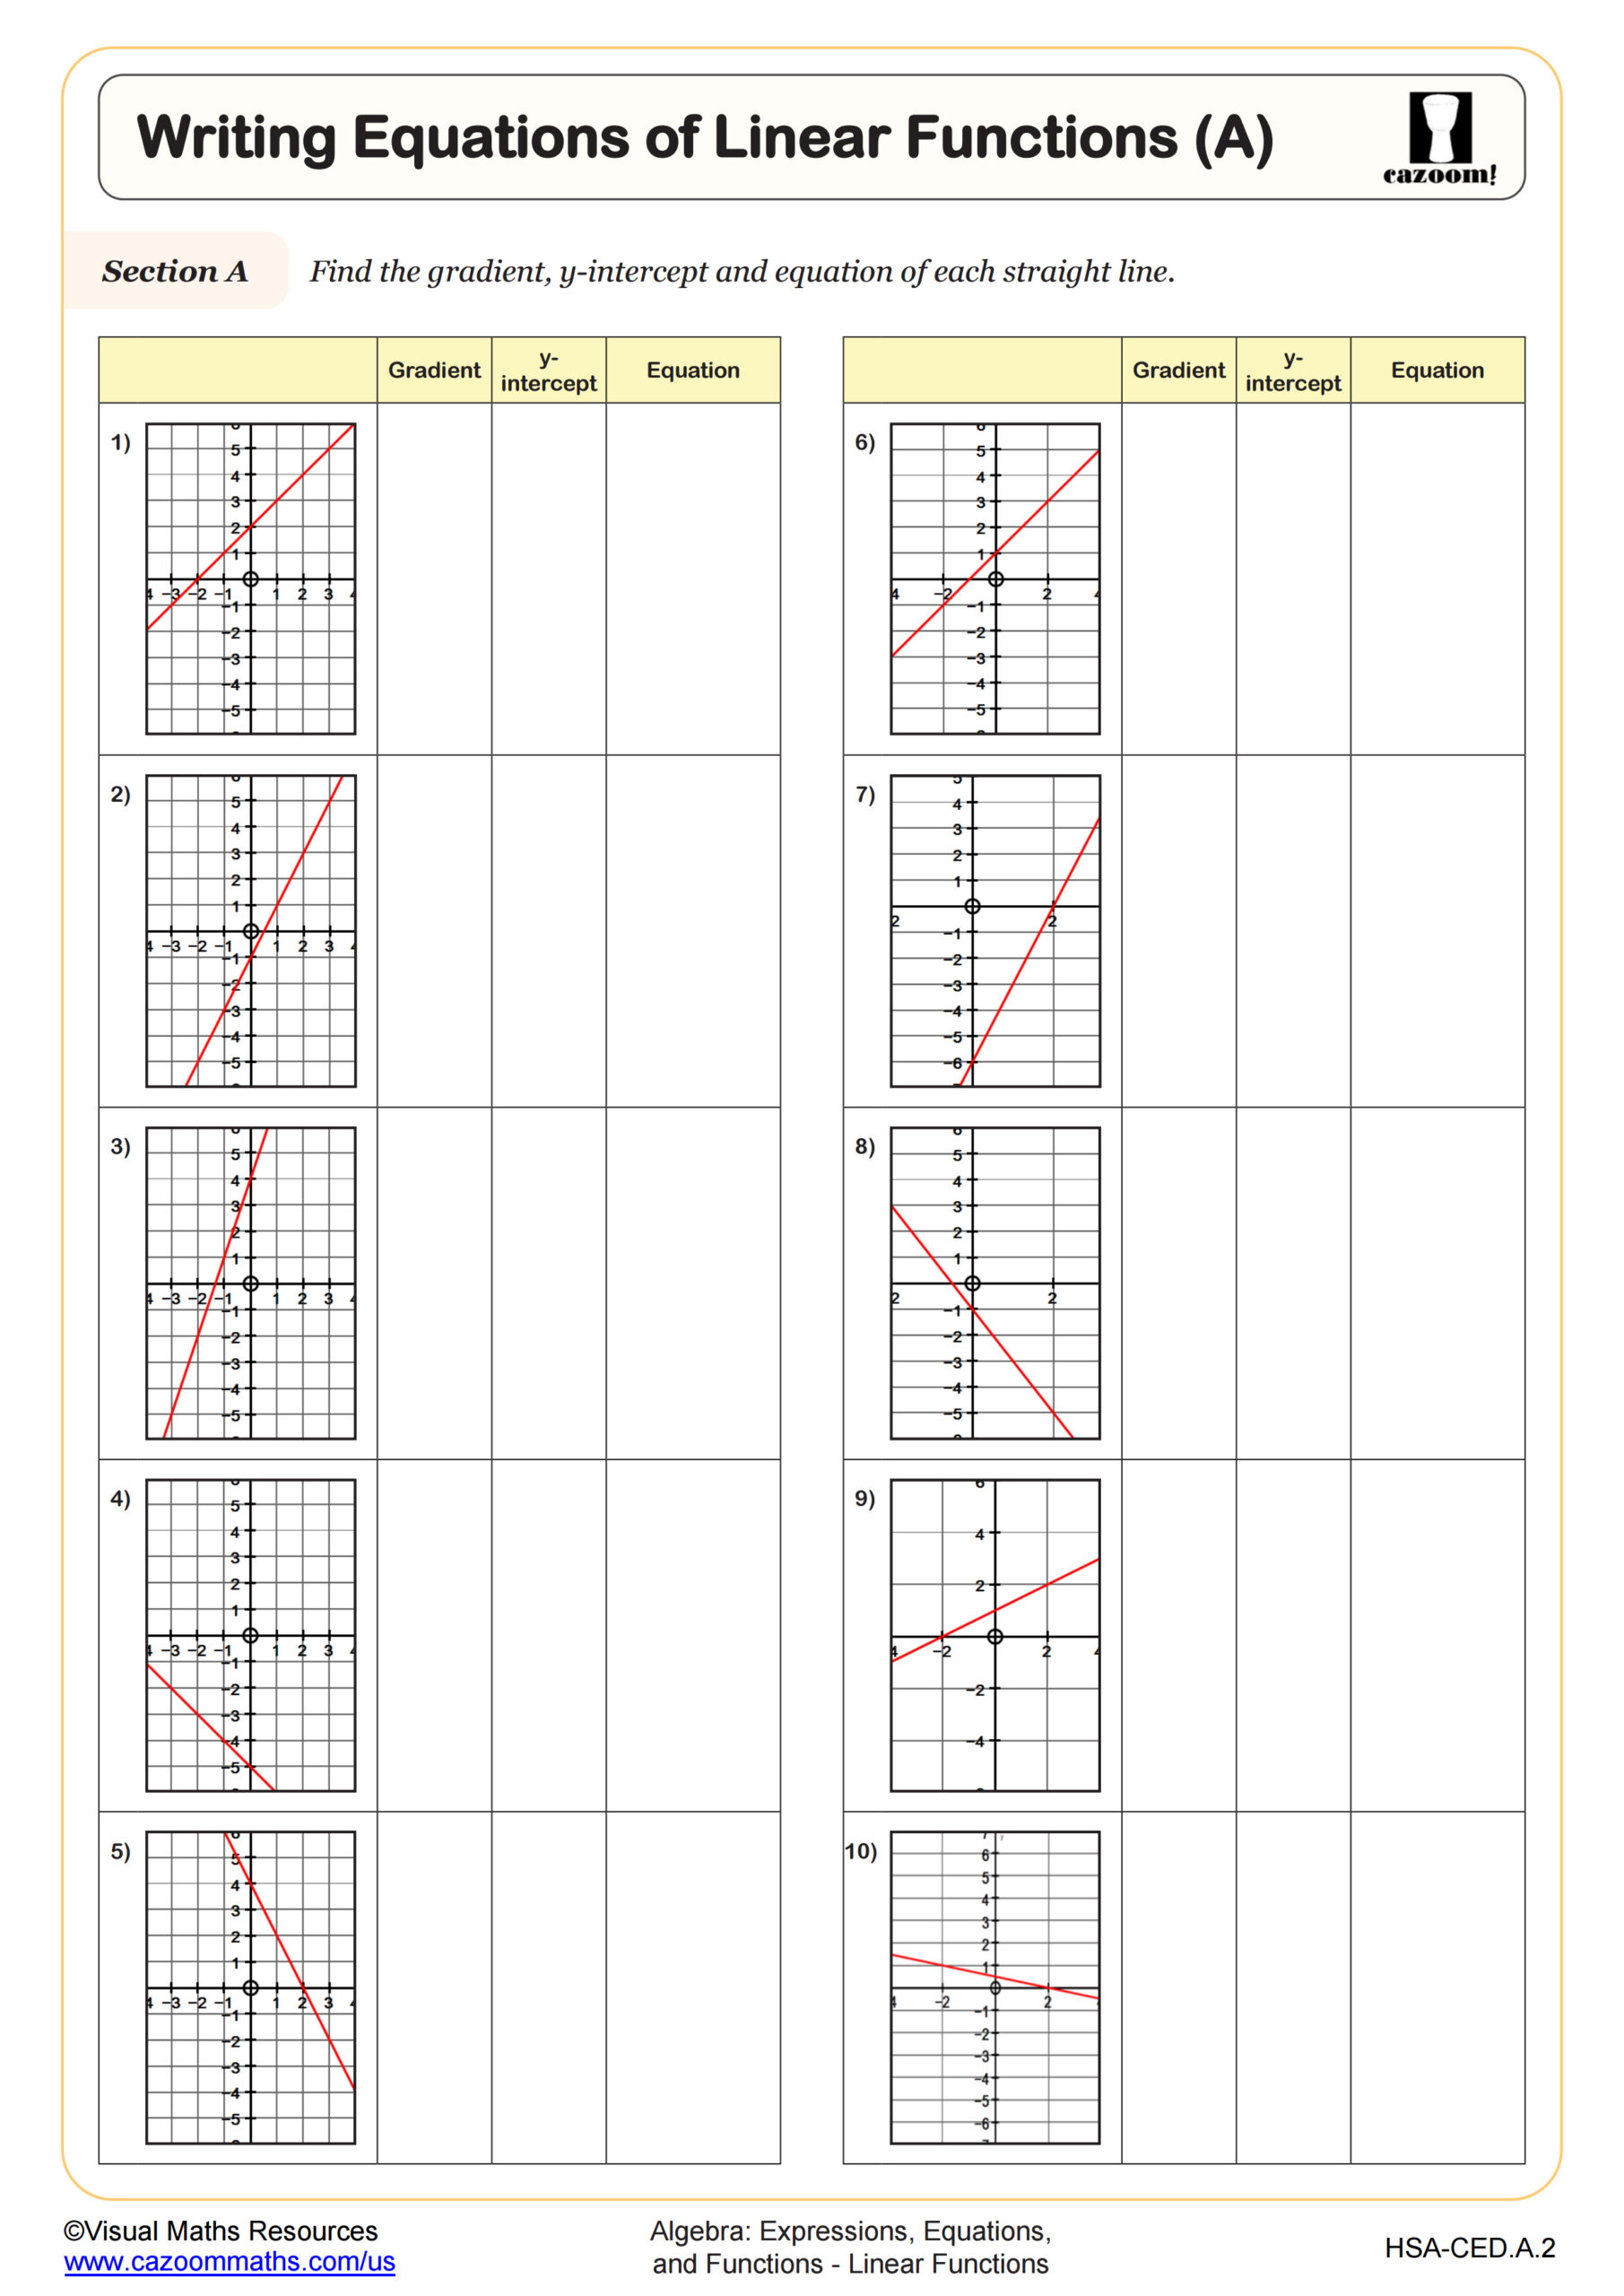
This worksheet encourages students to utilize graphing software such as desmos in order to investigate the y intercepts and slopes of linear functions. Broken down into three sections, learners will take a look at slopes and y intercepts separately before considering equations in form y = mx + b.
Students will make use of ‘sliders’ throughout their investigation, as well as using the software to generate tables of values.
By the end of their investigation, students will recognize the effect m and b have on y = mx + b including fractional and negative values, be able to complete a table of values using equations, and state the equations of lines from a table of values.
All worksheets are created by the team of experienced teachers at Cazoom Math.

RELATED TO Investigating Linear Functions WORKSHEET
Frequently Asked Questions
This worksheet is designed for Algebra I and IM 1 students who are ready to explore linear relationships in depth. The interactive nature of using graphing software makes abstract concepts more concrete for students at this level. The investigation builds foundational understanding that these students will use throughout their algebra studies.