Linear Equations and Tables of Values (A) WORKSHEET
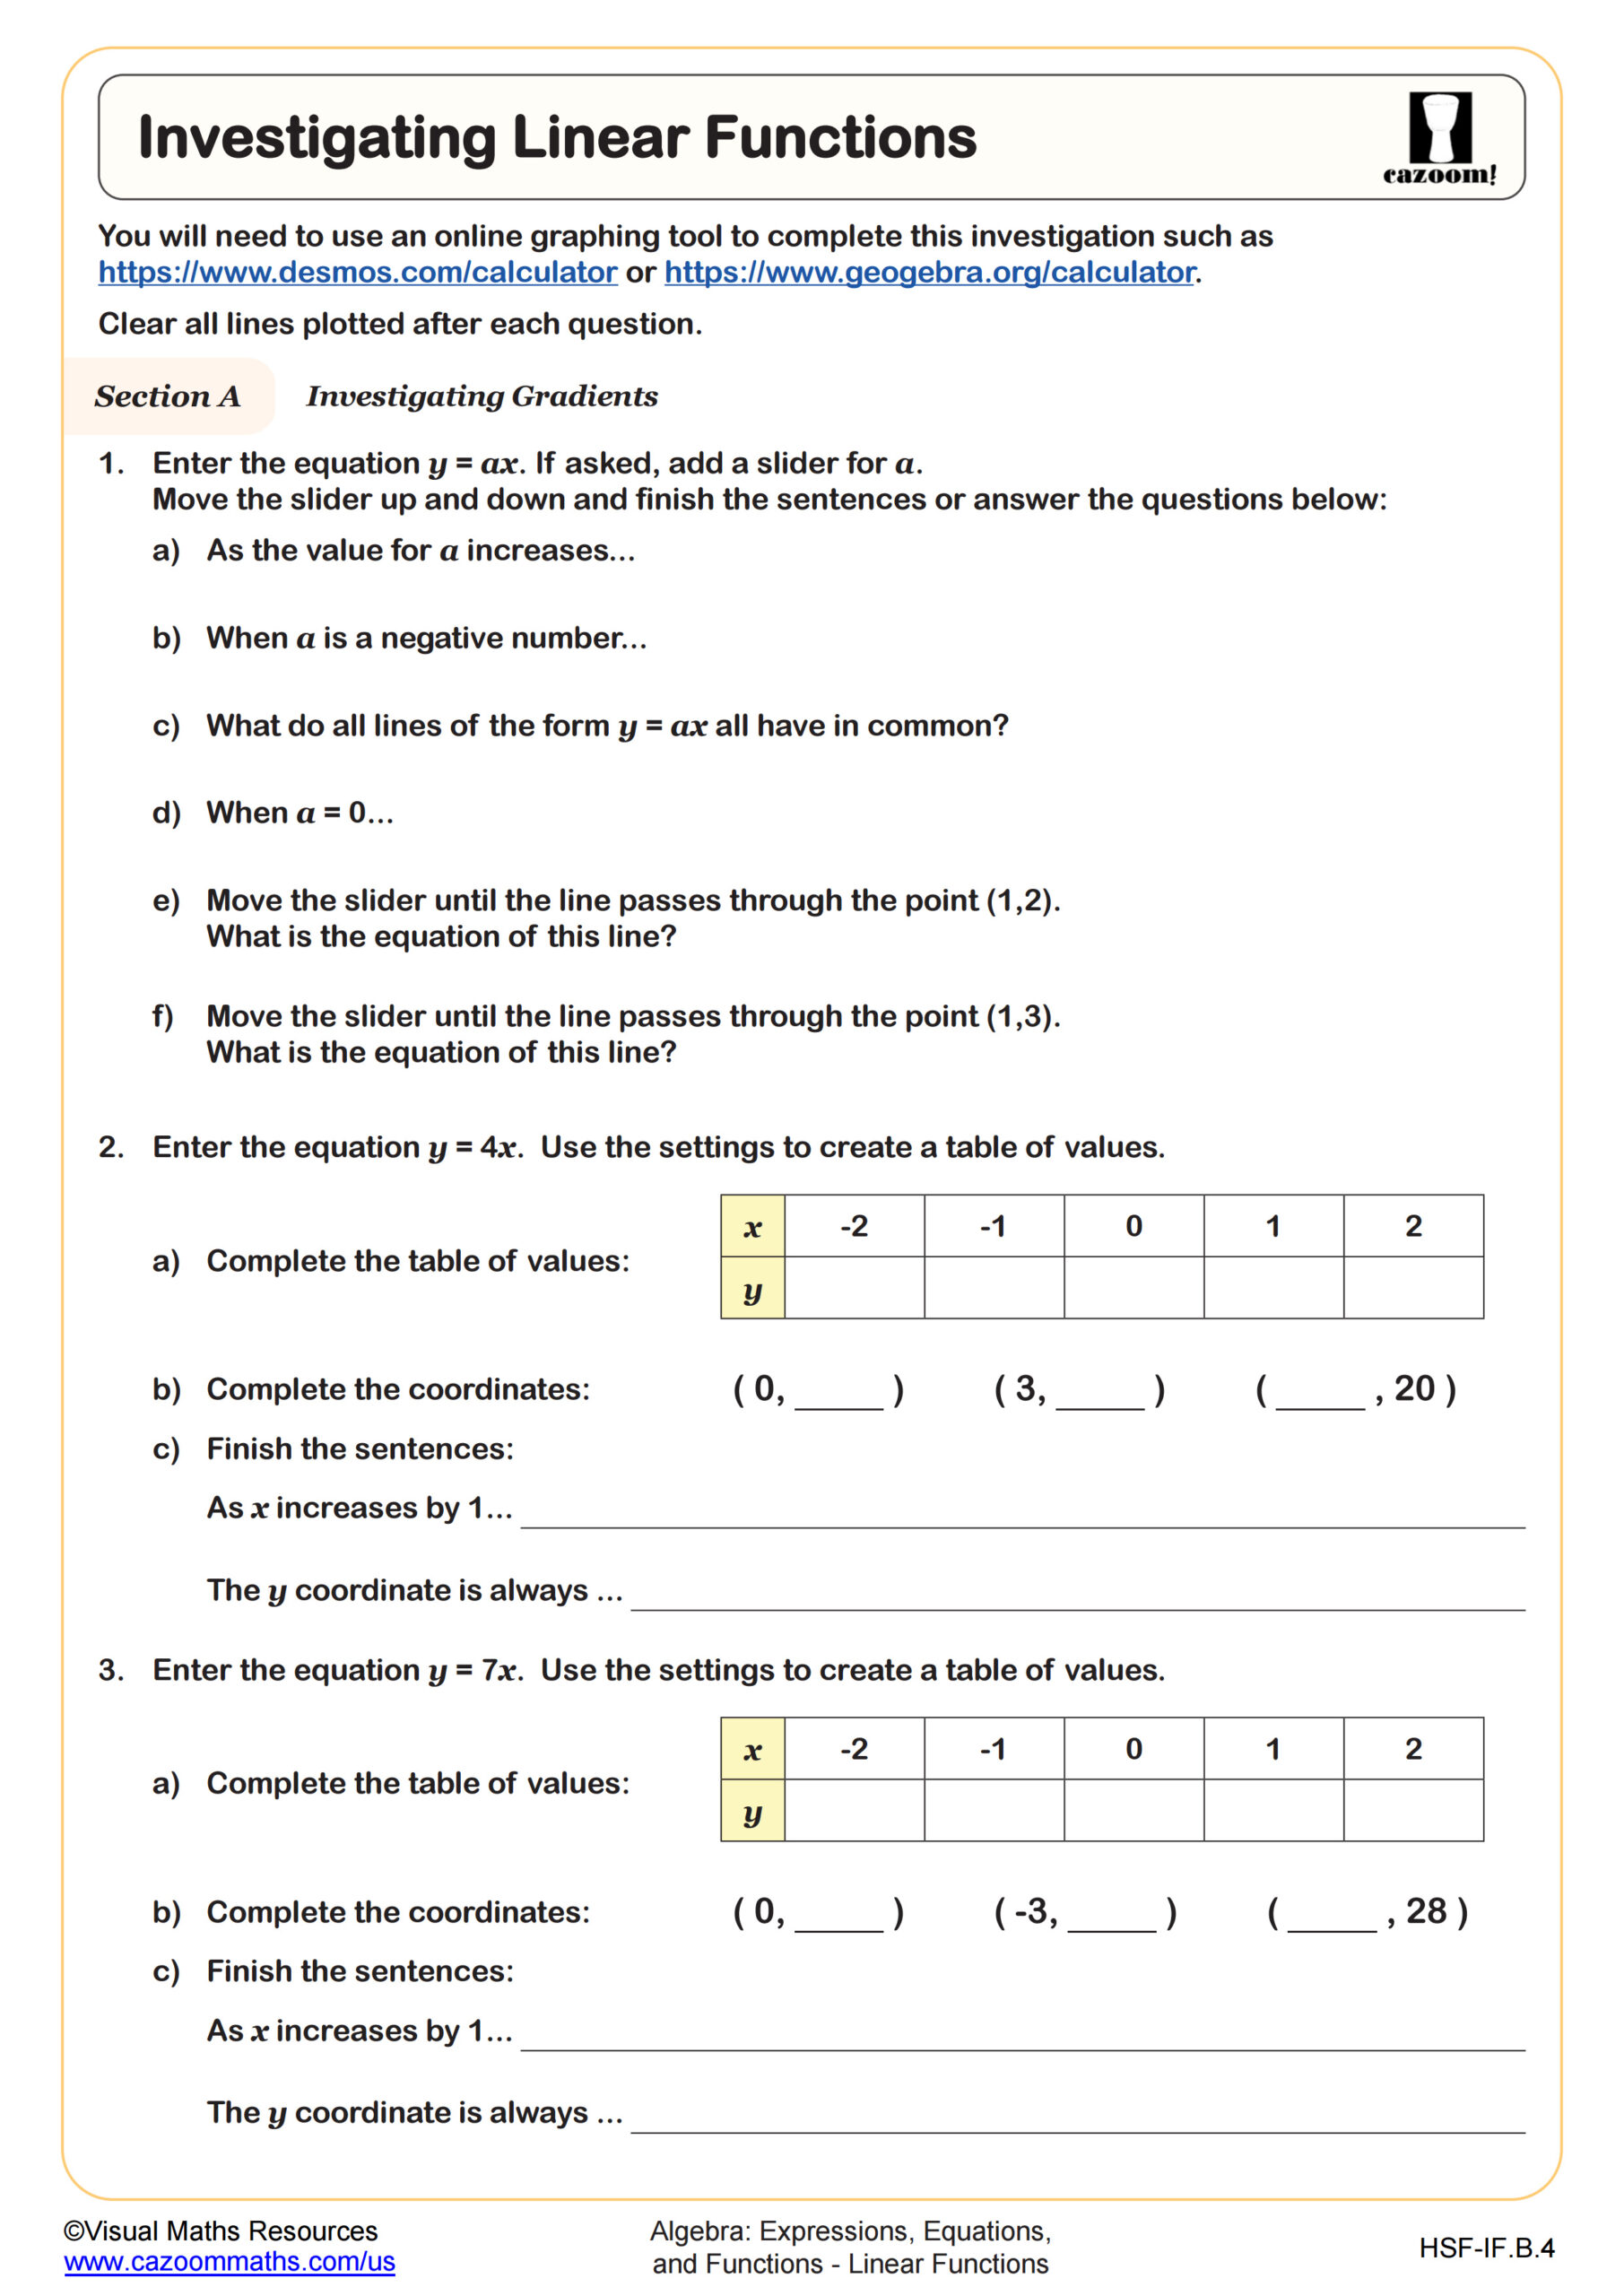
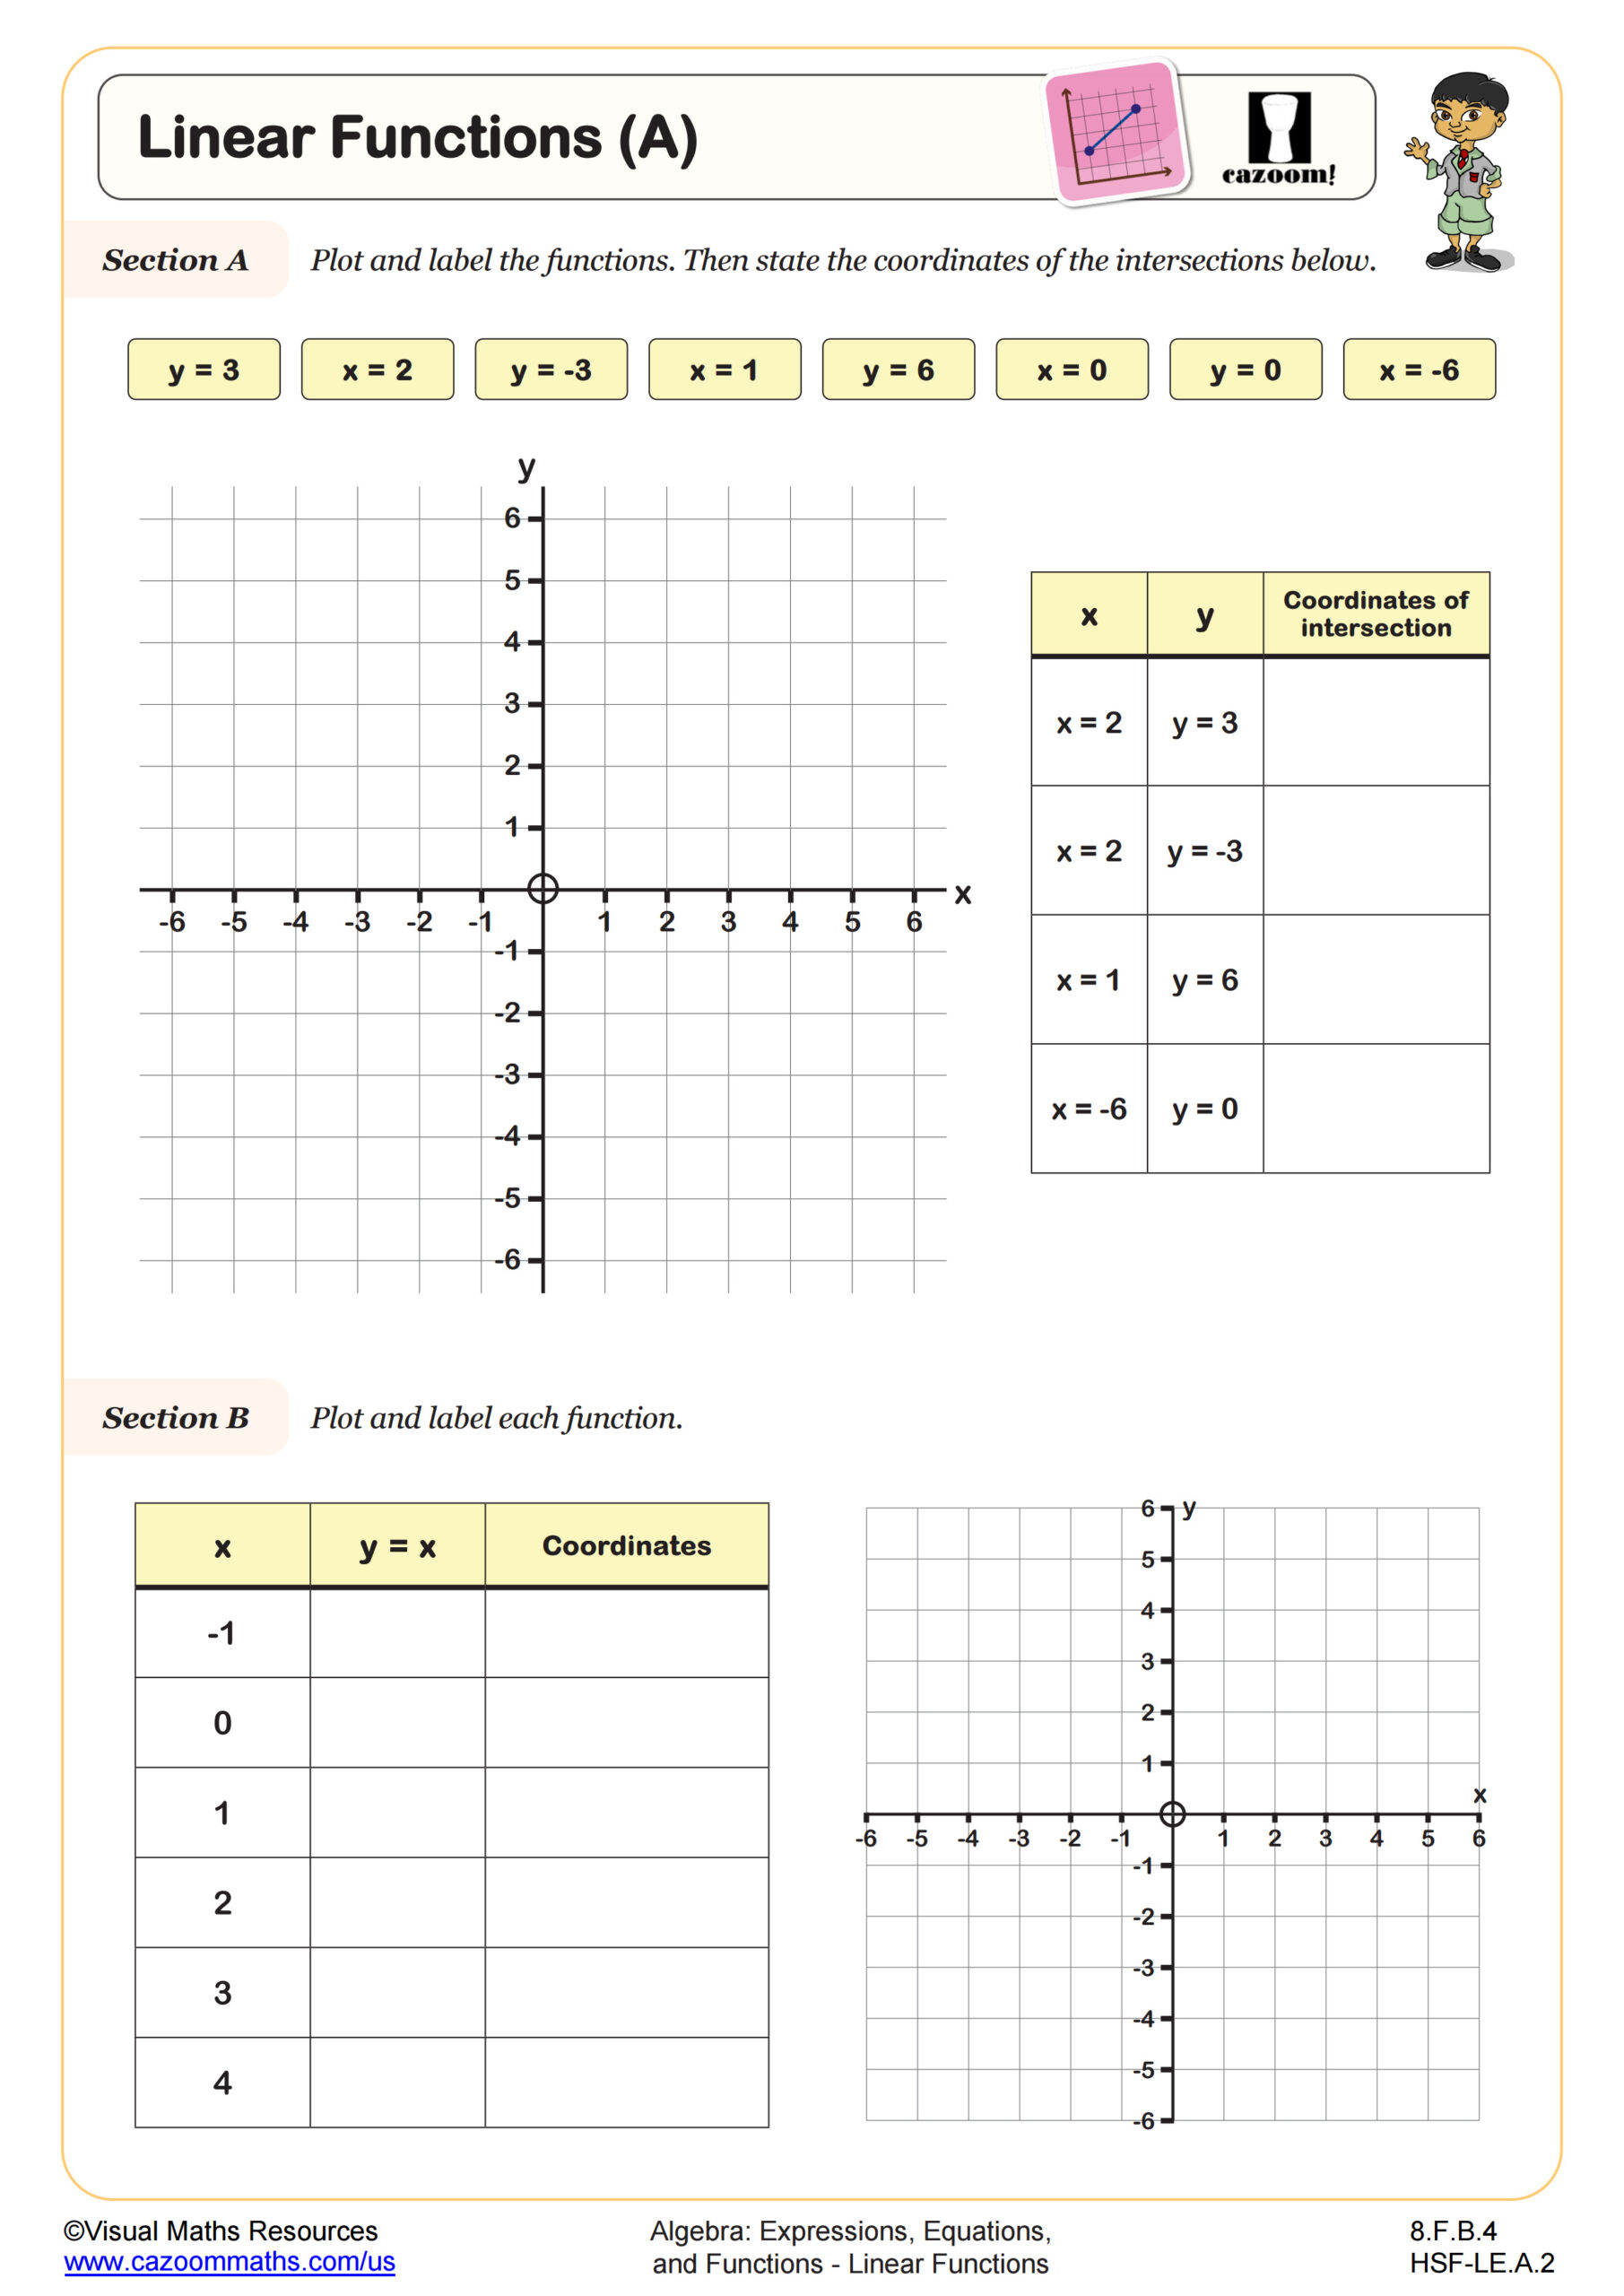
Construct linear and exponential functions, including arithmetic and geometric sequences, given a graph, a description of a relationship, or two input‑output pairs (include reading these from a table).
Linear Equations and Tables of Values (A) WORKSHEET DESCRIPTION
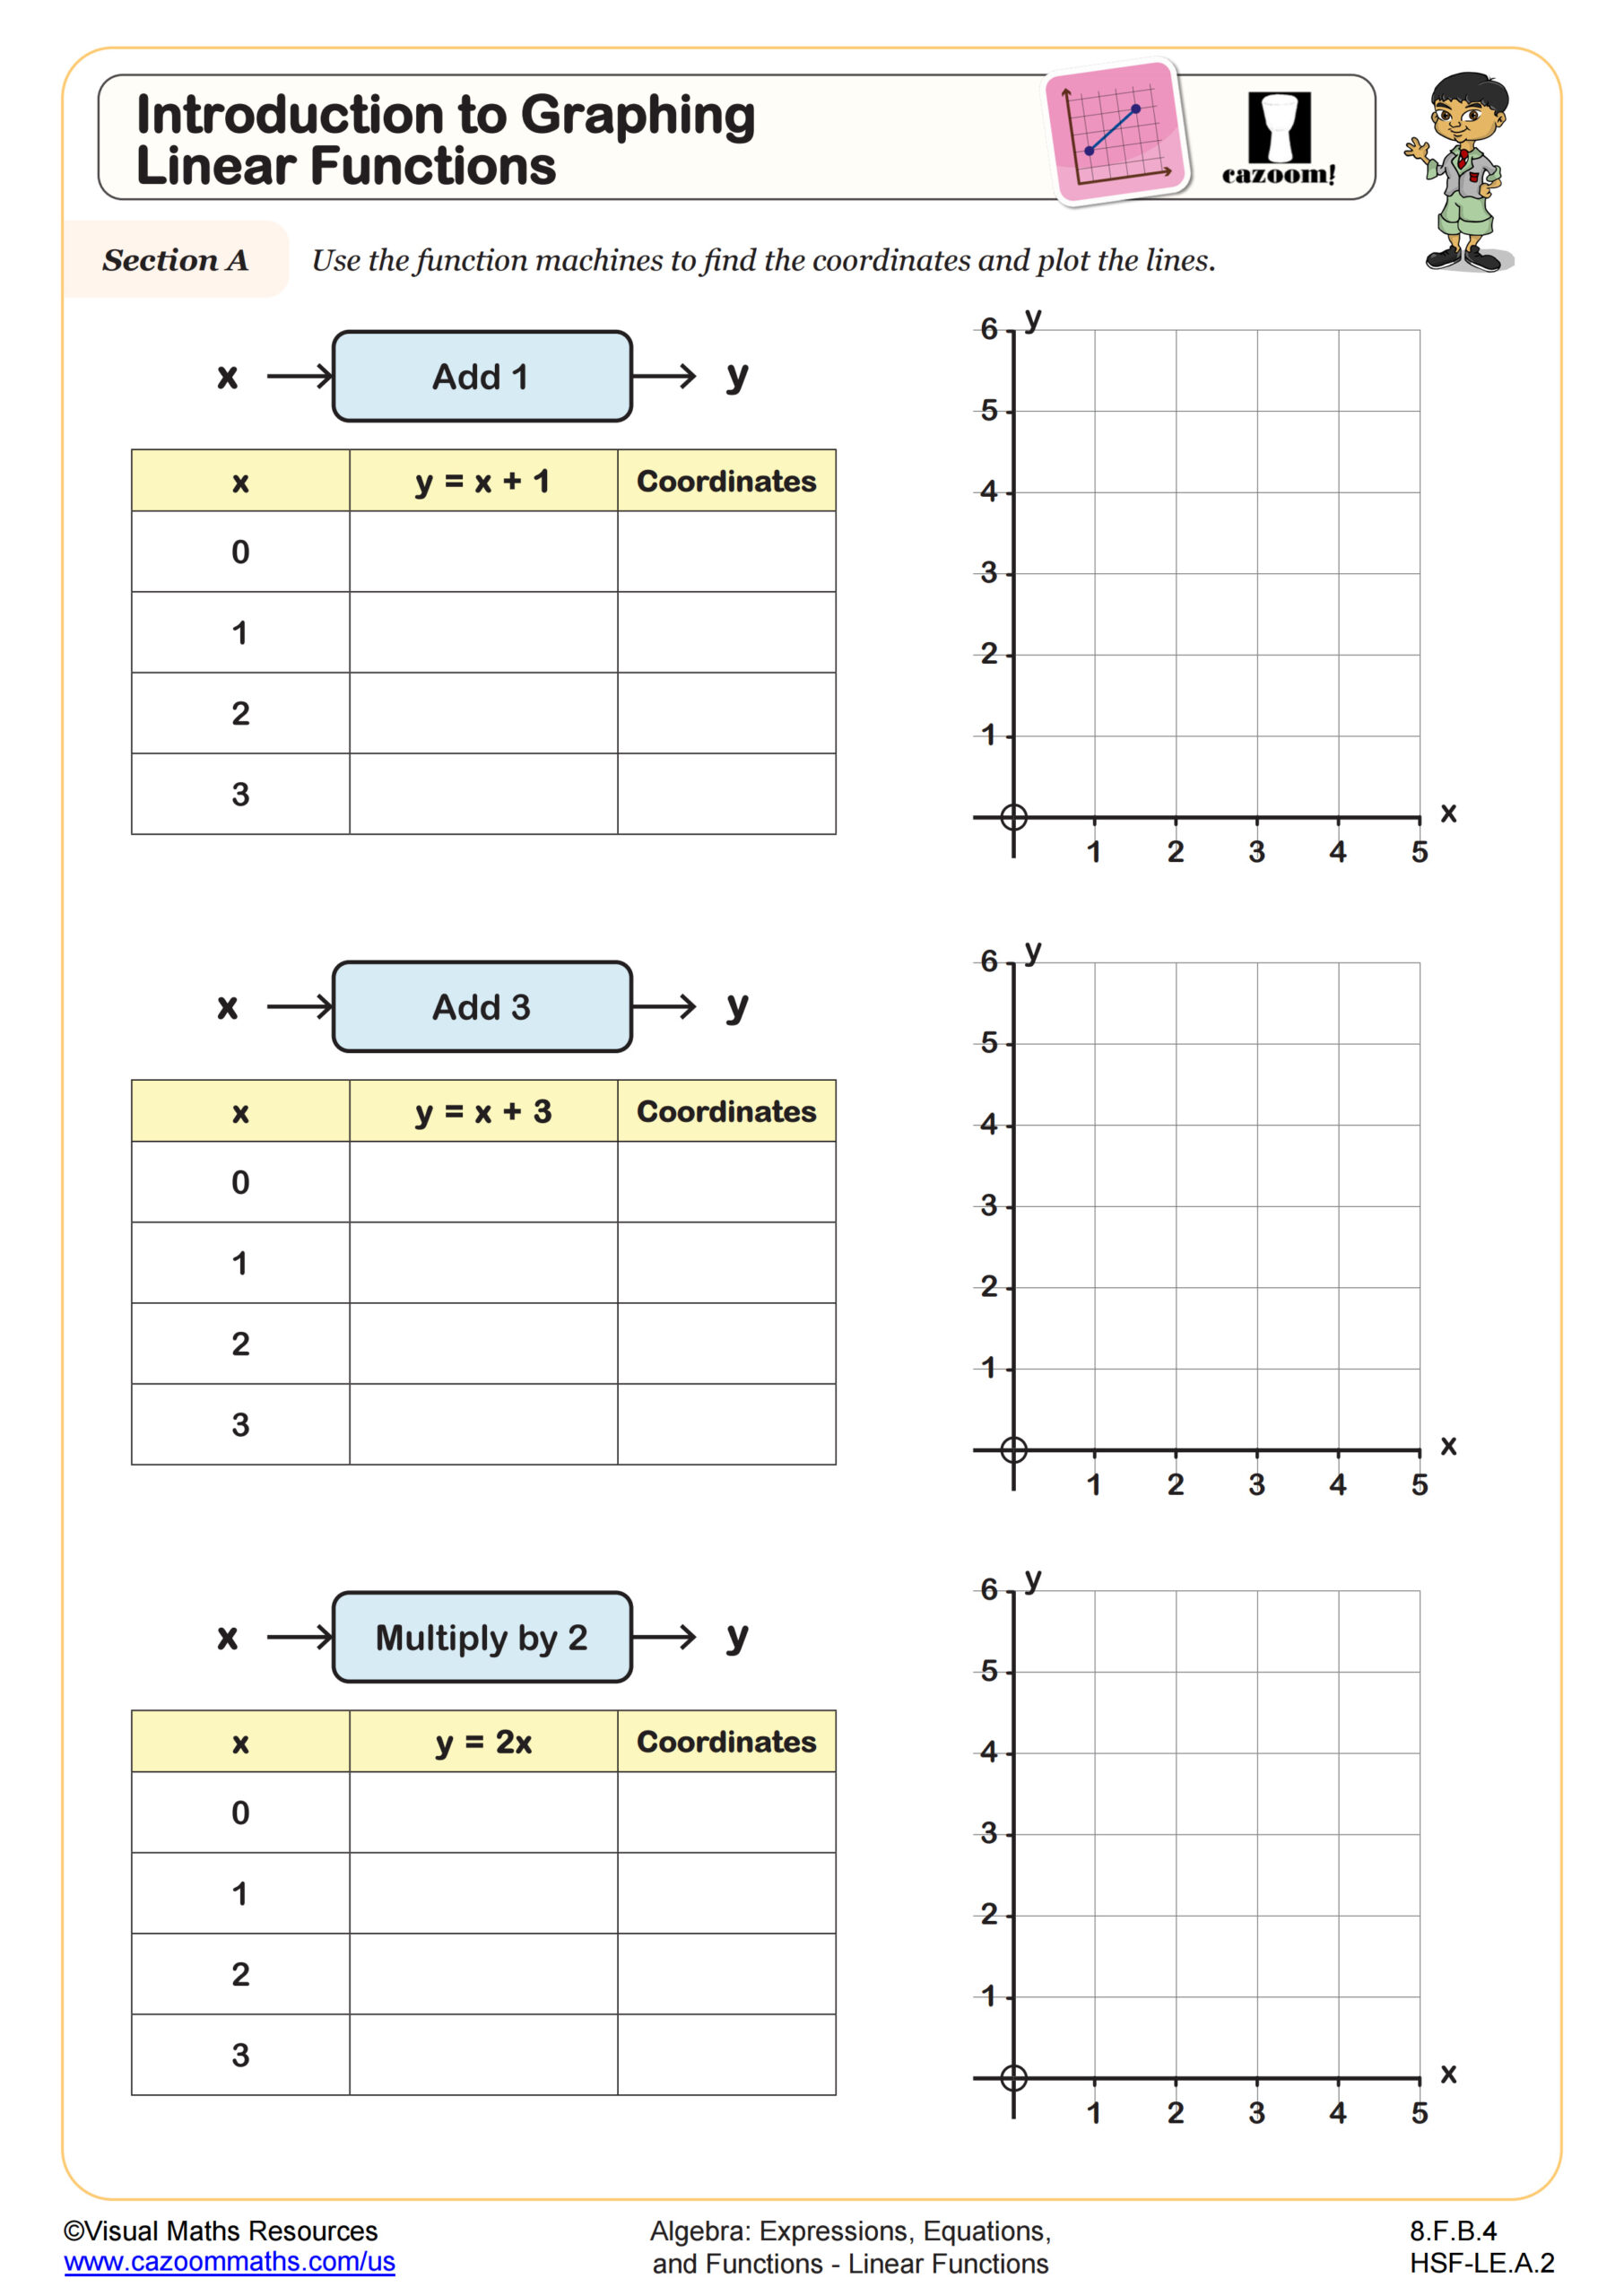
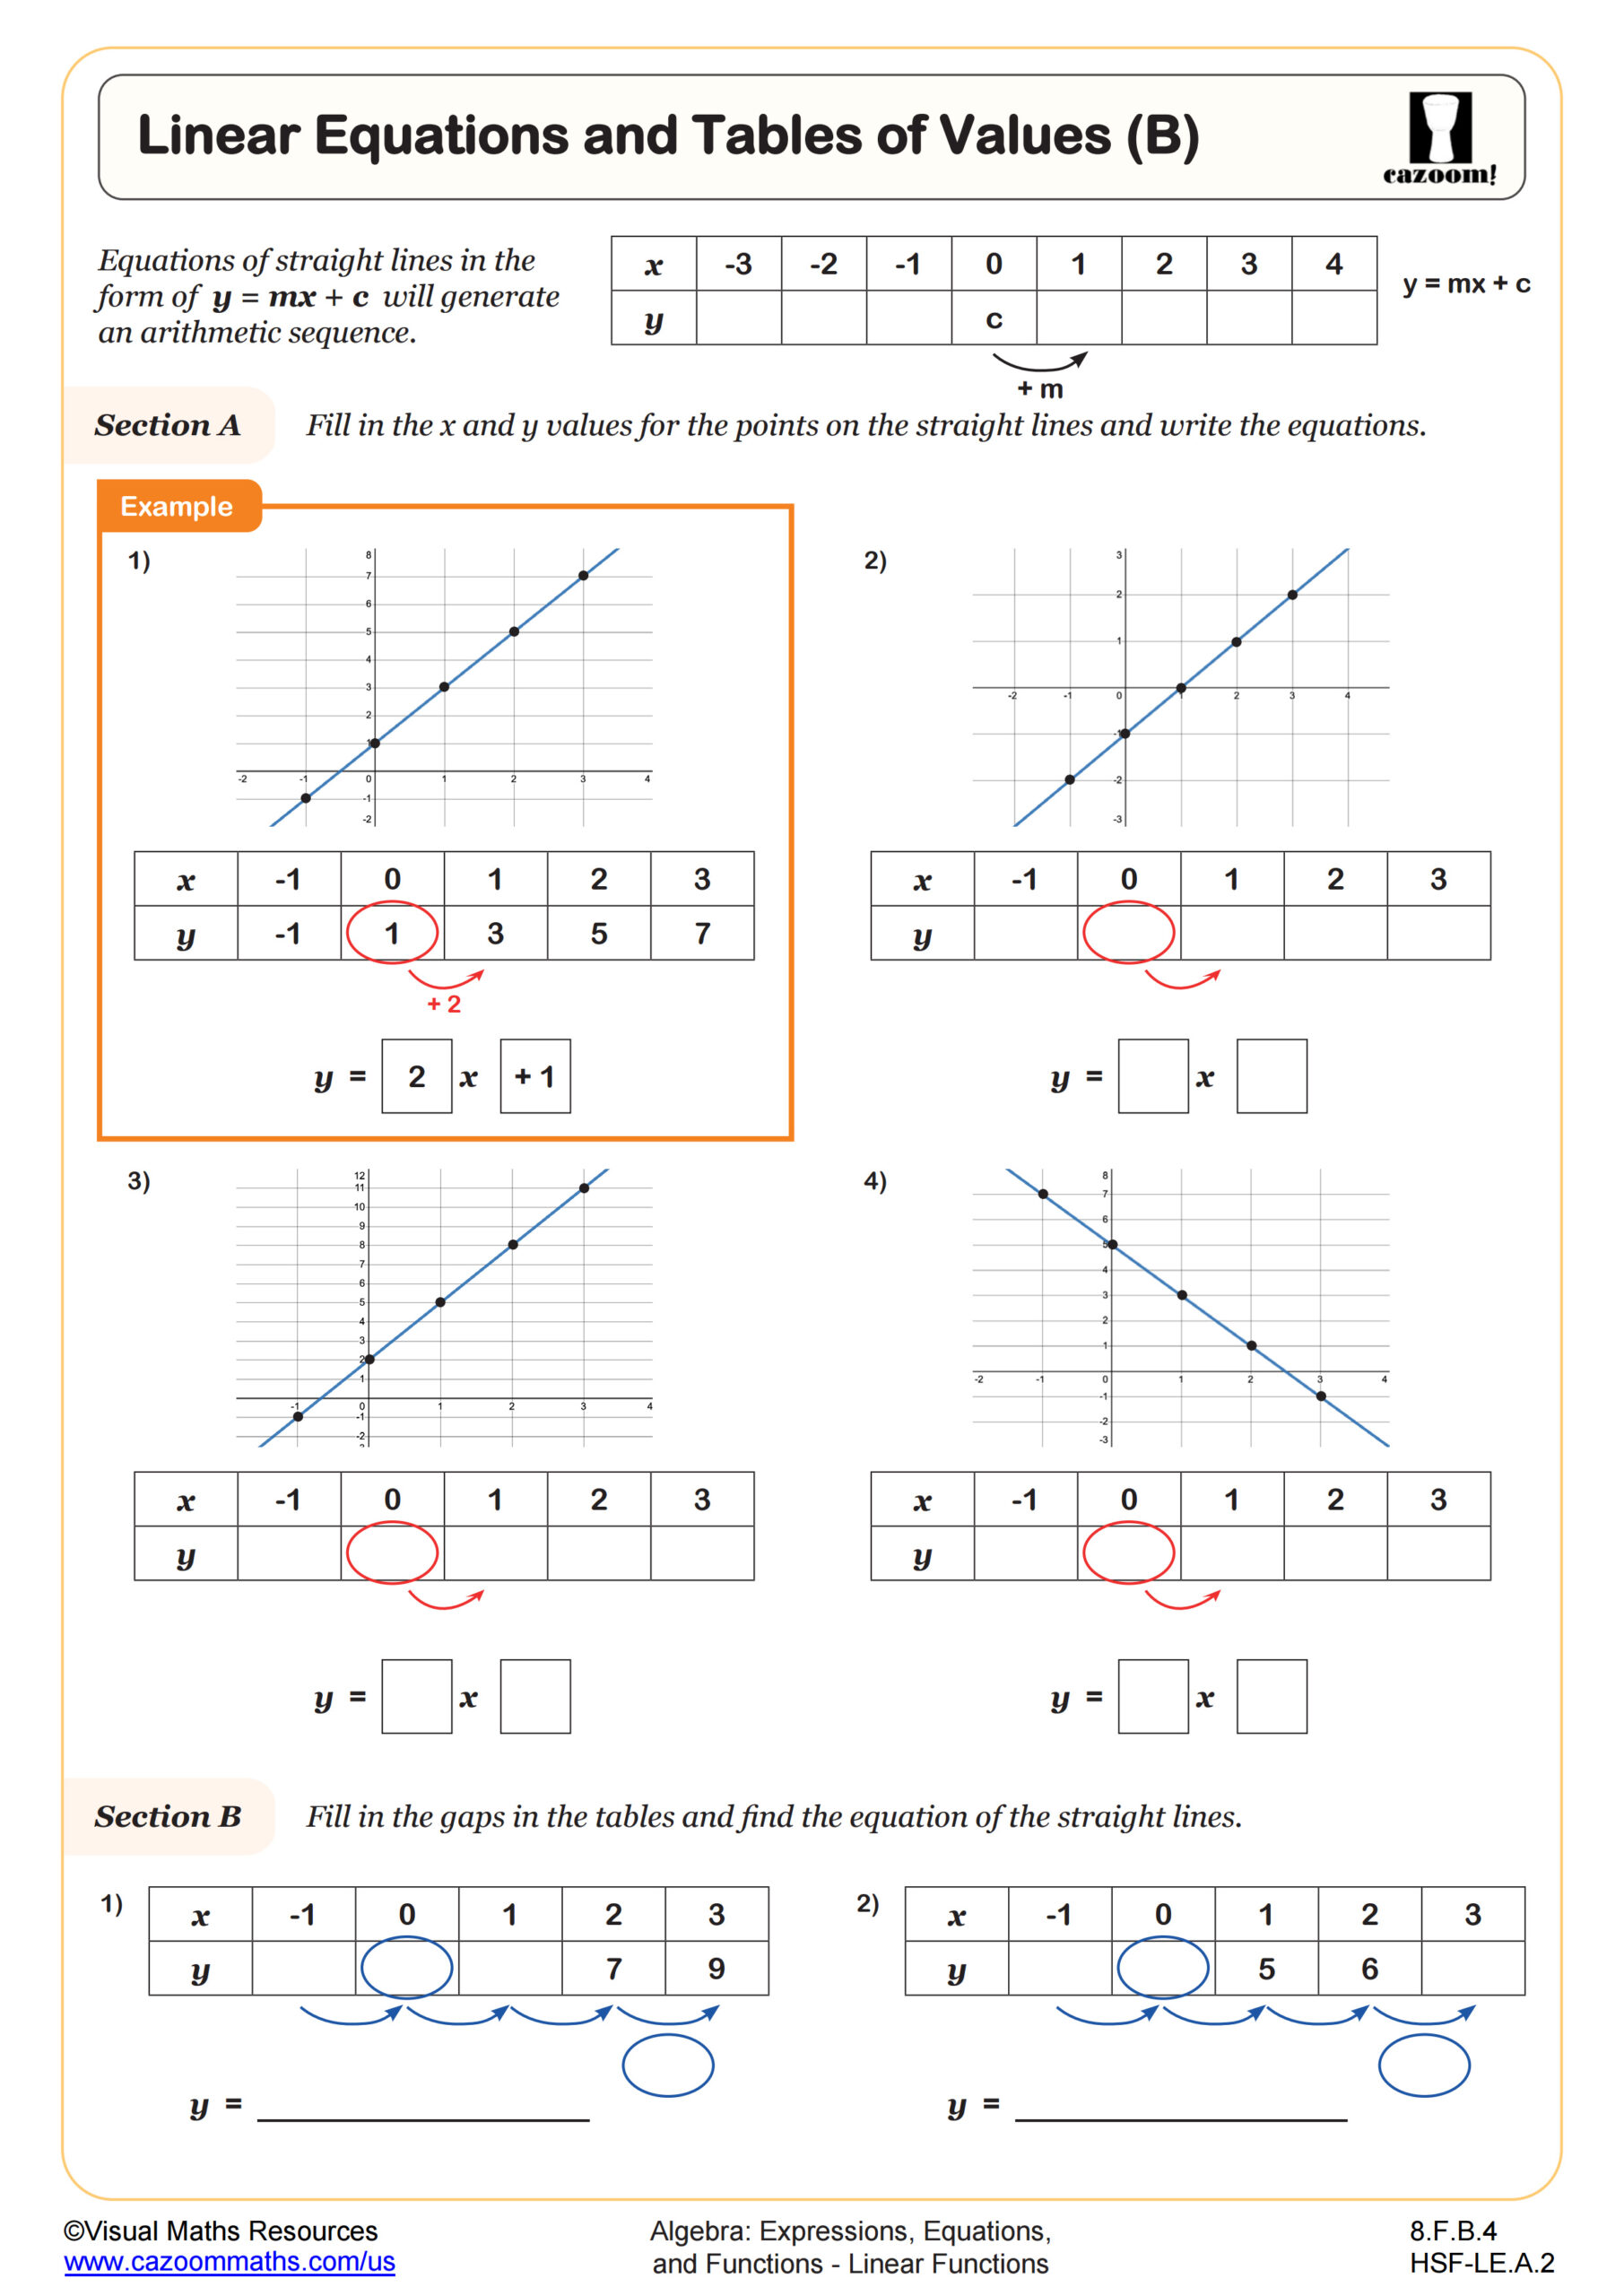
This worksheet gives a alternative view of straight line graphs equations in the form y=mx+b and their corresponding tables of values. Section A asks learners to complete xy-tables for given straight line equations but highlights the fact that the intercept, b, will be below x=0, and the slope, m, will be the common difference of the y-values generated. Section B then asks learners to work backwards and use the facts from section A to write the equations of the lines from their xy-tables.
All worksheets are created by the team of experienced teachers at Cazoom Math.
")
RELATED TO Linear Equations and Tables of Values (A) WORKSHEET
Frequently Asked Questions
Instead of focusing on plotting points and drawing lines, this worksheet emphasizes the connection between the algebraic form y=mx+b and numerical patterns in tables. Students discover that the slope m appears as the consistent difference between consecutive y-values, while the y-intercept b shows up when extending the pattern to x=0, helping them see these concepts numerically rather than just visually.