Linear Functions: y = x + c WORKSHEET
Construct a function to model a linear relationship between two quantities. Determine the rate of change and initial value of the function from a description of a relationship or from two (x, y) values, including reading these from a table or from a graph. Interpret the rate of change and initial value of a linear function in terms of the situation it models, and in terms of its graph or a table of values.
Linear Functions: y = x + c WORKSHEET DESCRIPTION
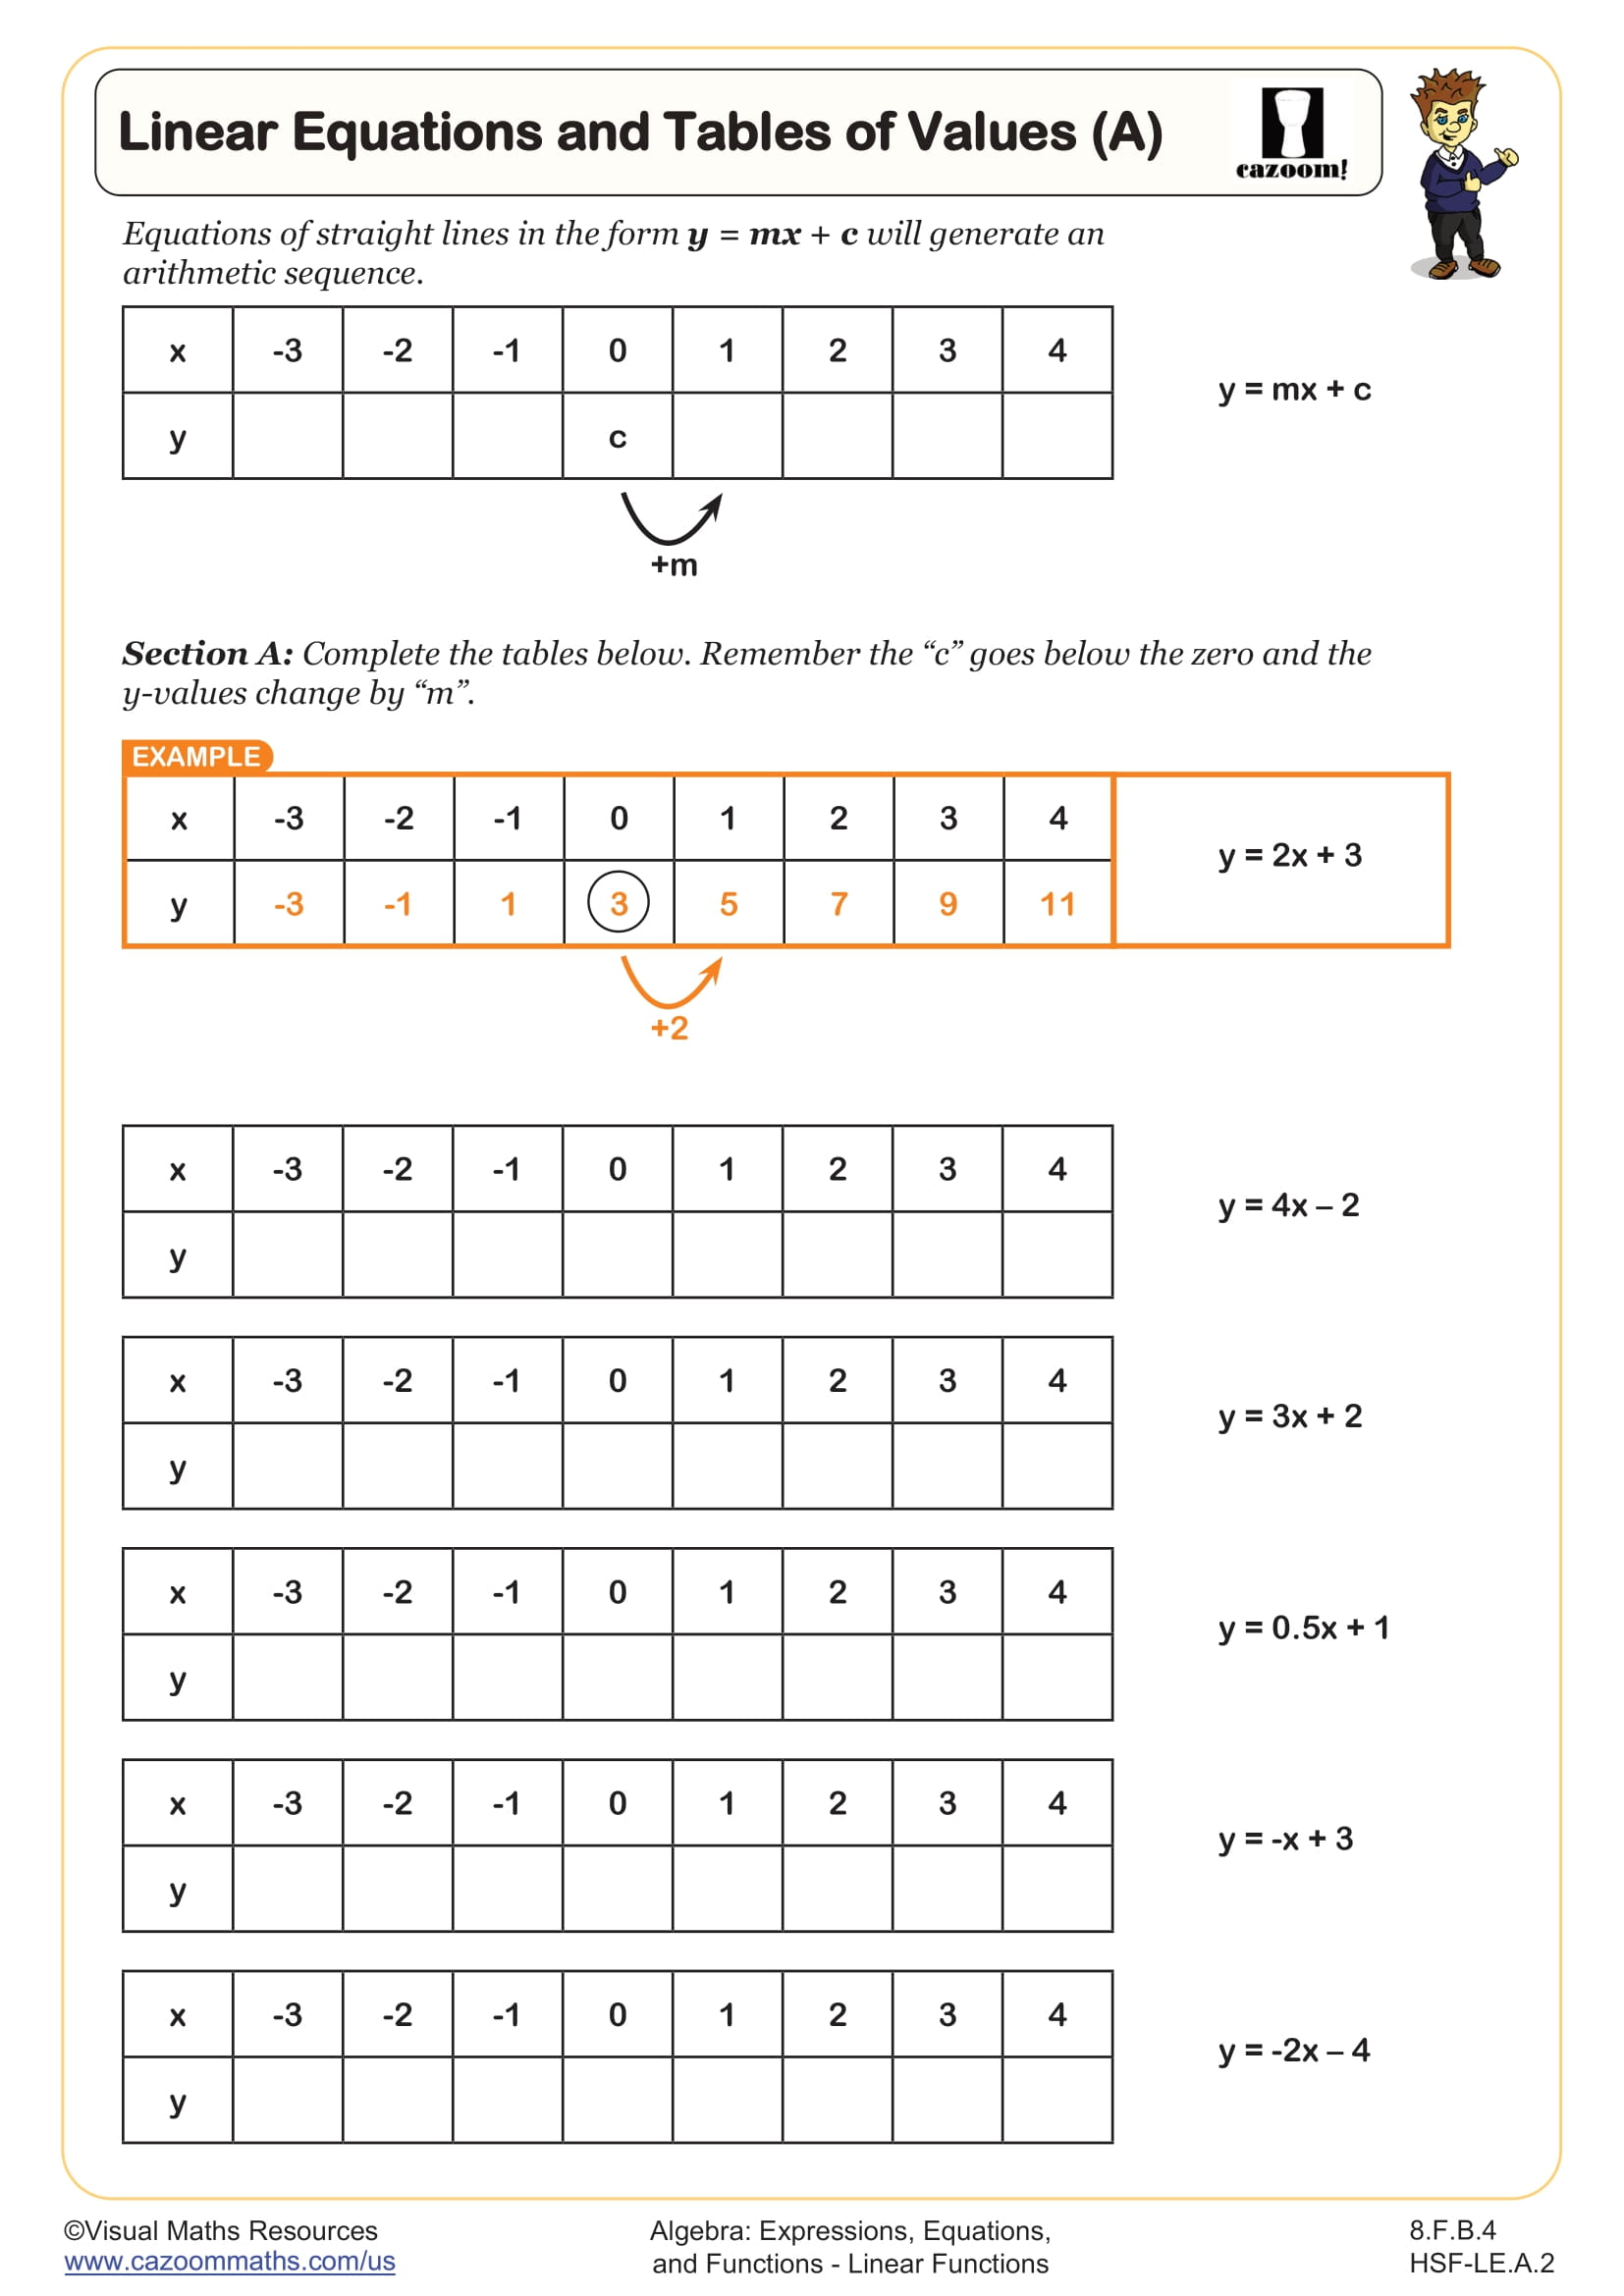
This worksheet on linear functions provides an exploration of graphing and interpreting straight lines in the form y = x + c.
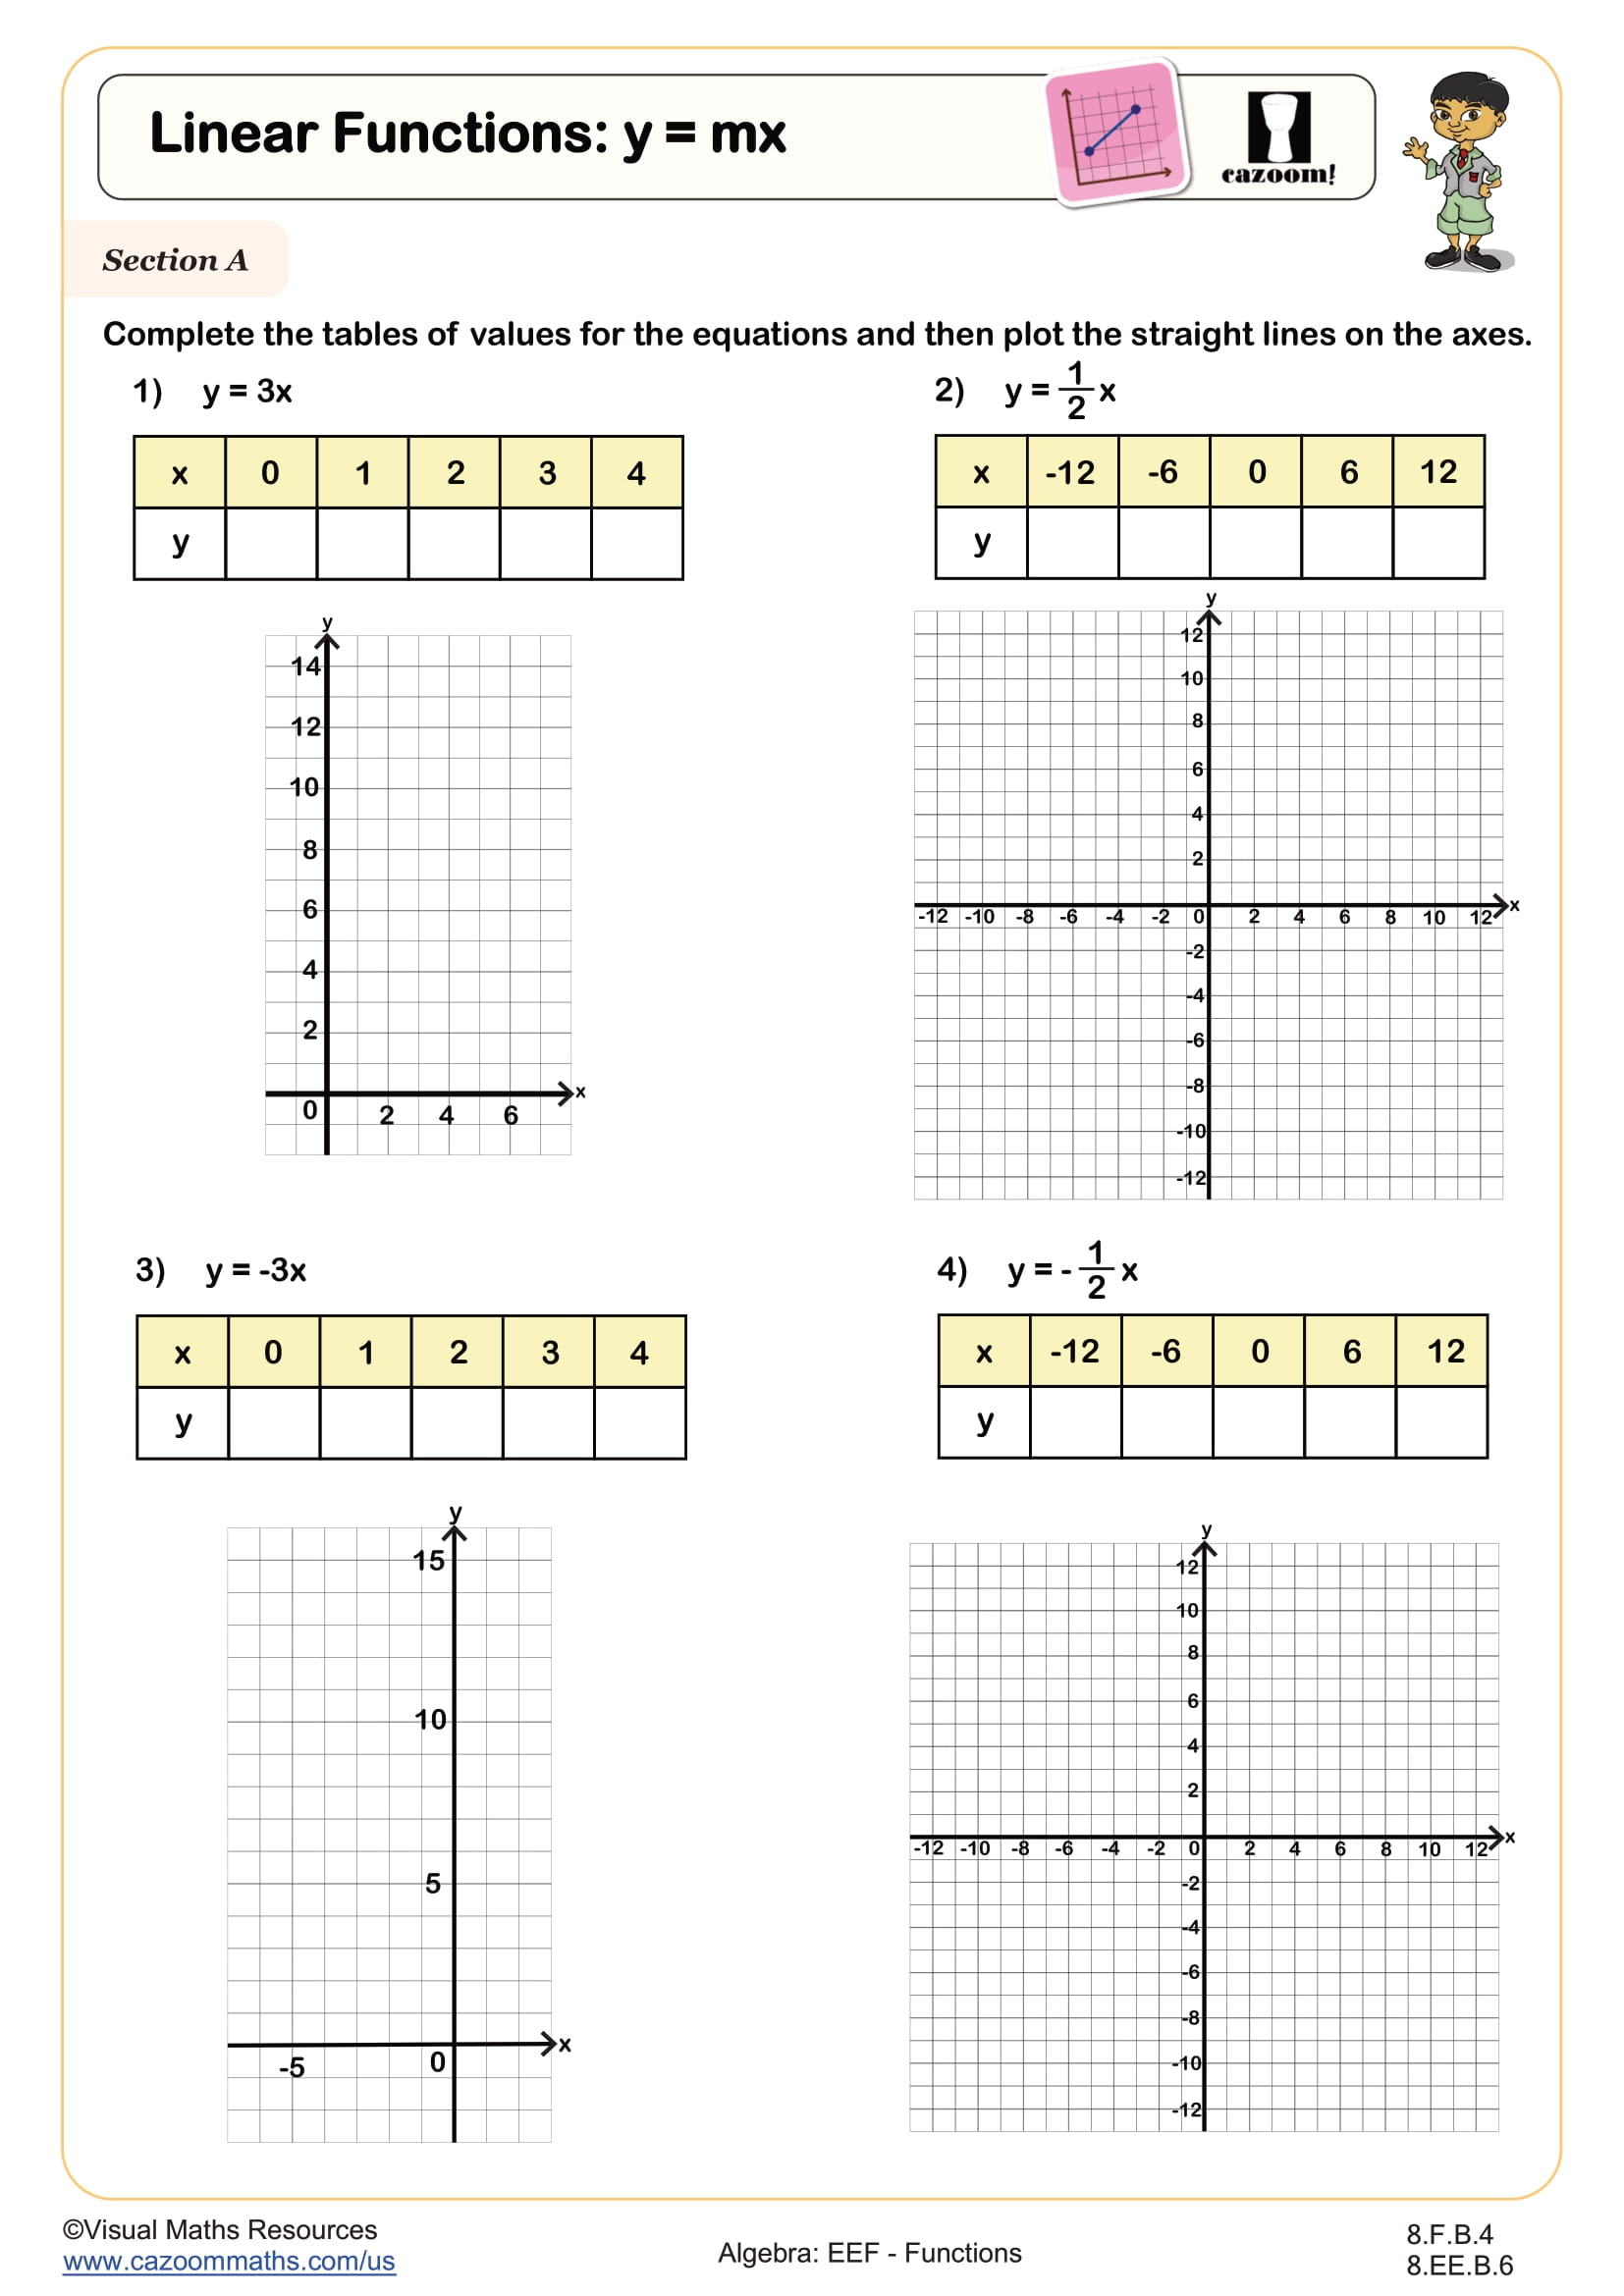
In Section A, learners will complete tables of values for linear equations and plot them on graphs.
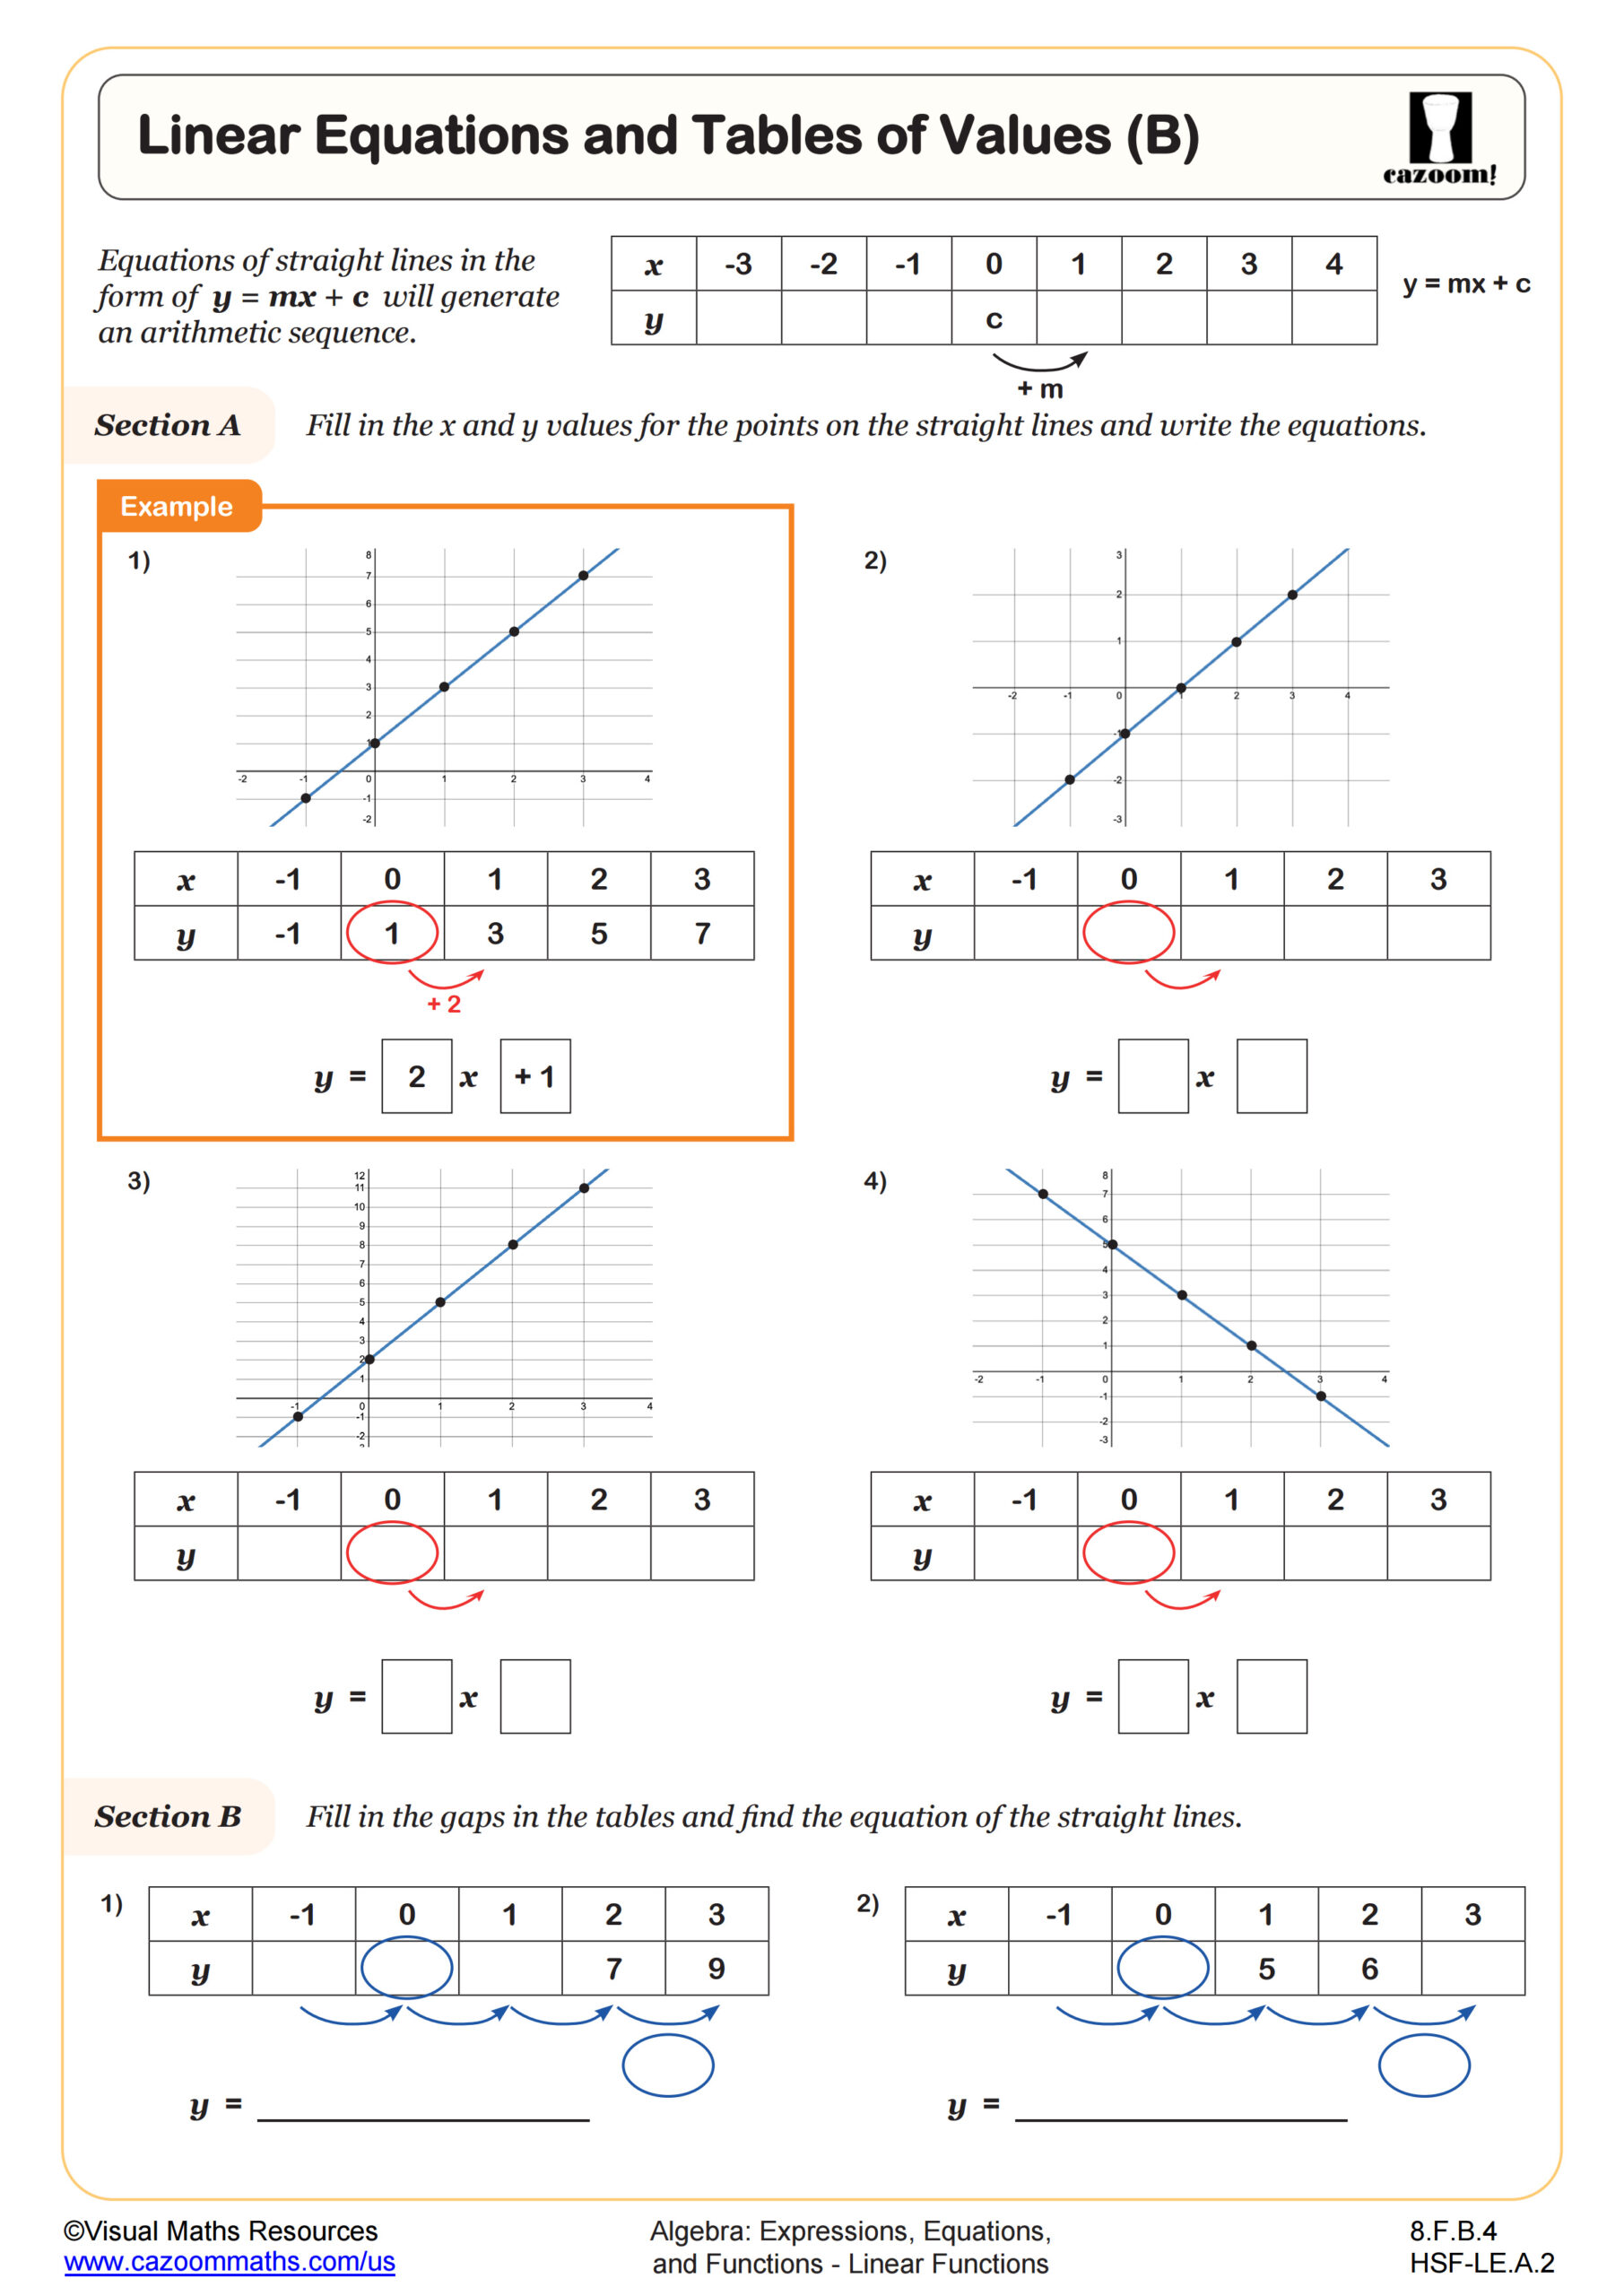
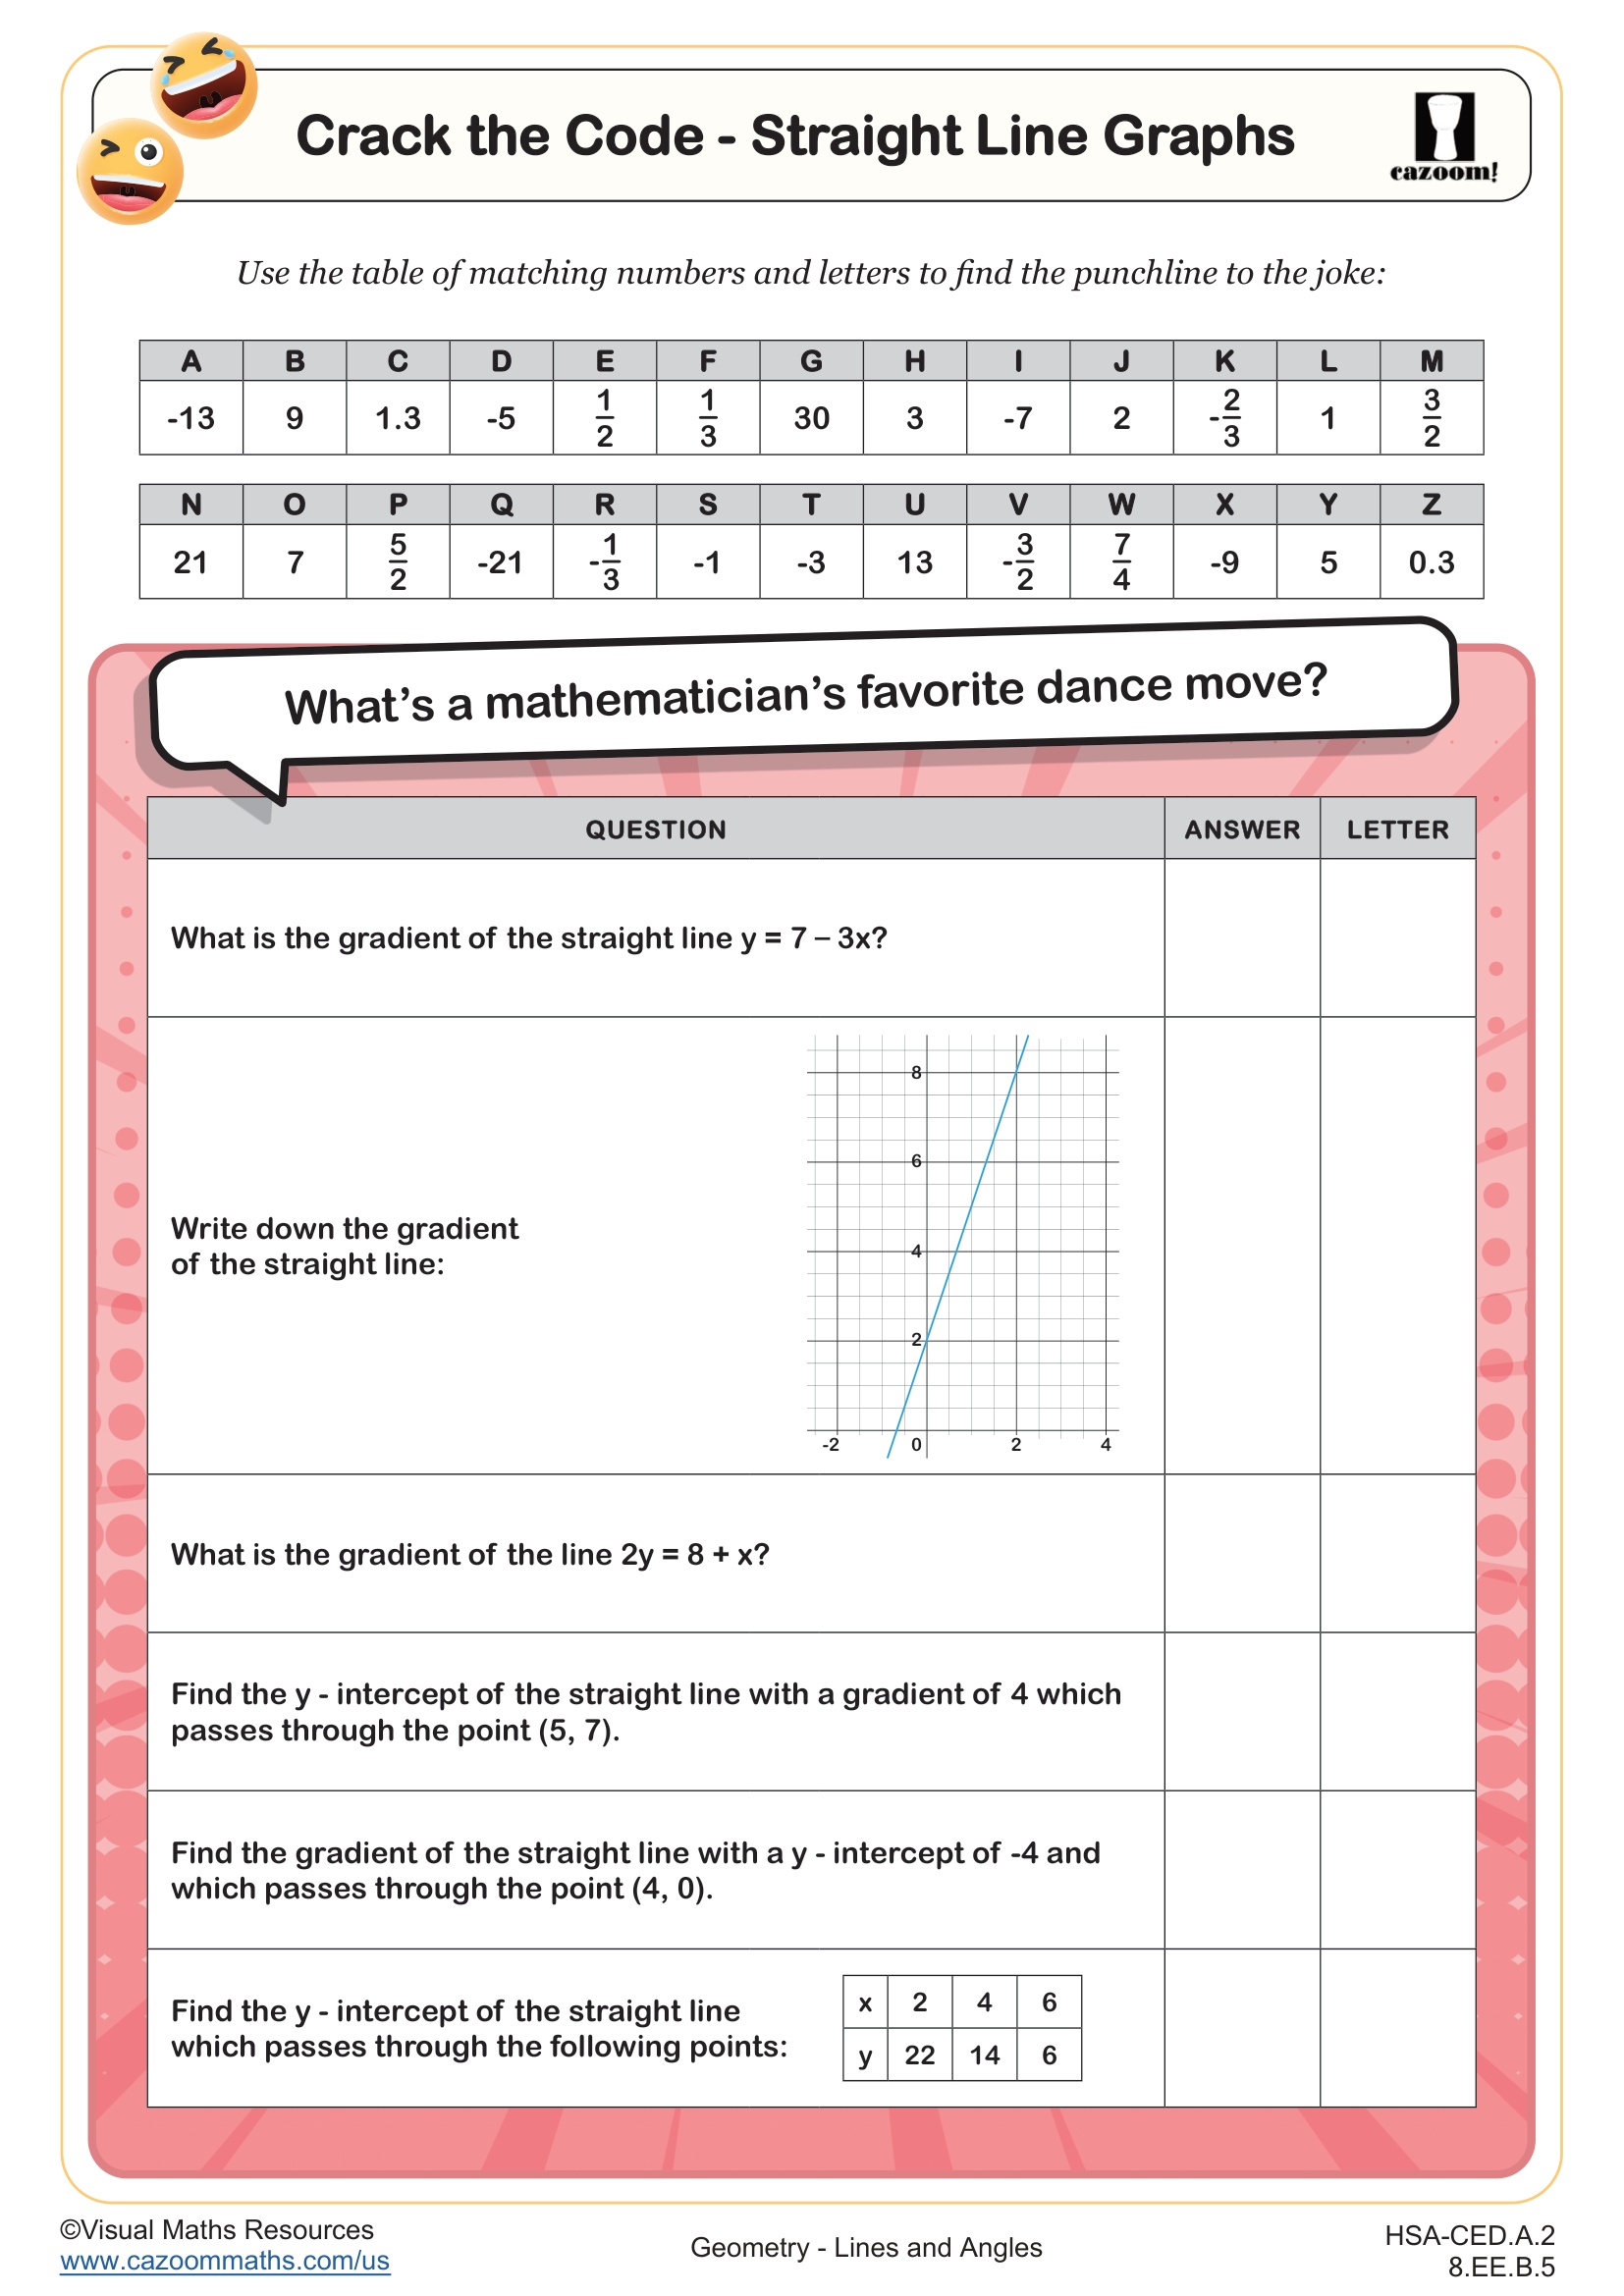
Section B challenges students to identify y-intercepts and write the corresponding linear equations, reinforcing their understanding of how changes in equations affect graphs. Section C builds on this by having students use tables of values to derive equations.
Finally, Section D pushes students further, asking them to find the equations of lines passing through three pairs of points, encouraging problem-solving and application of key concepts.
All worksheets are created by the team of experienced teachers at Cazoom Math.

RELATED TO Linear Functions: y = x + c WORKSHEET
Frequently Asked Questions
This worksheet is specifically designed for 8th grade students who are learning about functions. At this level, students are ready to explore the relationship between algebraic equations and their graphical representations, making it perfect for building foundational skills with linear functions in the form y = x + c.