Back to:
Mode and Range WORKSHEET
Suitable for Grades: 6th Grade, Algebra I
CCSS: 6.SP.B.5, HSS.ID.A.2
CCSS Description: Summarize numerical data sets in relation to their context, such as by: a. Reporting the number of observations. b. Describing the nature of the attribute under investigation, including how it was measured and its units of measurement. c. Giving quantitative measures of center (median and/or mean) and variability (interquartile range and/or mean absolute deviation), as well as describing any overall pattern and any striking deviations from the overall pattern with reference to the context in which the data were gathered. d. Relating the choice of measures of center and variability to the shape of the data distribution and the context in which the data were gathered.
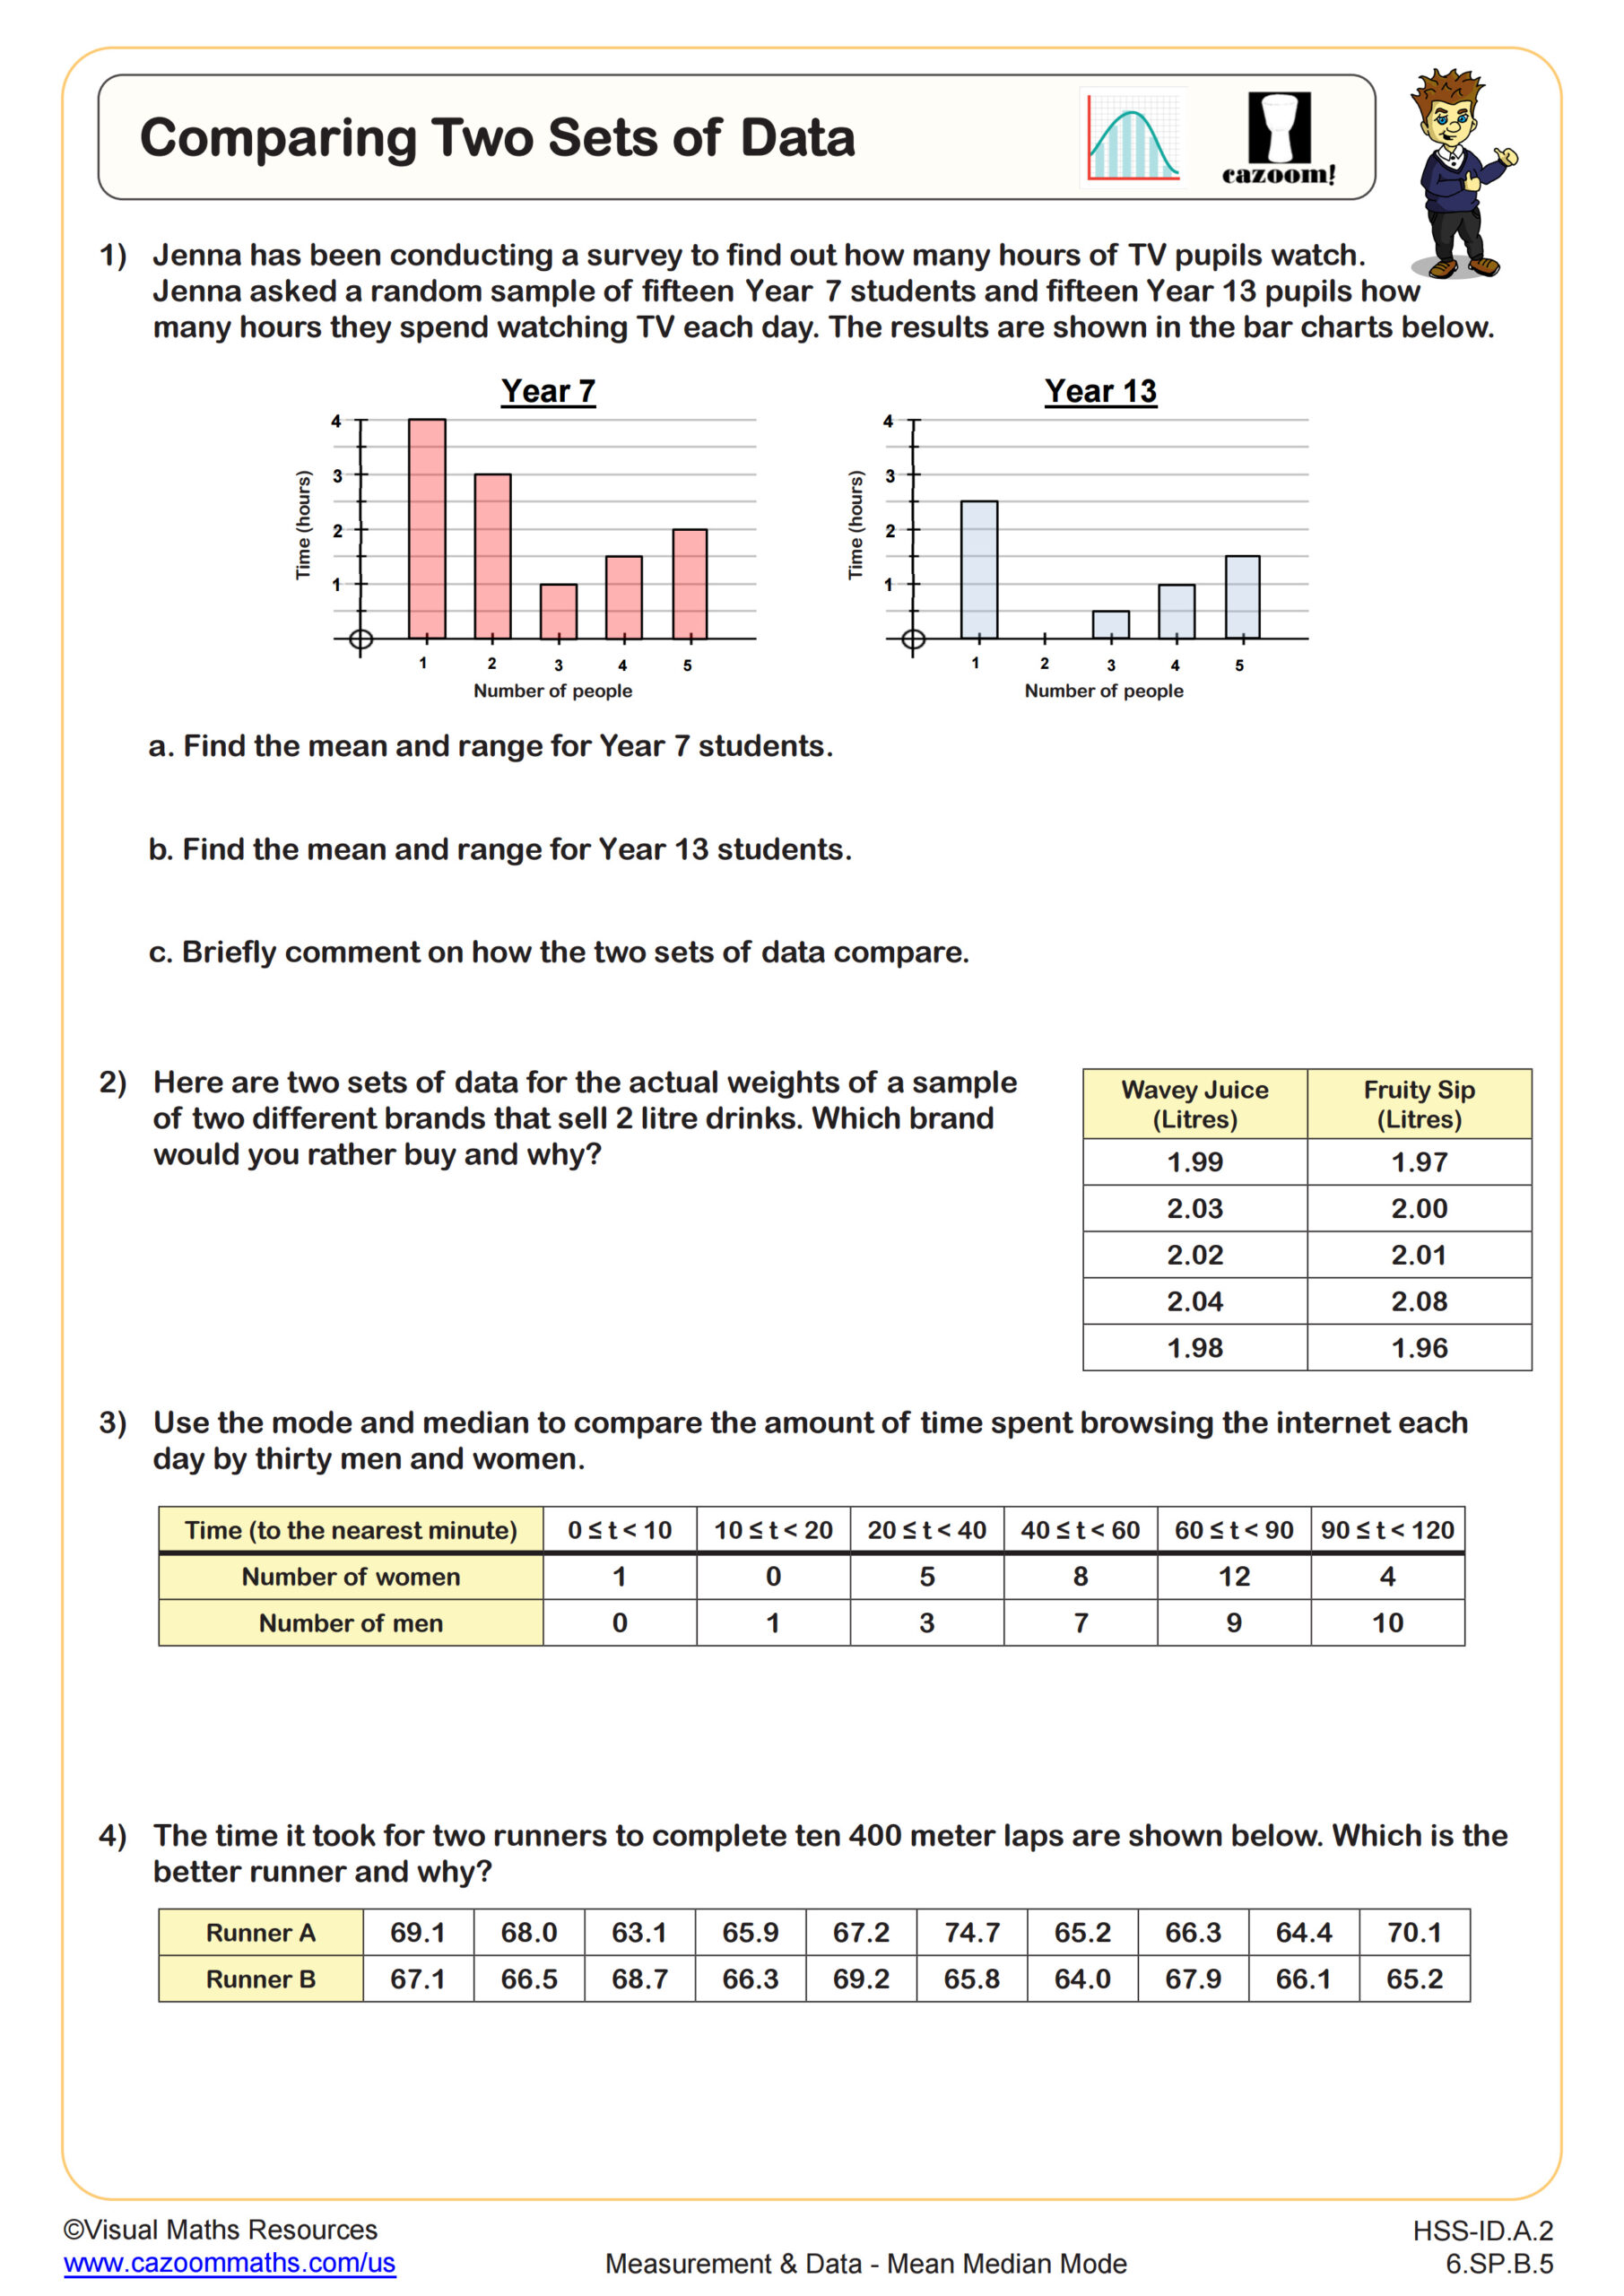
Use statistics appropriate to the shape of the data distribution to compare center (median, mean) and spread (interquartile range, standard deviation) of two or more different data sets.
Use statistics appropriate to the shape of the data distribution to compare center (median, mean) and spread (interquartile range, standard deviation) of two or more different data sets.
Mode and Range WORKSHEET DESCRIPTION
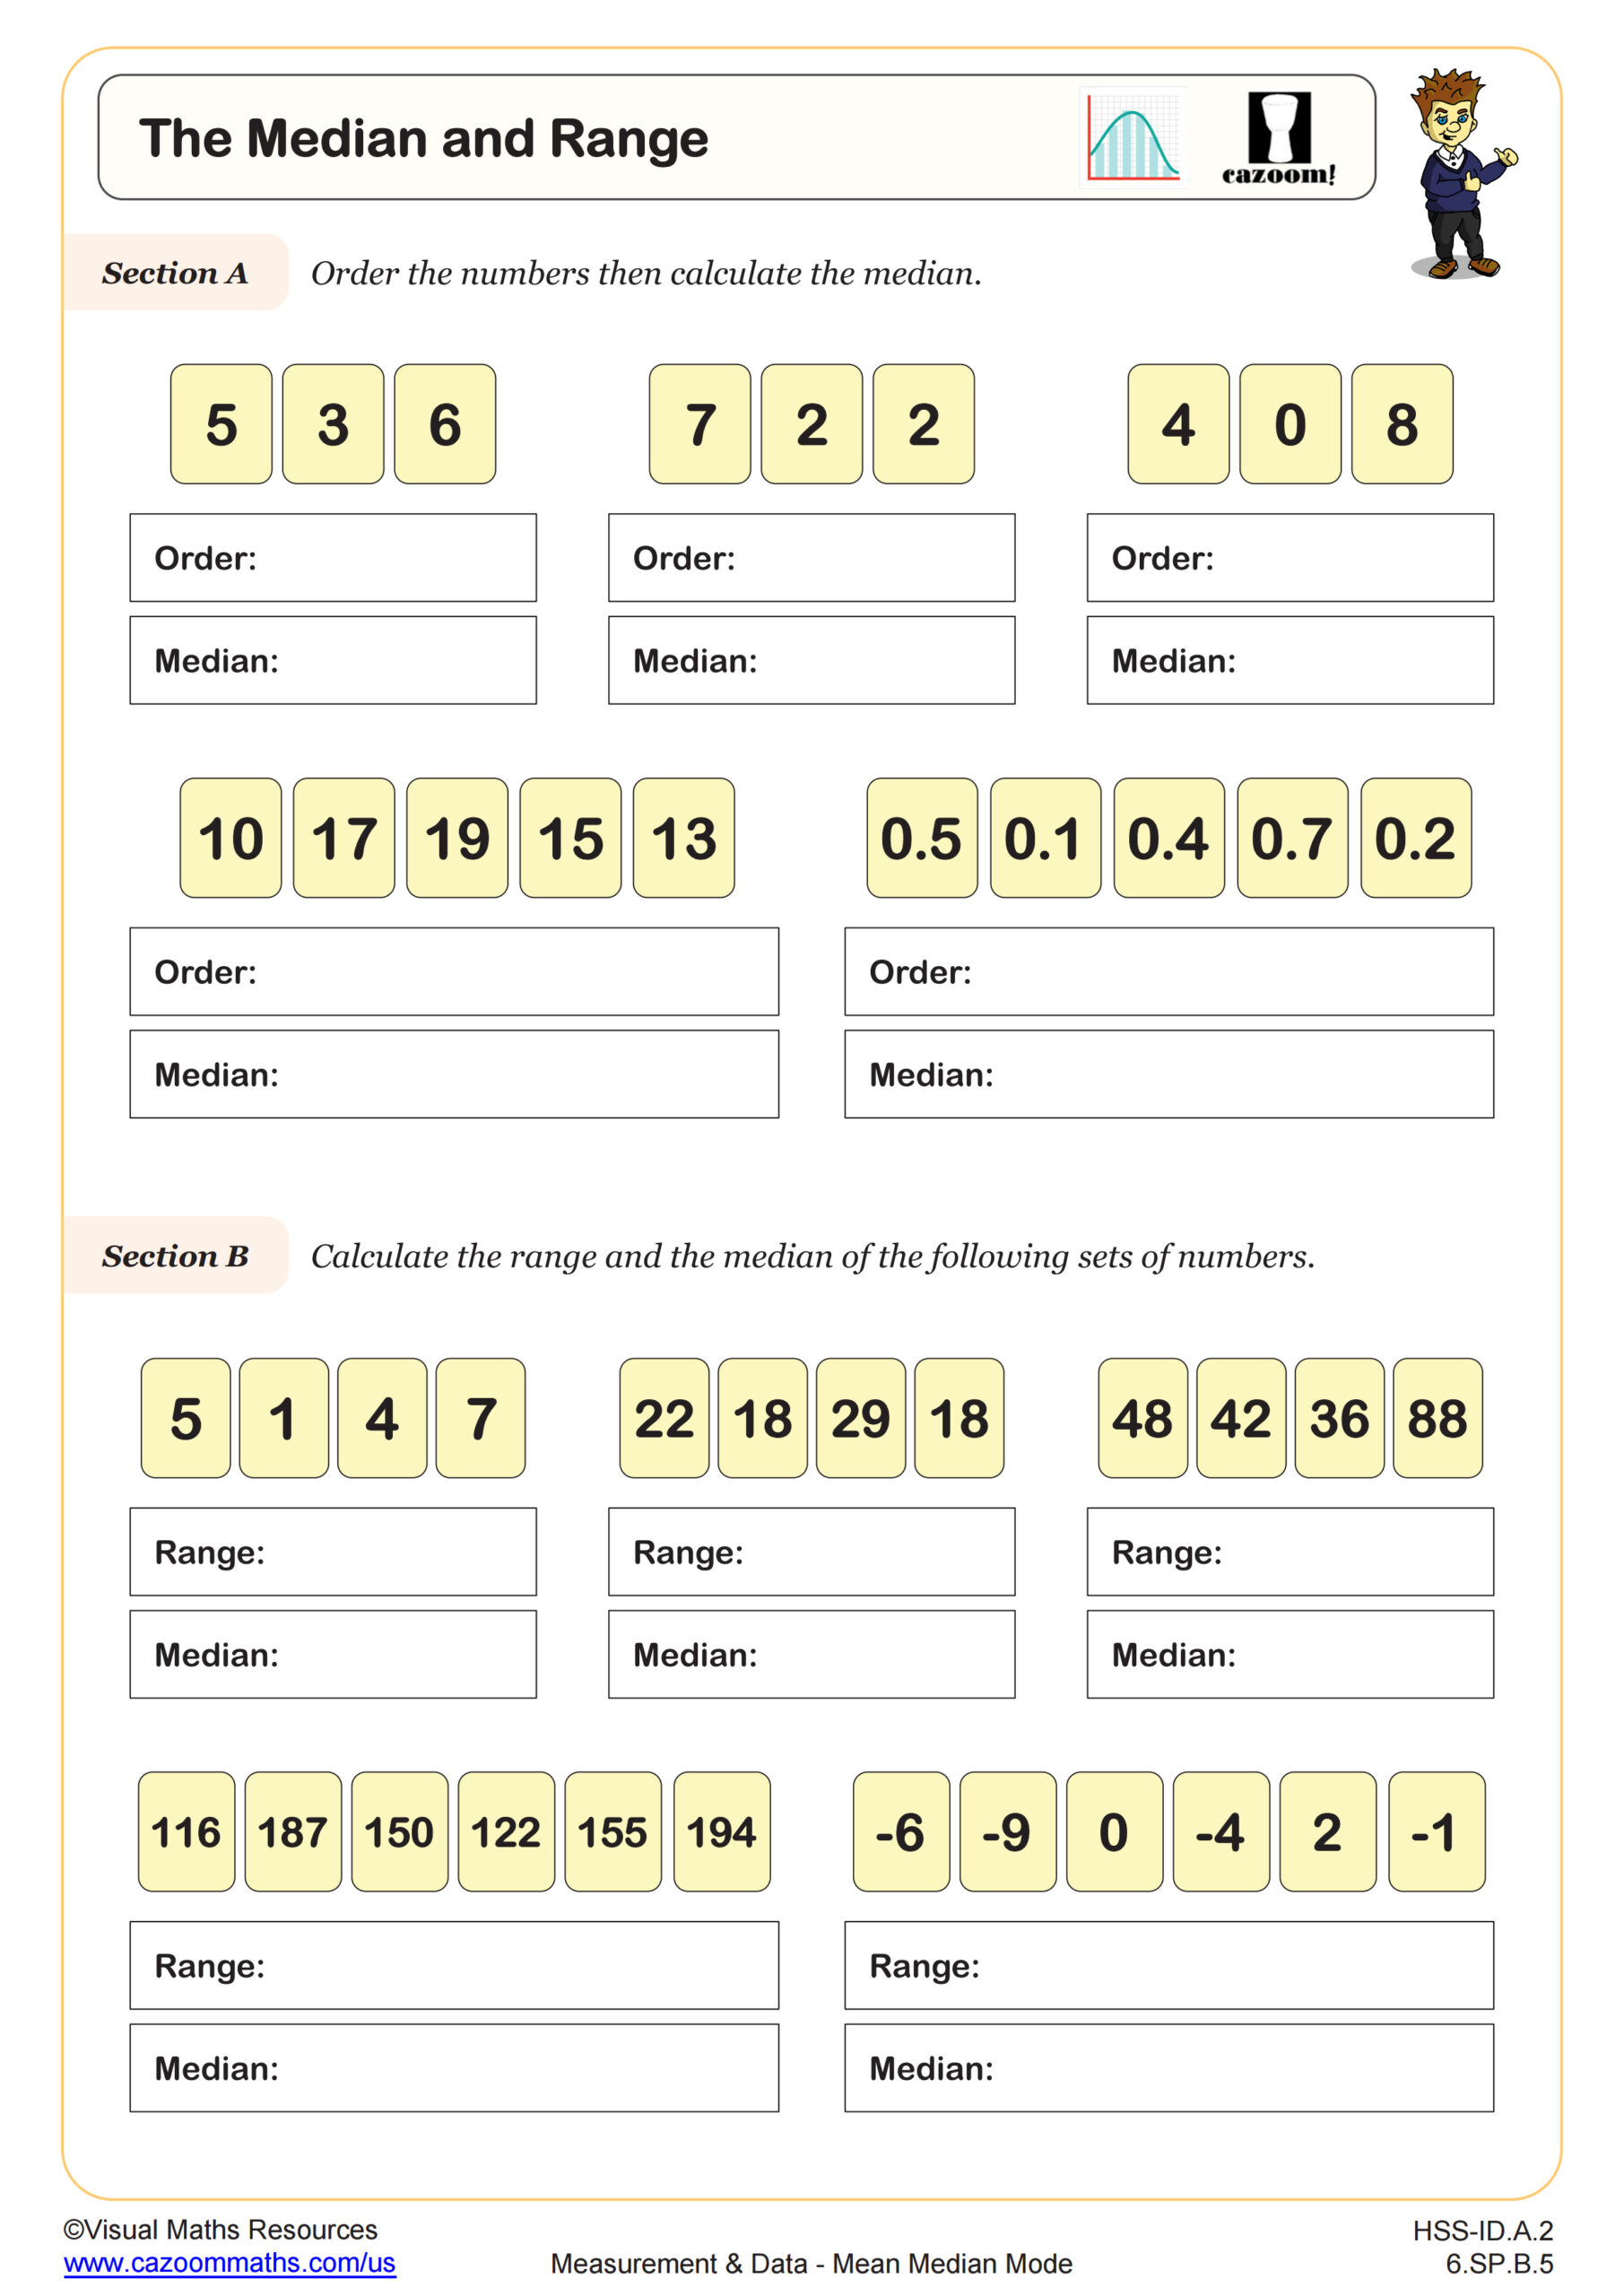
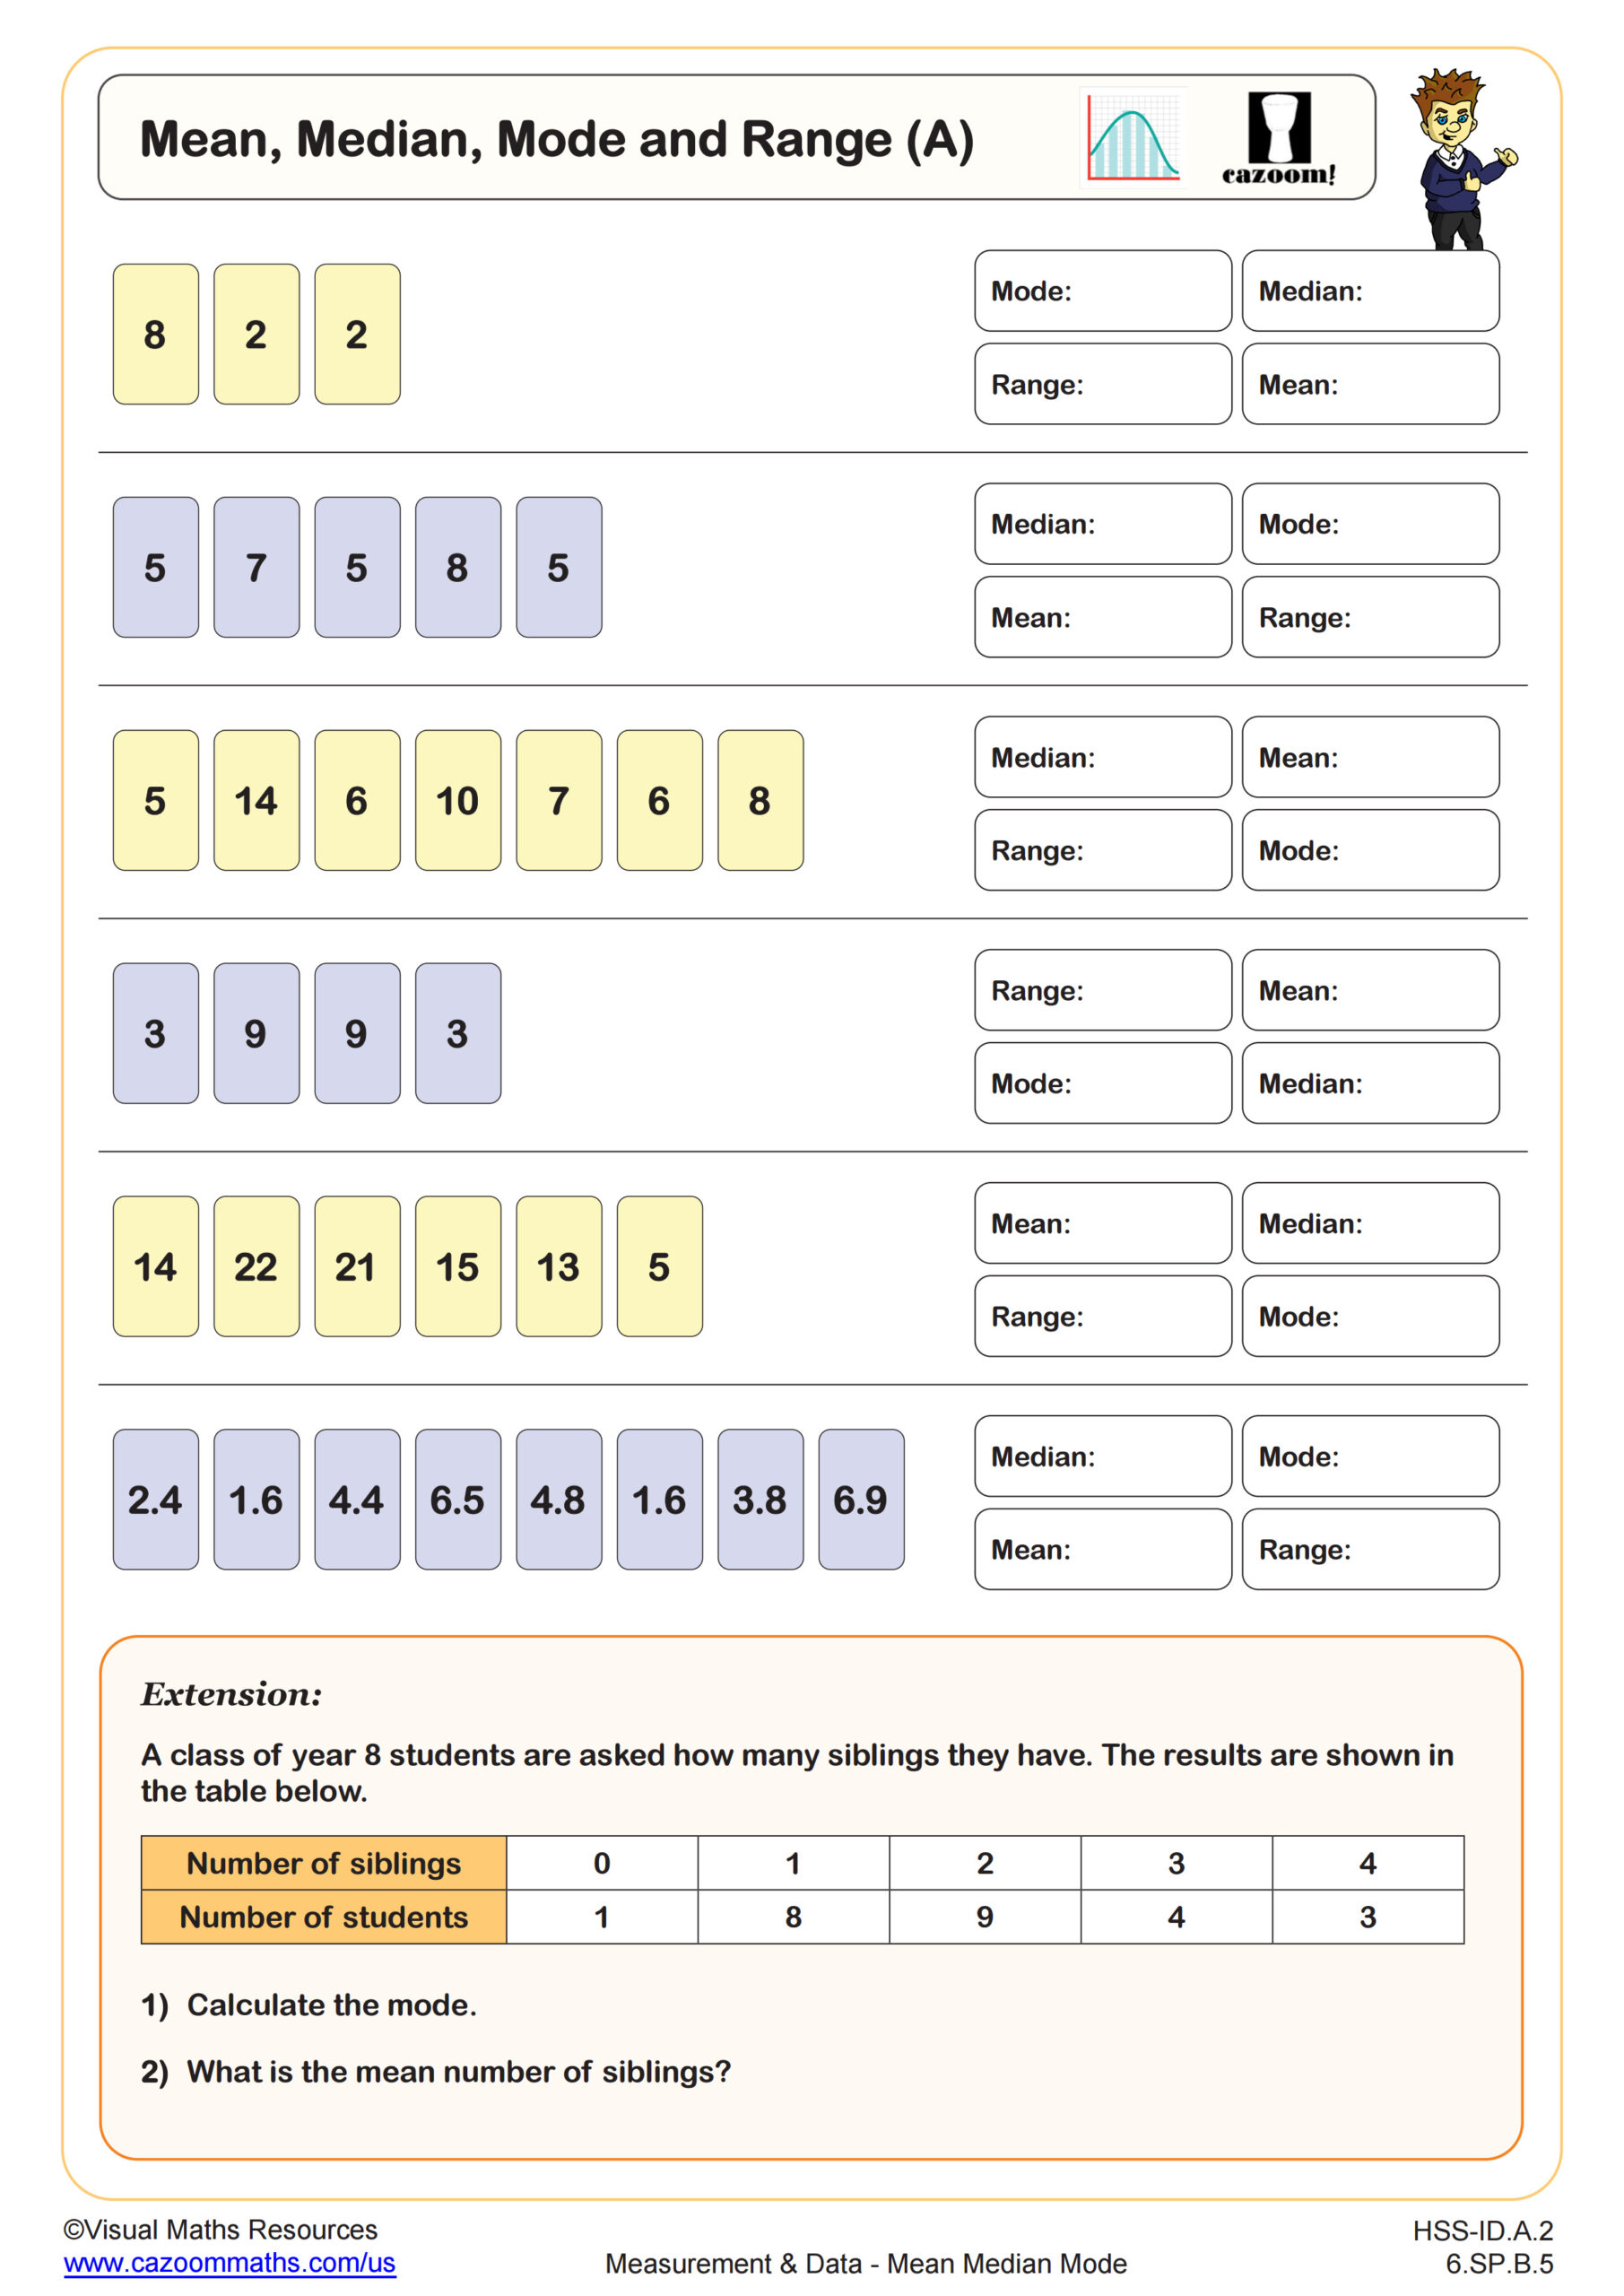
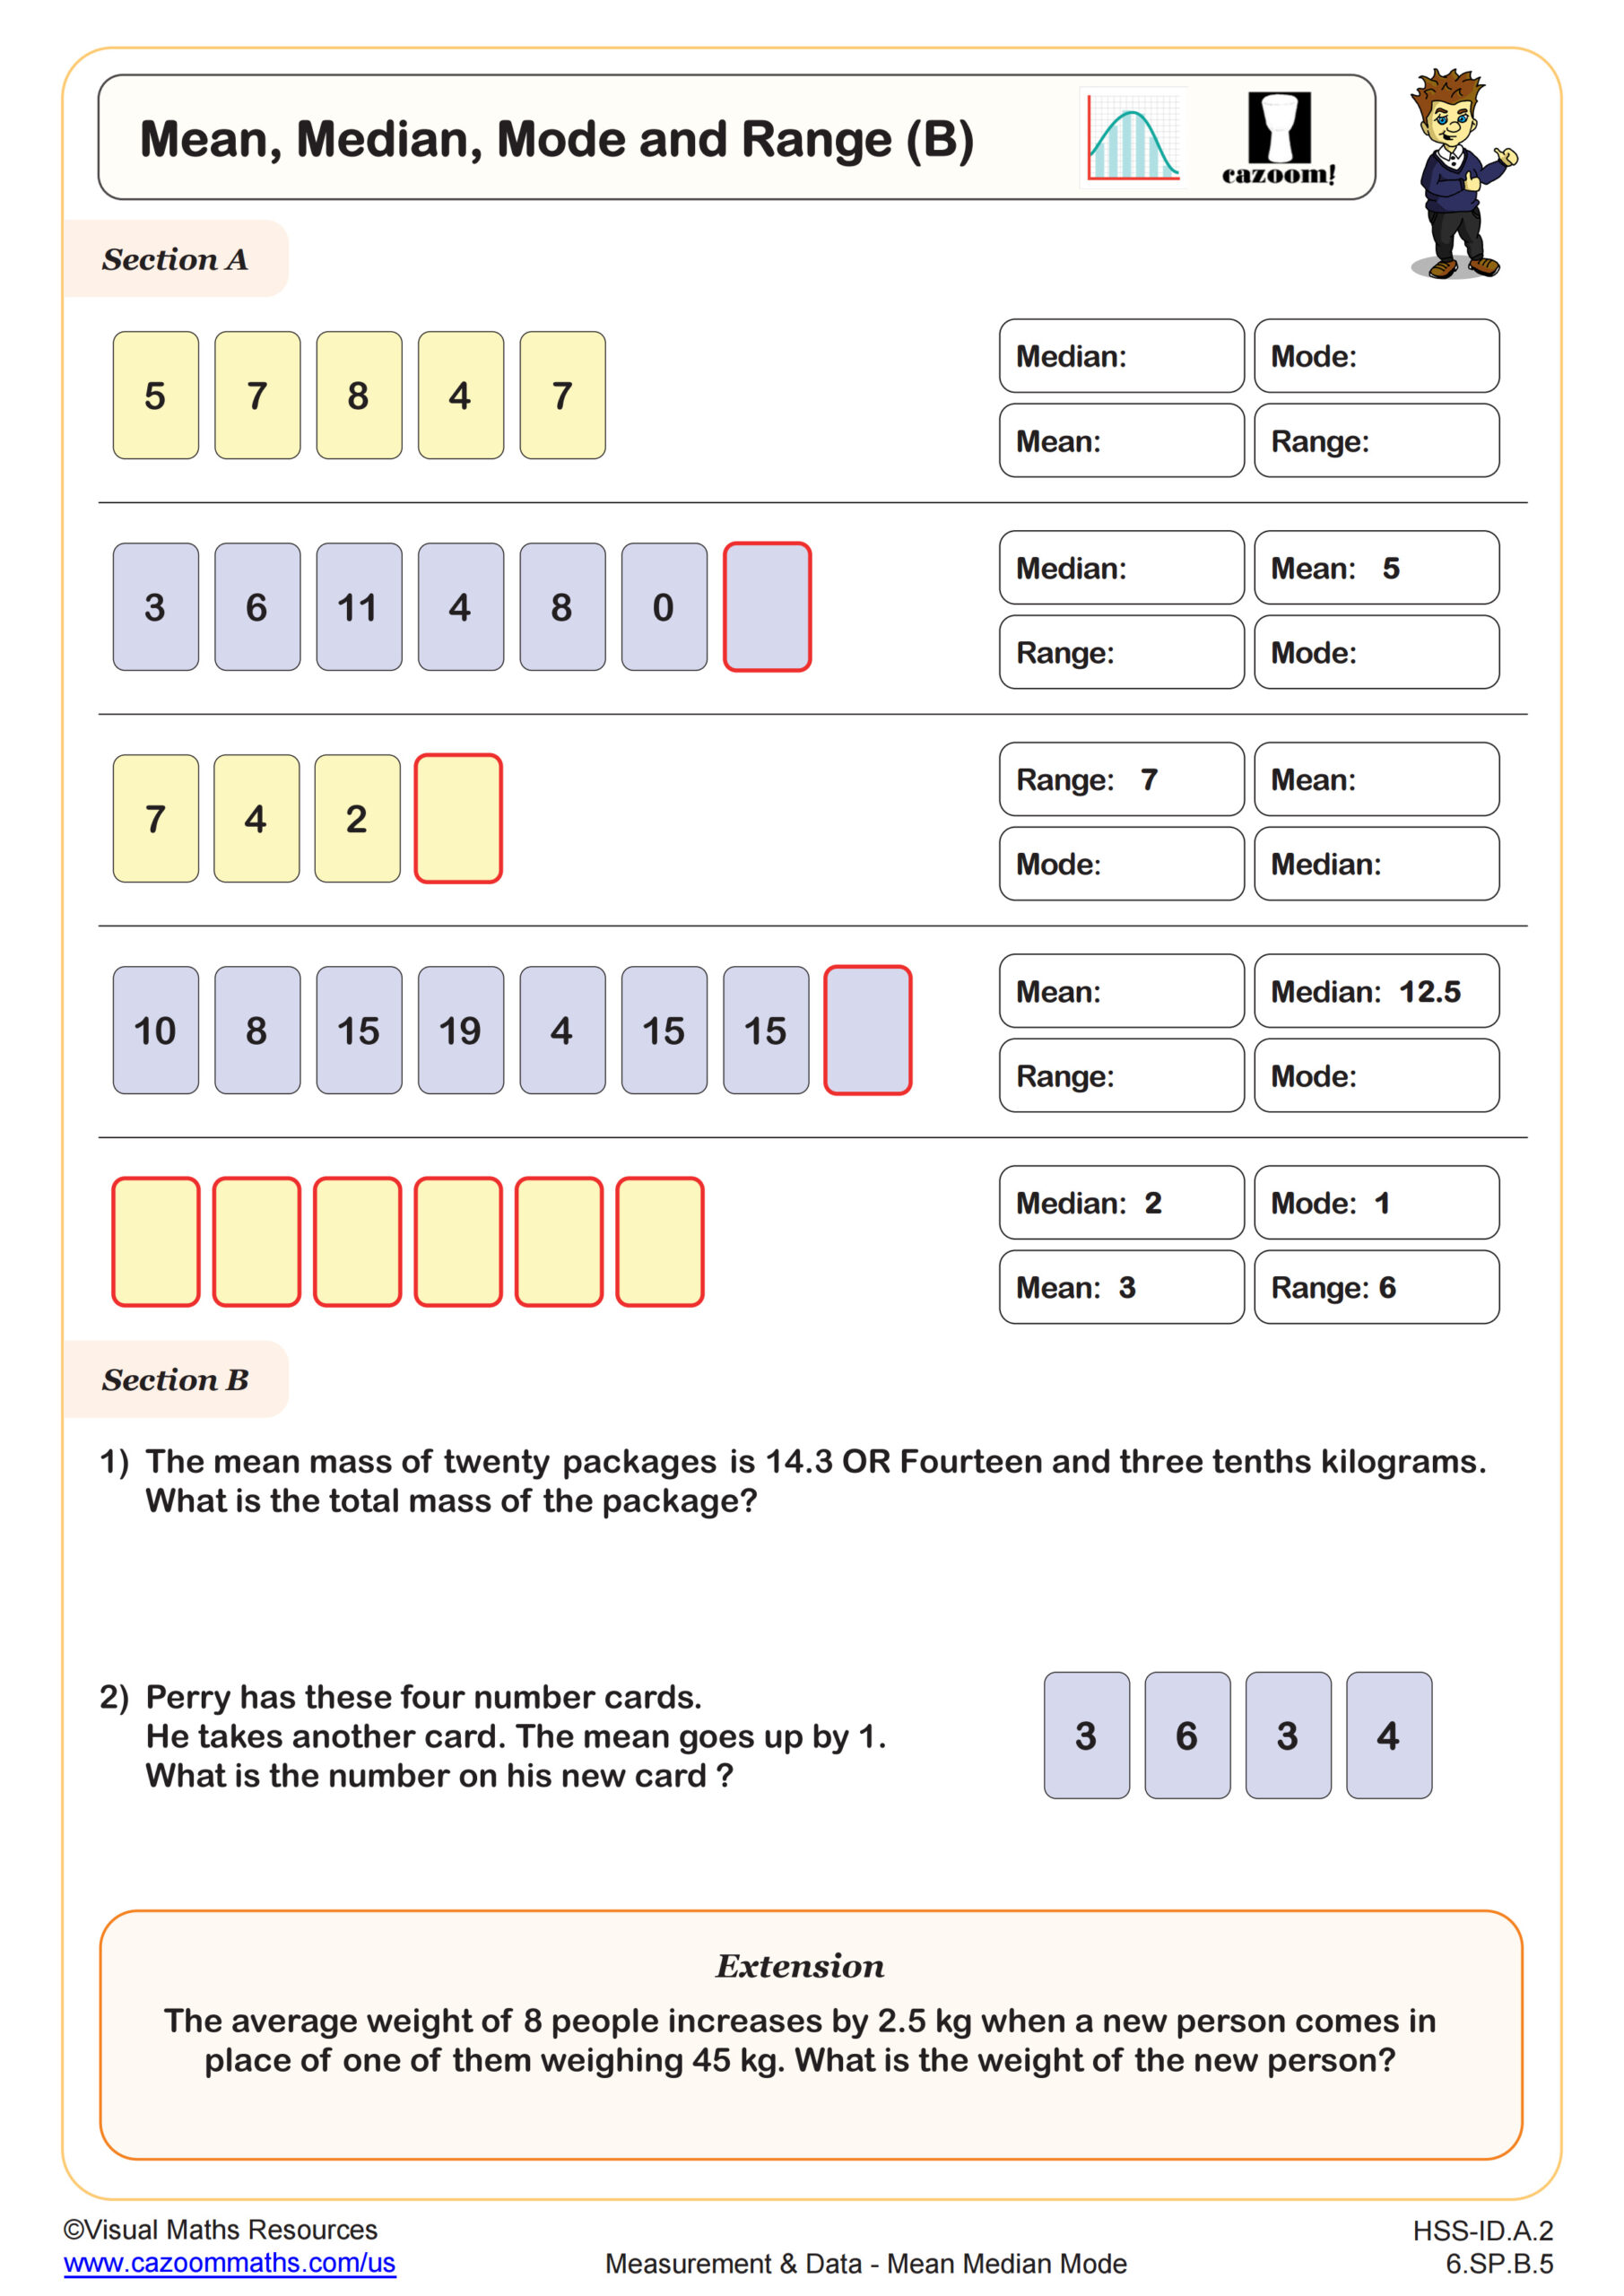
This worksheet focuses on the skills of finding the mode and range from listed and tabulated data. Section A provides lists of data and requires the range and mode. Section B provides six frequency tables and requires the range and mode.
All worksheets are created by the team of experienced teachers at Cazoom Math.

RELATED TO Mode and Range WORKSHEET
Frequently Asked Questions
This worksheet is designed for both 6th Grade and Algebra I students. The dual grade level targeting makes it versatile for middle school statistics introduction or as foundational review in high school algebra courses. Teachers can use it to reinforce these essential statistical concepts across different mathematical learning stages.