Plotting Exponential Graphs WORKSHEET
Graph functions expressed symbolically and show key features of the graph, by hand in simple cases and using technology for more complicated cases.★ a. Graph linear and quadratic functions and show intercepts, maxima, and minima. b. Graph square root, cube root, and piecewise-defined functions, including step functions and absolute value functions. c. Graph polynomial functions, identifying zeros when suitable factorizations are available, and showing end behavior. d. (+) Graph rational functions, identifying zeros and asymptotes when suitable factorizations are available, and showing end behavior. e. Graph exponential and logarithmic functions, showing intercepts and end behavior, and trigonometric functions, showing period, midline, and amplitude.
Plotting Exponential Graphs WORKSHEET DESCRIPTION
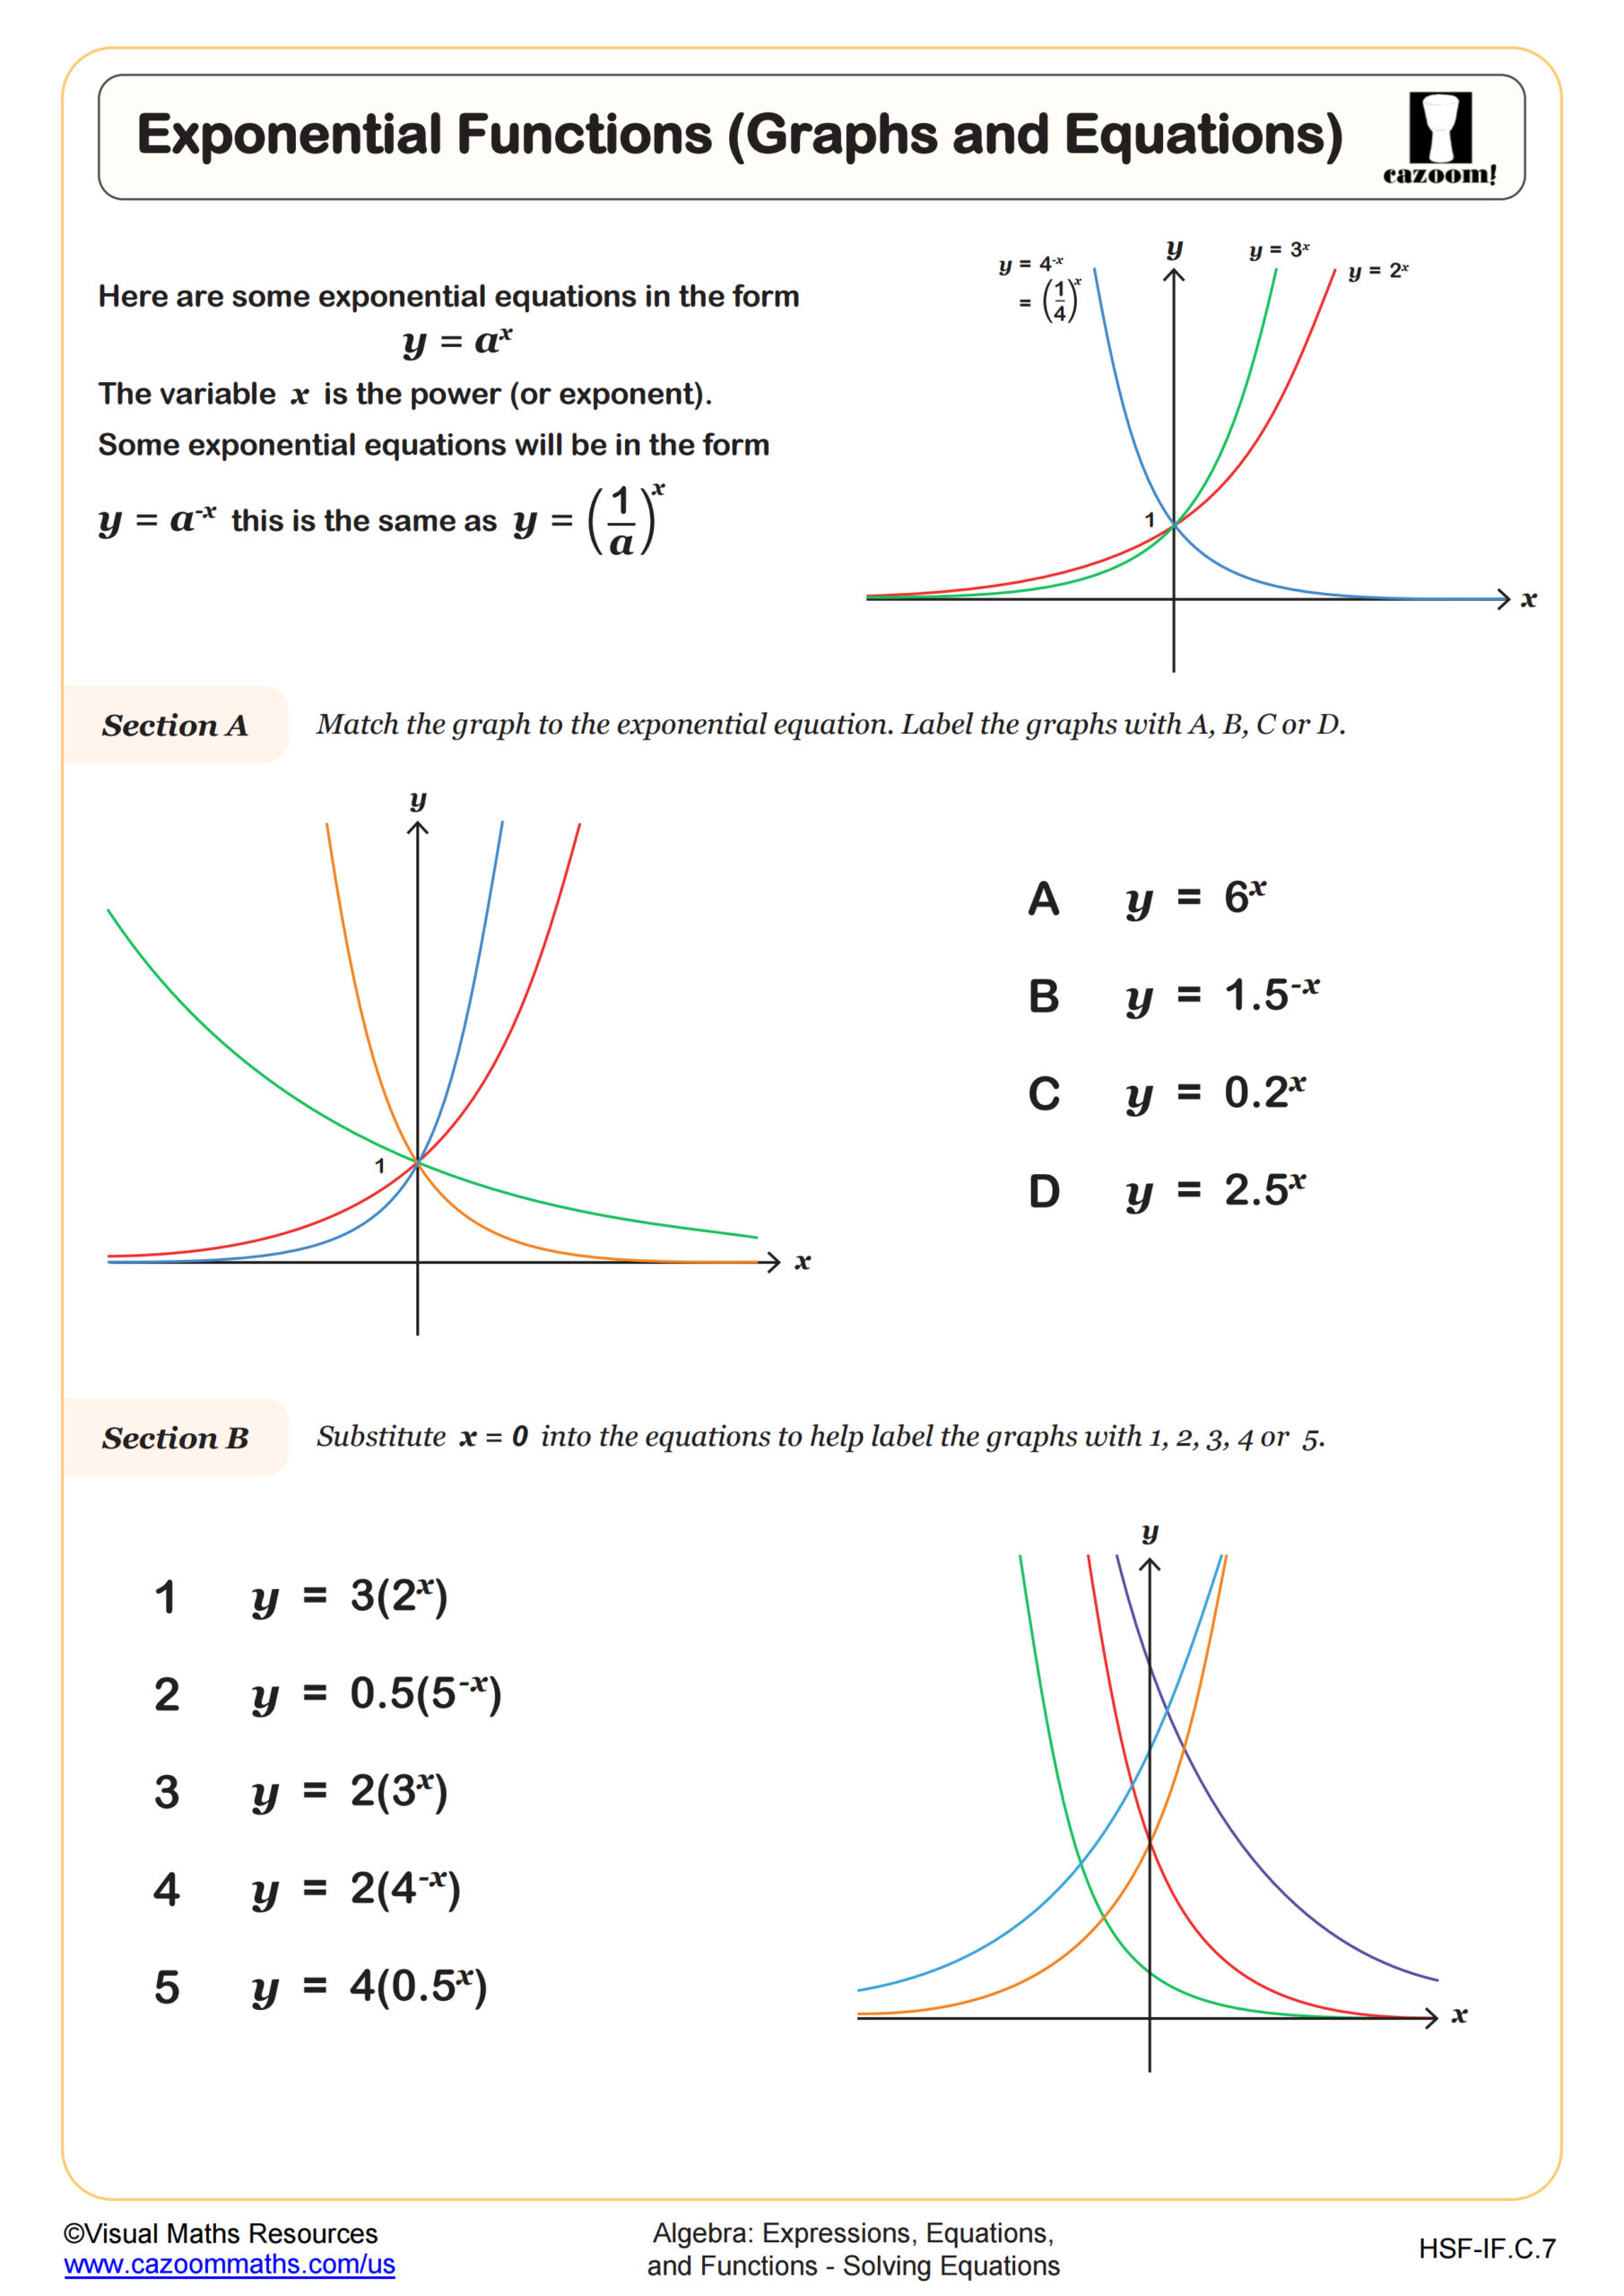
In Section A, students fill in tables of values for various exponential functions, rounding answers to two decimal places. They then move on to Section B, where they plot the curves of five exponential functions on coordinate axes. The scaffolding decreases as the questions progress.
Exercises progress from simpler forms like y = 2𝑥 to more complex variations such as y = 2(3𝑥), y = 2-𝑥, and more, prompting learners to compare how different bases and coefficients affect each graph’s shape and growth rate.
The resource also addresses common errors in constructing tables, asking students to explain these mistakes to reinforce conceptual understanding.
All worksheets are created by the team of experienced teachers at Cazoom Math.

RELATED TO Plotting Exponential Graphs WORKSHEET
Frequently Asked Questions
This worksheet is designed for 8th Grade, Algebra I, and IM 1 students who are ready to work with exponential functions. The scaffolded approach makes it accessible for students at these levels, starting with basic exponential forms and building complexity as they develop confidence with plotting and analyzing these important functions.