Back to:
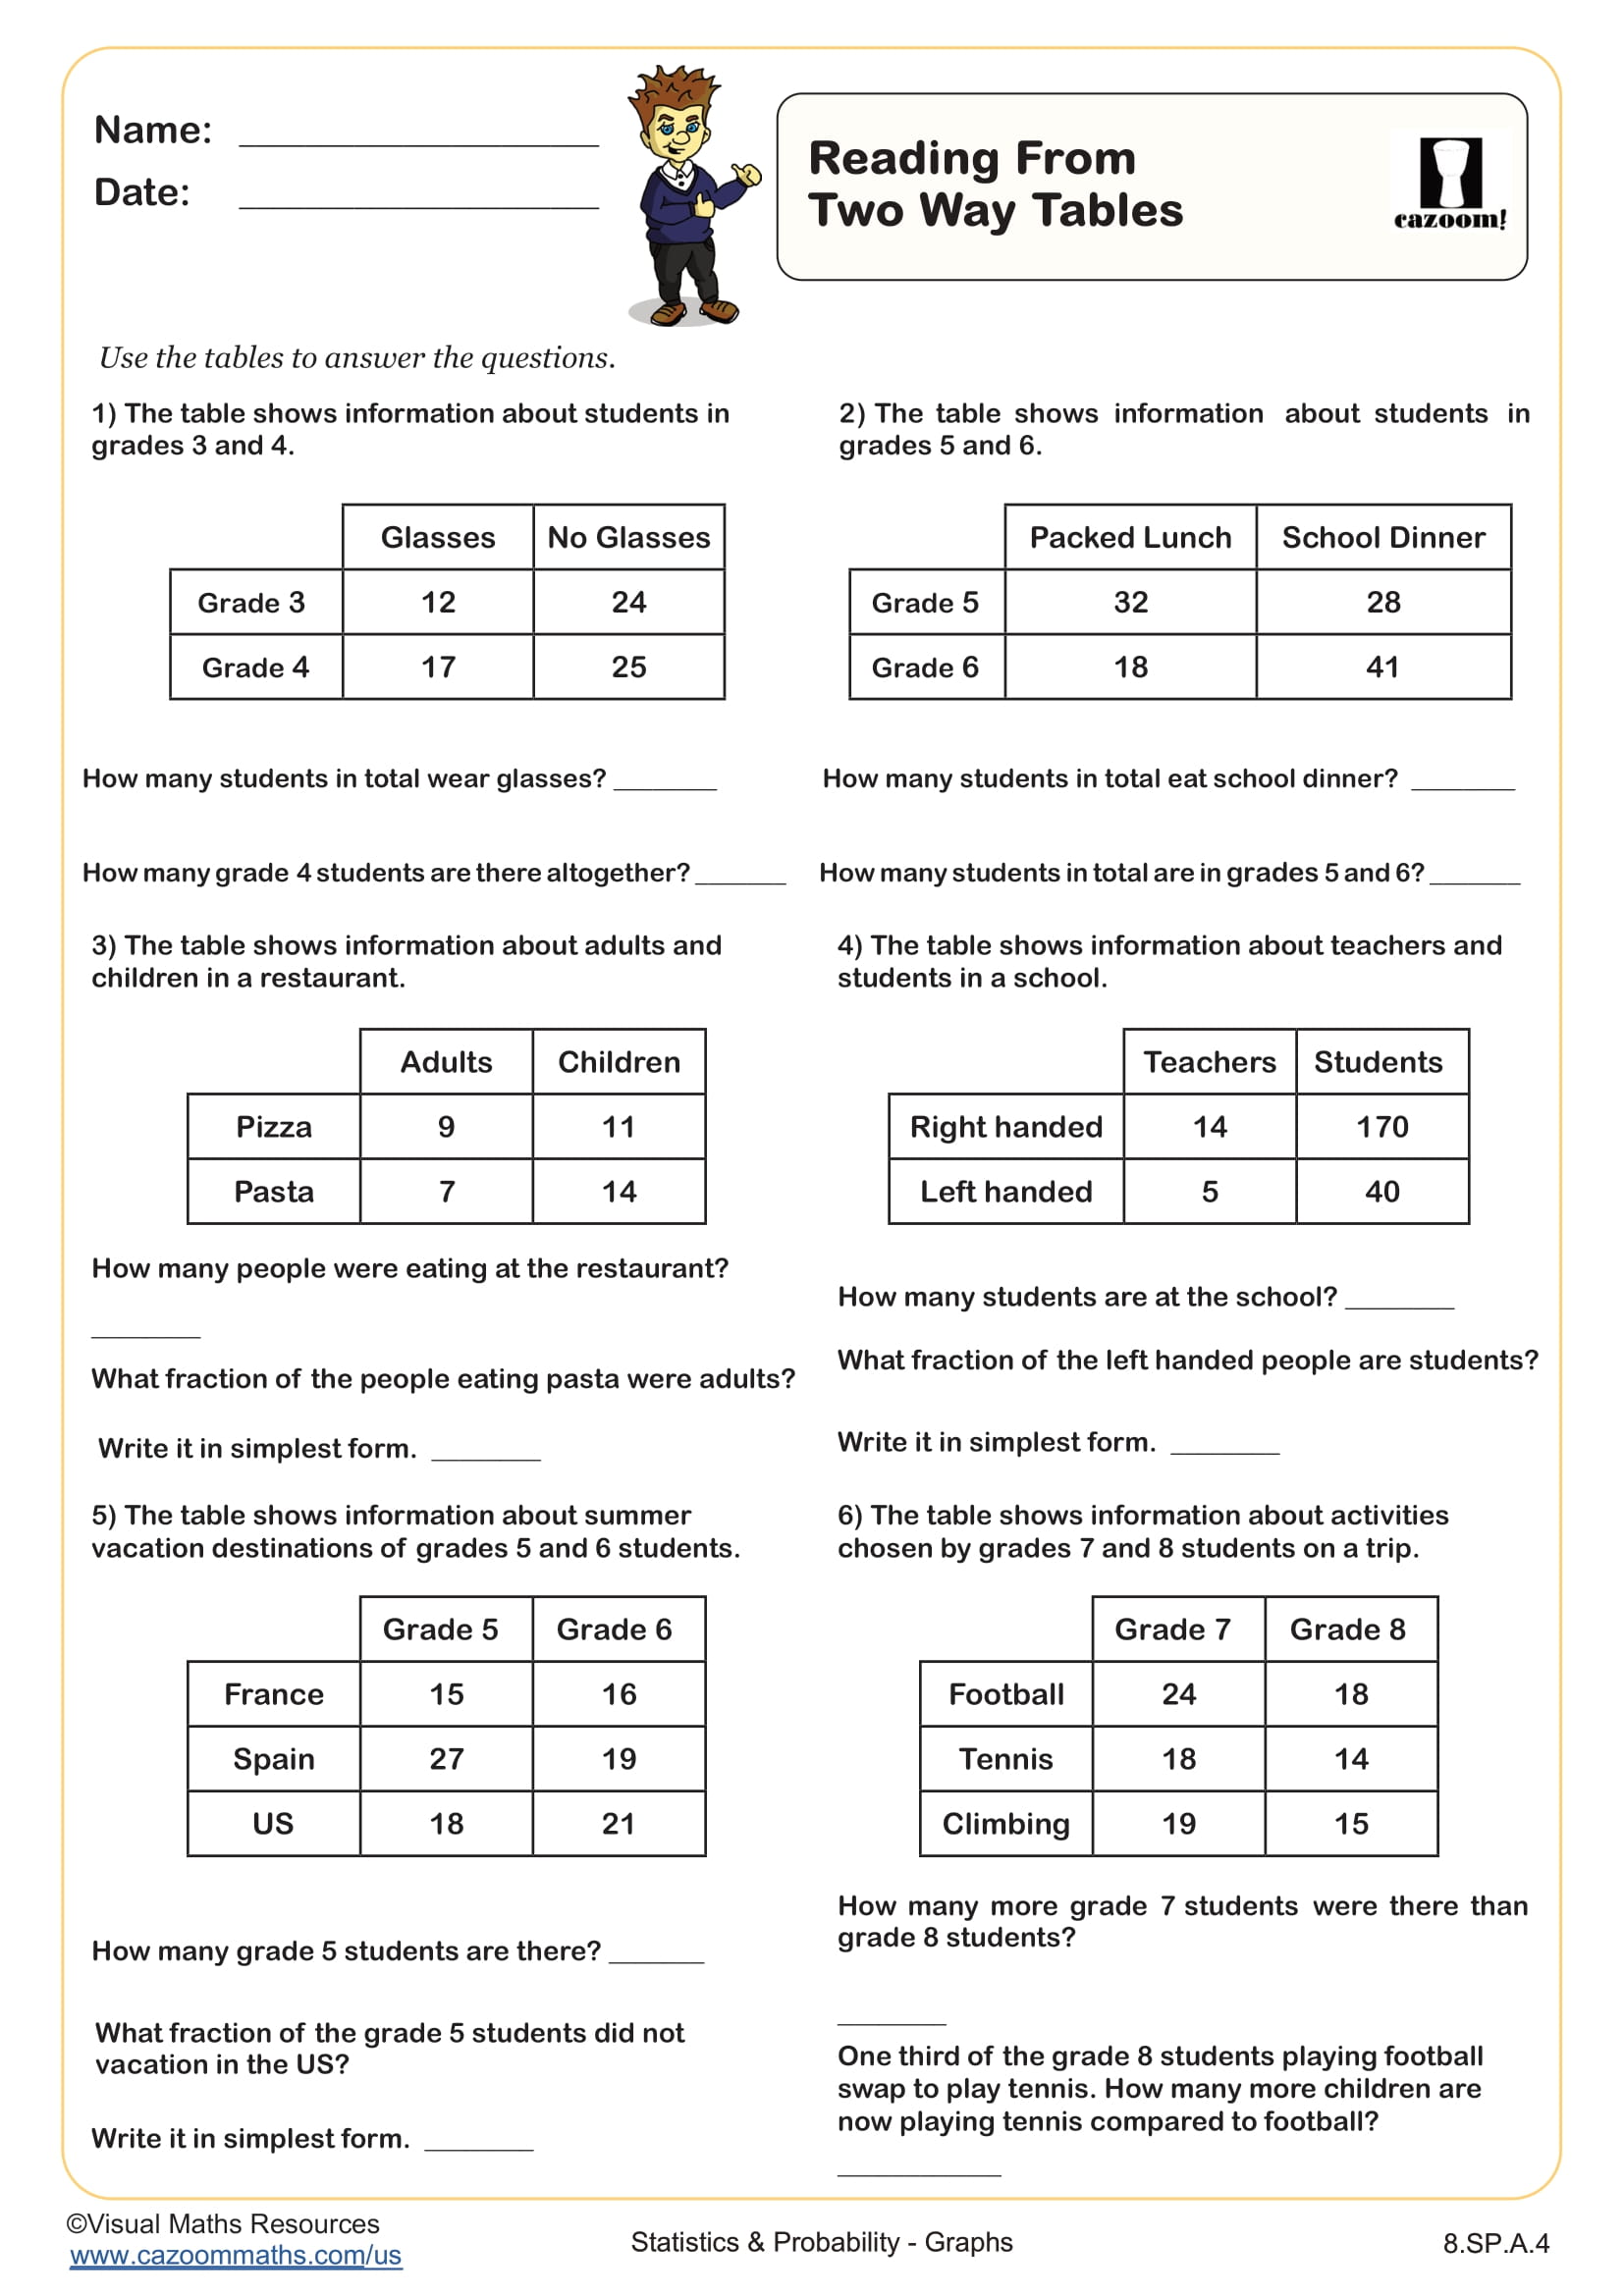
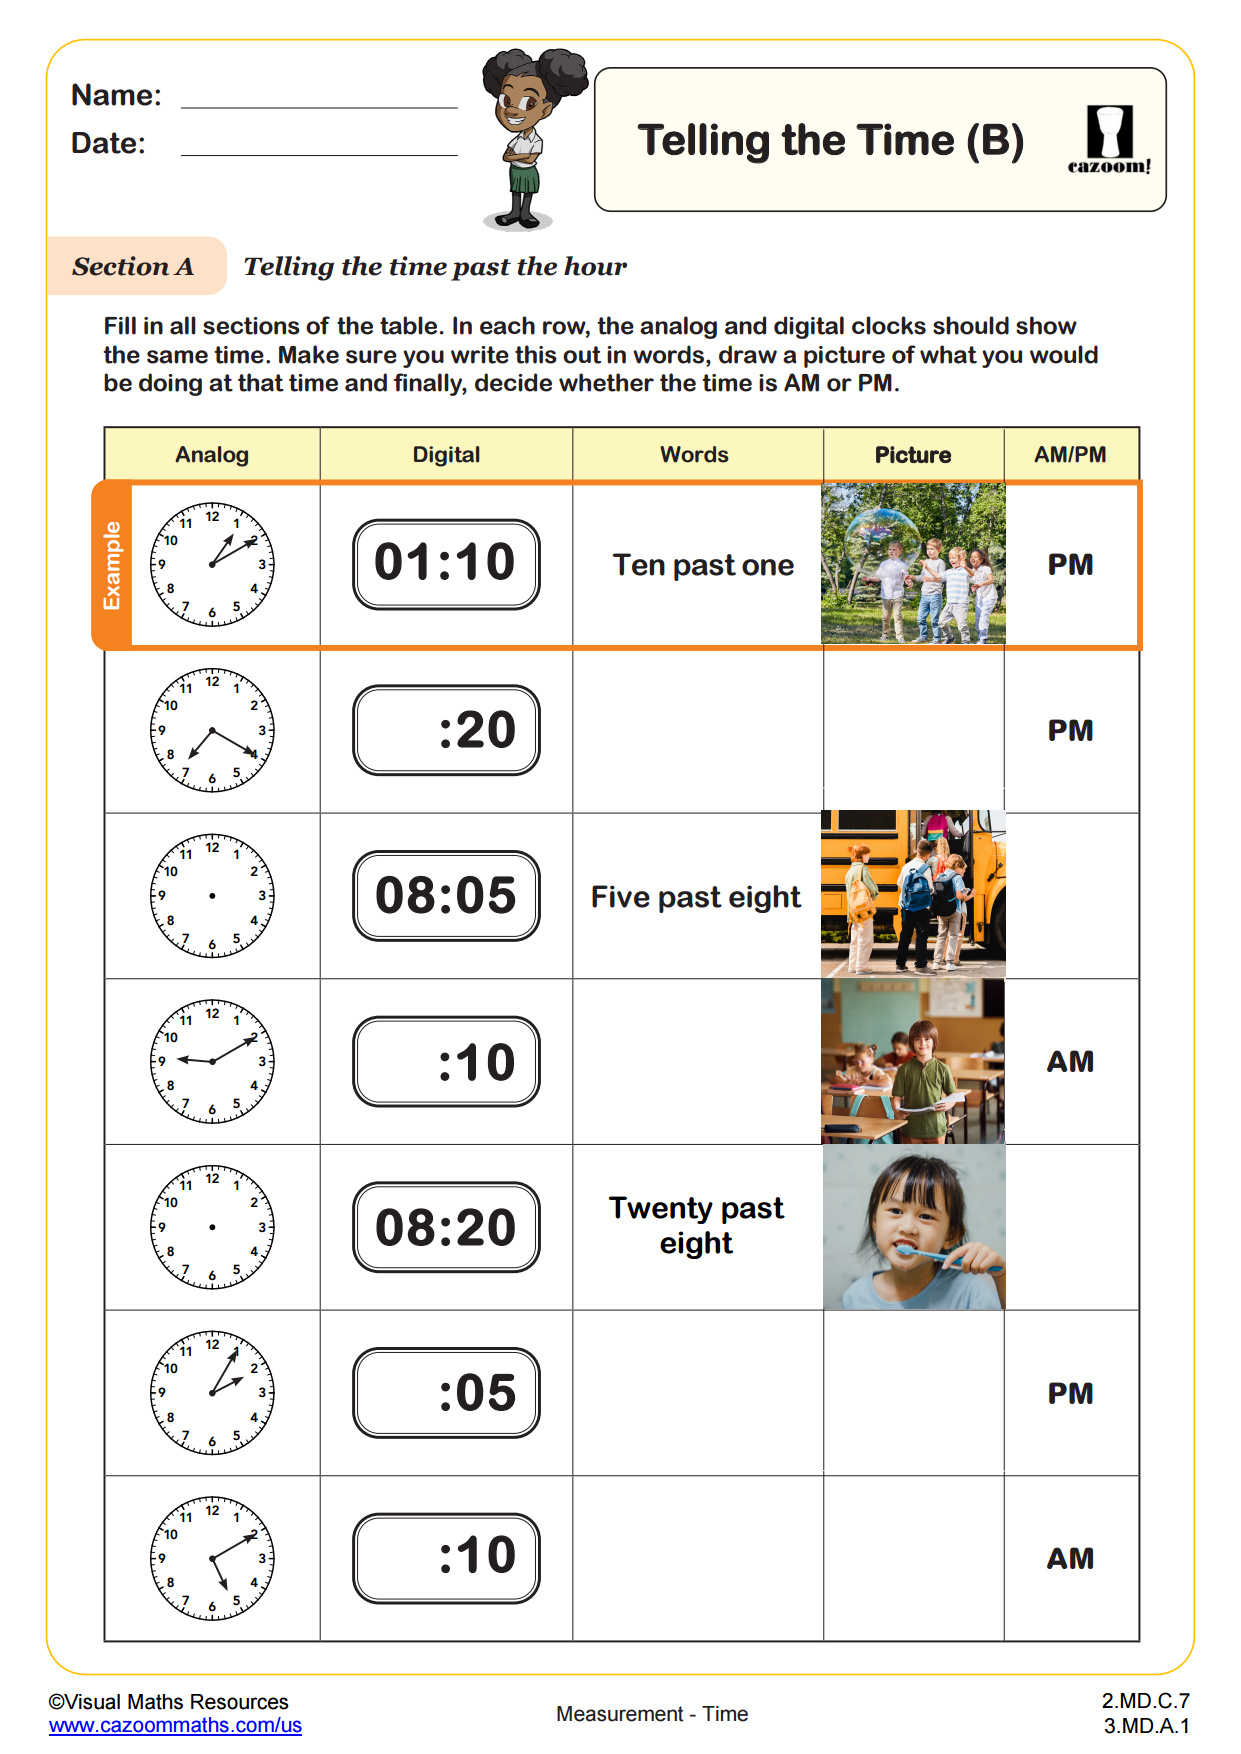
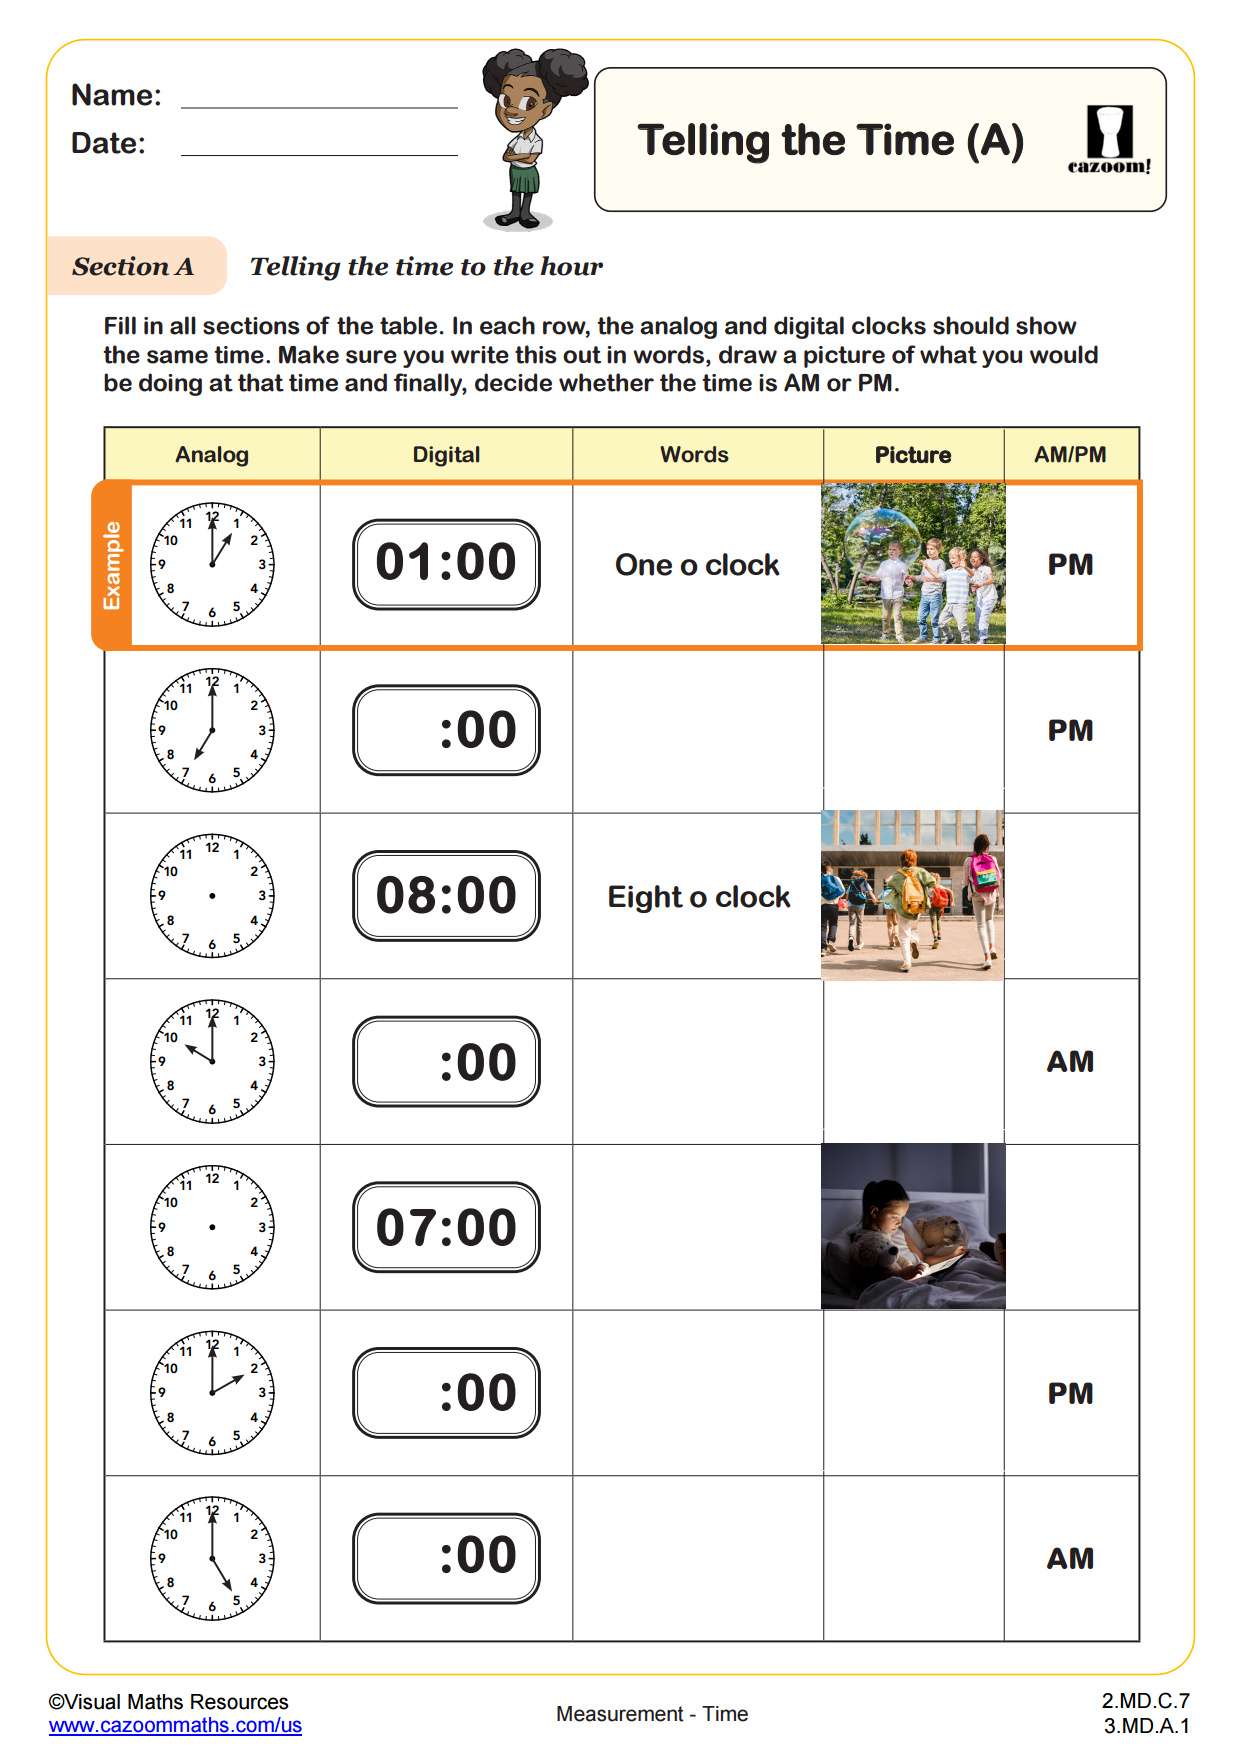
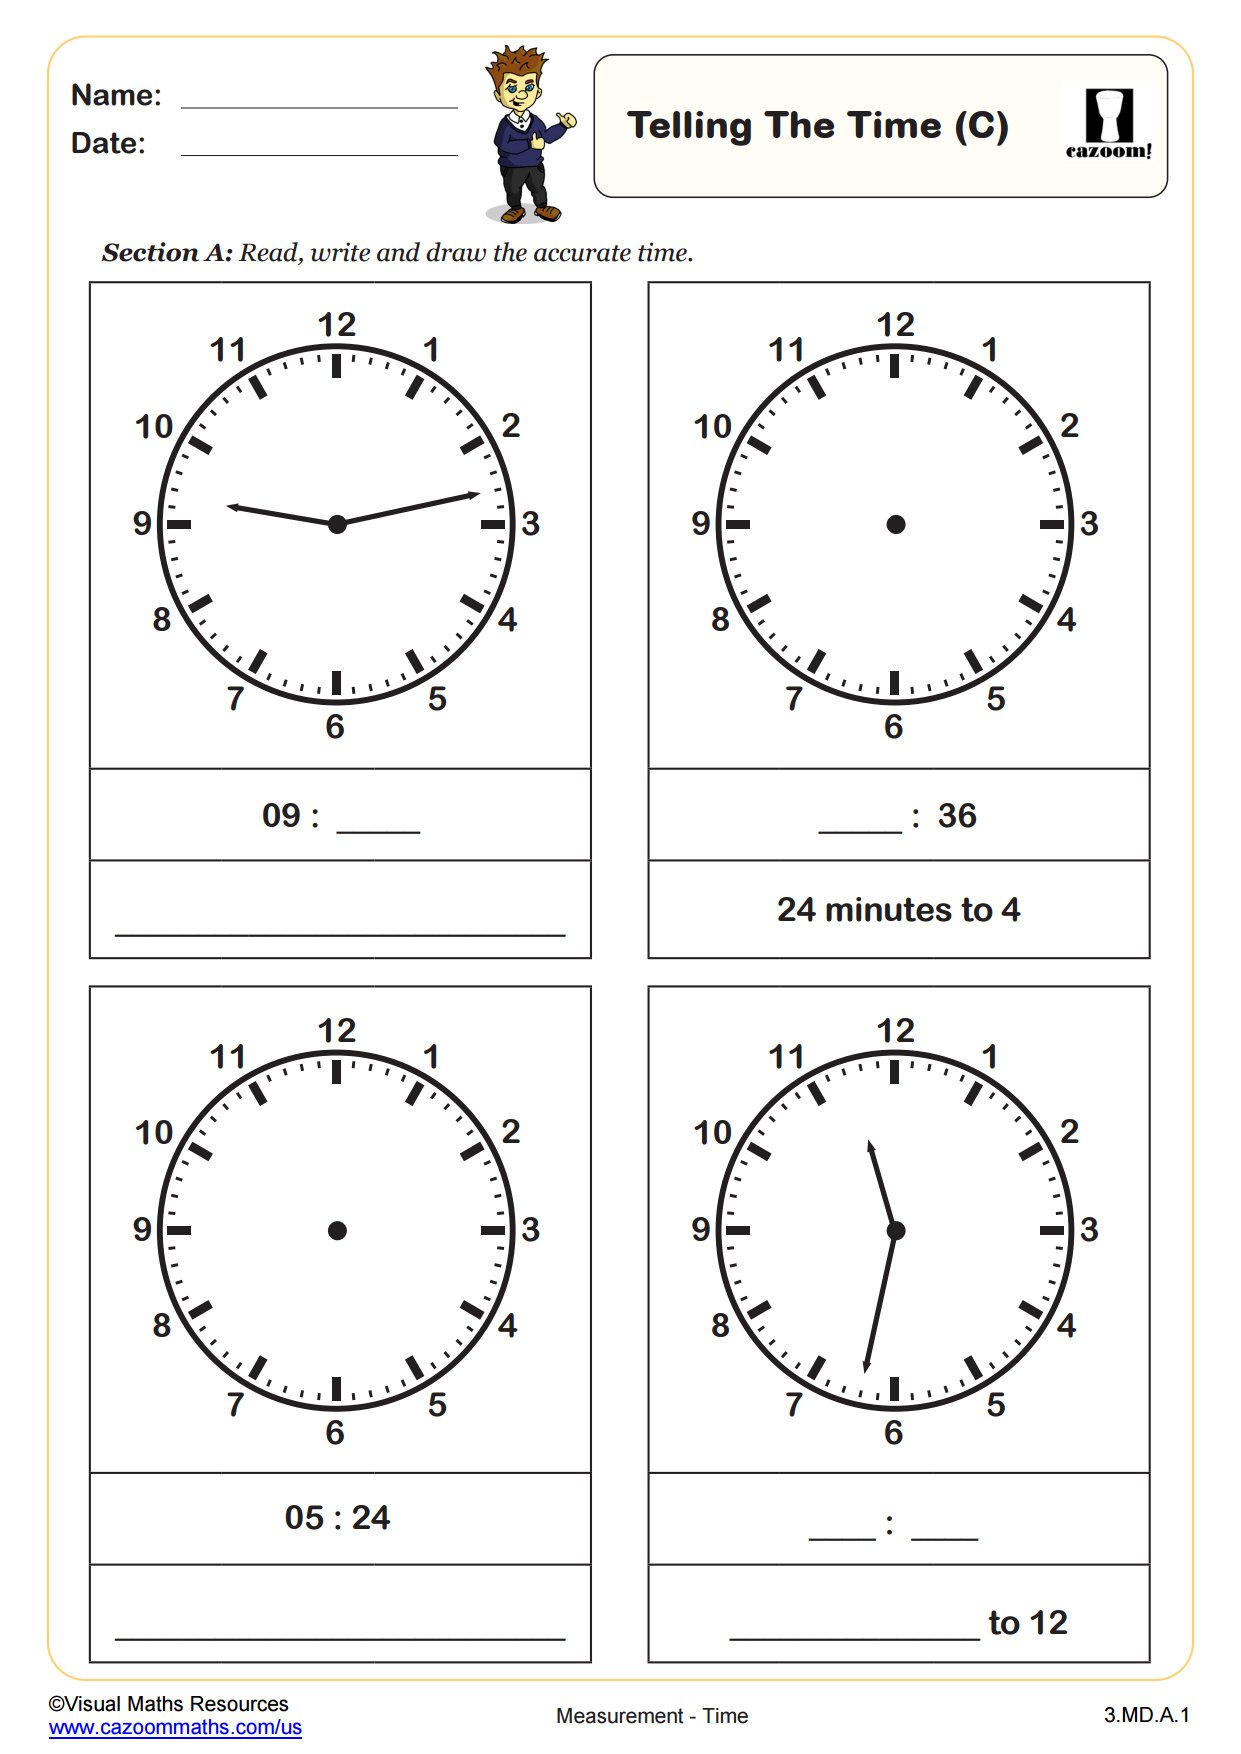
Reading from Time Tables WORKSHEET
Suitable for Grades: 3rd Grade, 4th Grade
CCSS: 3.MD.B.3, 4.OA.A.3
CCSS Description: Draw a scaled picture graph and a scaled bar graph to represent a data set with several categories. Solve one- nd two-step “how many more” and “how many less” problems using information presented in scaled bar graphs. For example, draw a bar graph in which each square in the bar graph might represent 5 pets.
Solve multistep word problems posed with whole numbers and having wholenumber answers using the four perations, including problems in which remainders must be interpreted. Represent these problems using equations with a letter standing for the unknown quantity. Assess the reasonableness of answers using mental computation and estimation strategies ncluding rounding.
Solve multistep word problems posed with whole numbers and having wholenumber answers using the four perations, including problems in which remainders must be interpreted. Represent these problems using equations with a letter standing for the unknown quantity. Assess the reasonableness of answers using mental computation and estimation strategies ncluding rounding.
Reading from Time Tables WORKSHEET DESCRIPTION
This worksheet gives students two different bus time tables. Students will have to complete missing information in the tables, calculate the duration of certain journeys and plan journeys using the time tables.
All worksheets are created by the team of experienced teachers at Cazoom Math.

RELATED TO Reading from Time Tables WORKSHEET
Frequently Asked Questions
This worksheet is specifically designed for 3rd grade and 4th grade students. At these grade levels, students are developing their skills in reading and interpreting data from tables, which makes timetables a perfect real-world application for practicing these essential math concepts.