Reading from Two Way Tables WORKSHEET
Suitable for Grades: 8th Grade, IM 1
CCSS: 8.SP.A.4
CCSS Description: Understand that patterns of association can also be seen in bivariate categorical data by displaying frequencies and relative frequencies in a two-way table. Construct and interpret a two-way table summarizing data on two categorical variables collected from the same subjects. Use relative frequencies calculated for rows or columns to describe possible association between the two variables. For example, collect data from students in your class on whether or not they have a curfew on school nights and whether or not they have assigned chores at home. Is there evidence that those who have a curfew also tend to have chores?
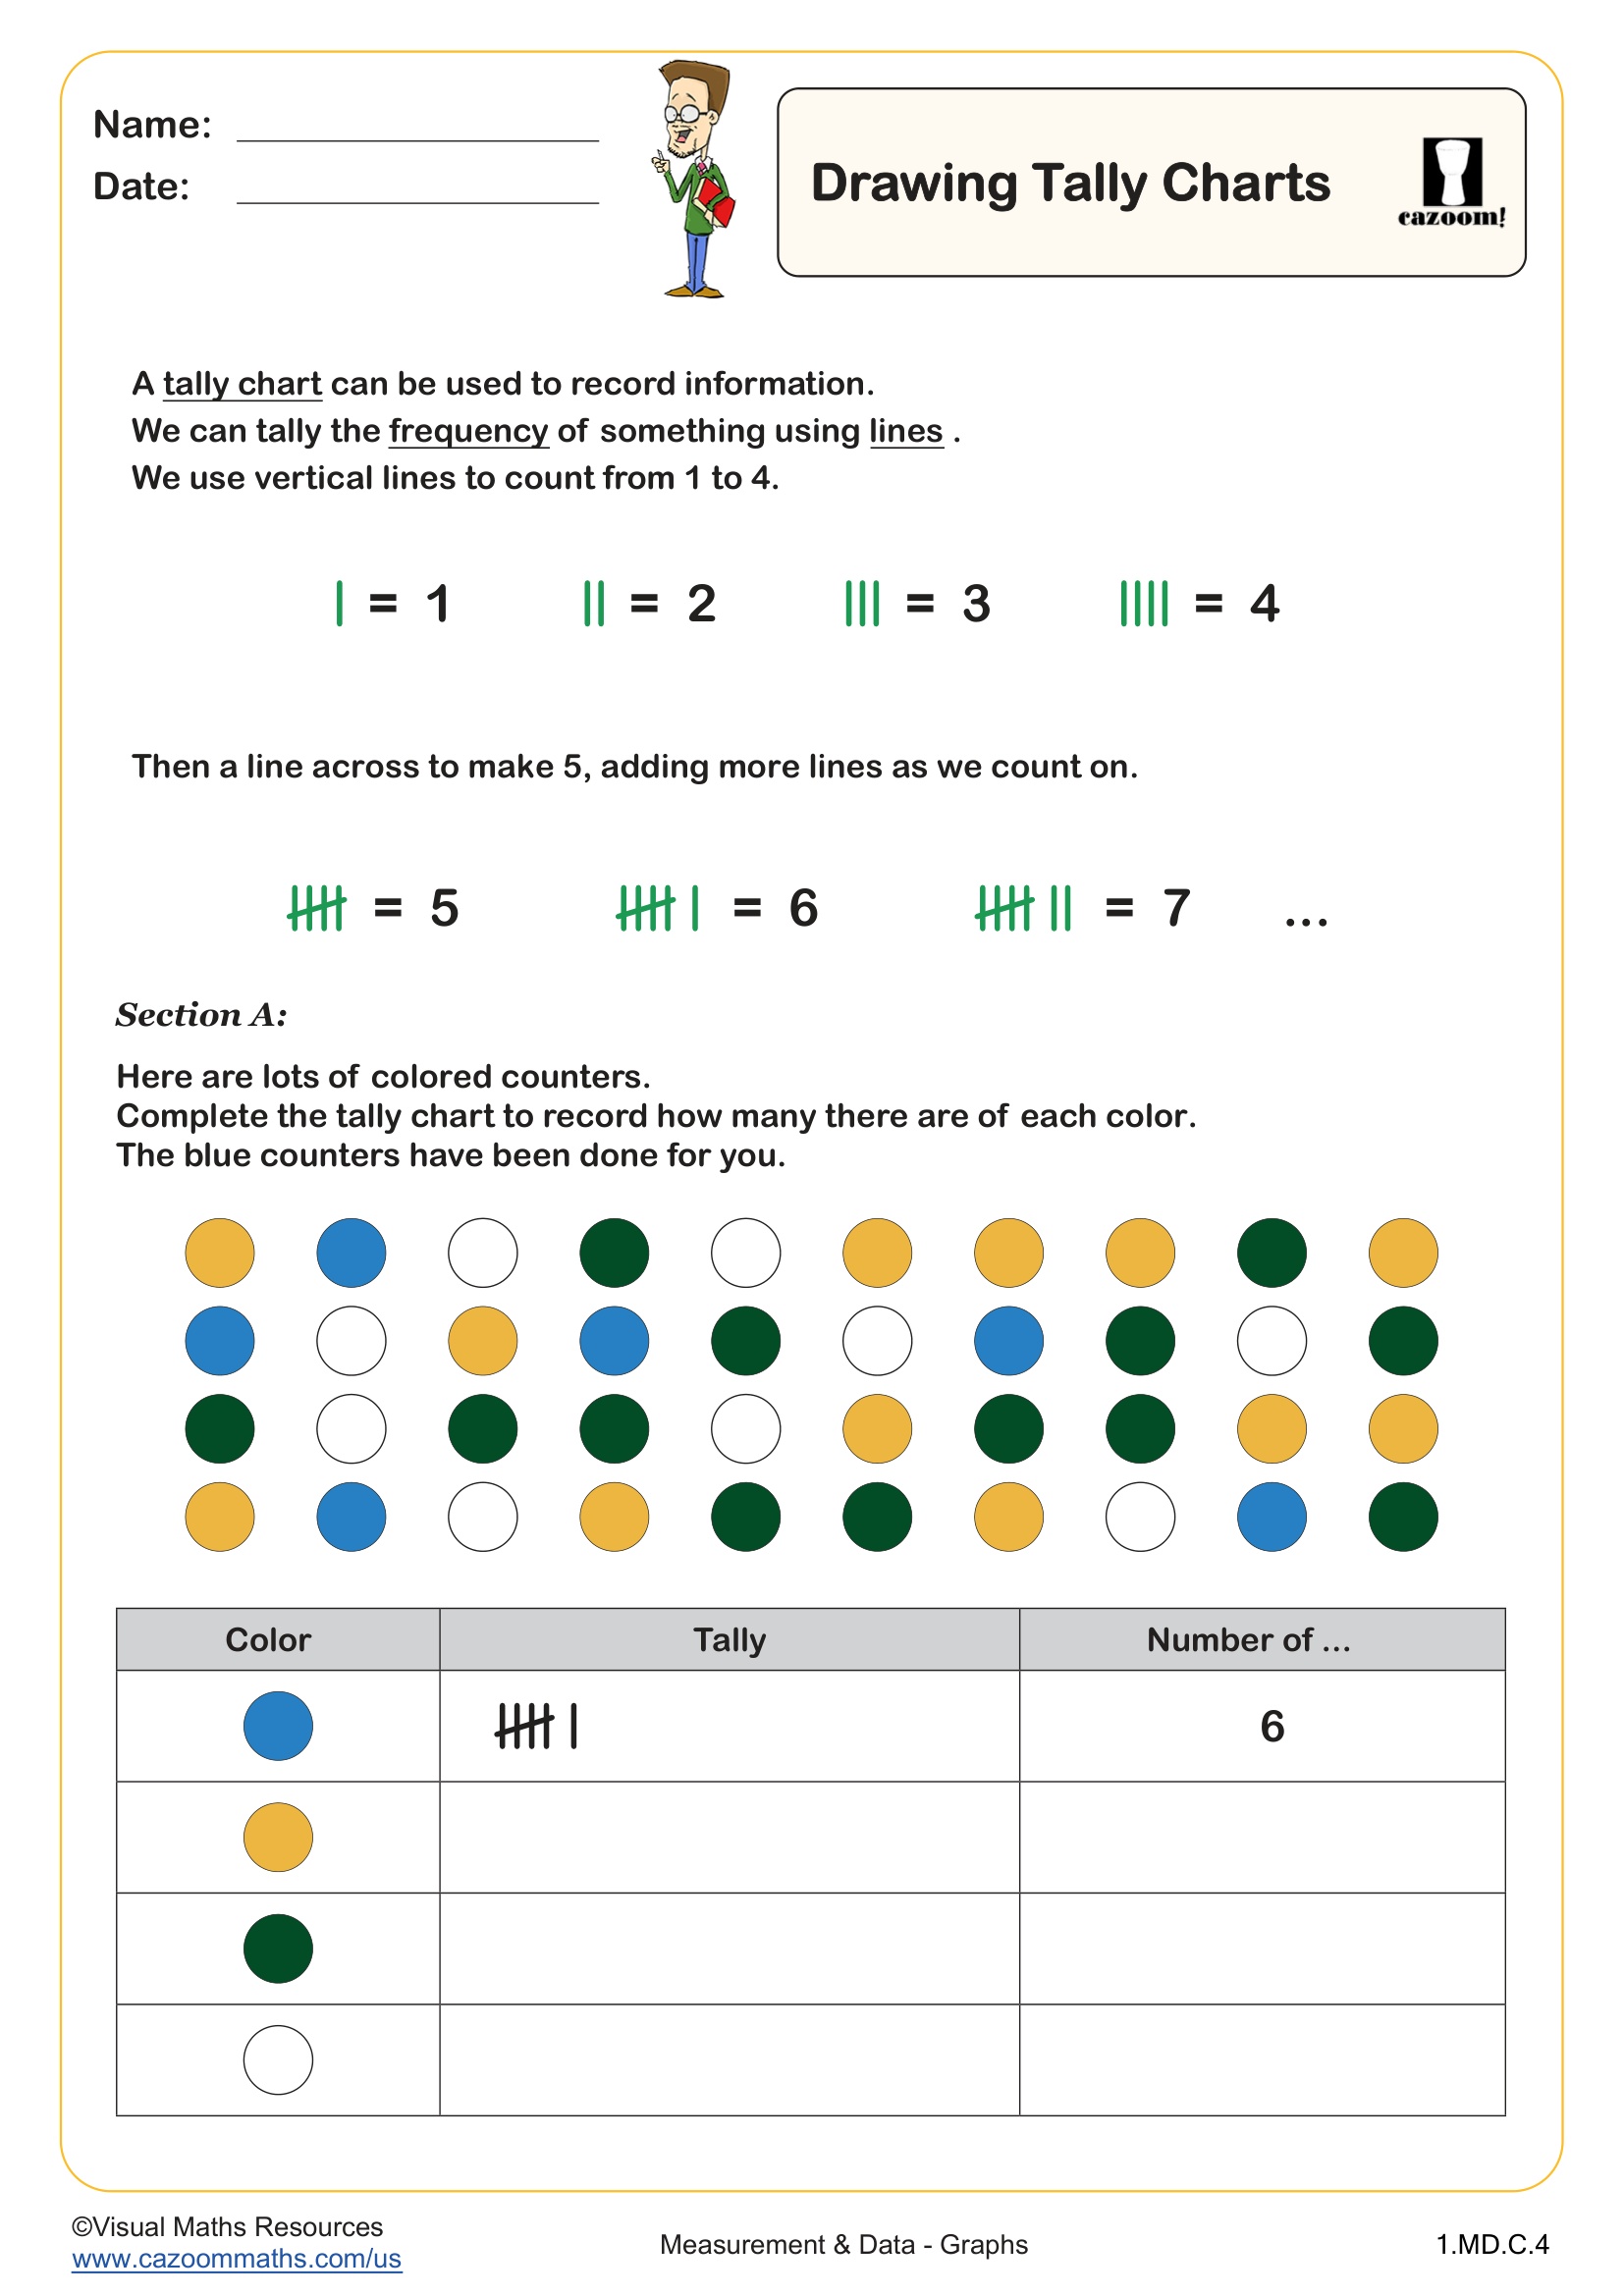
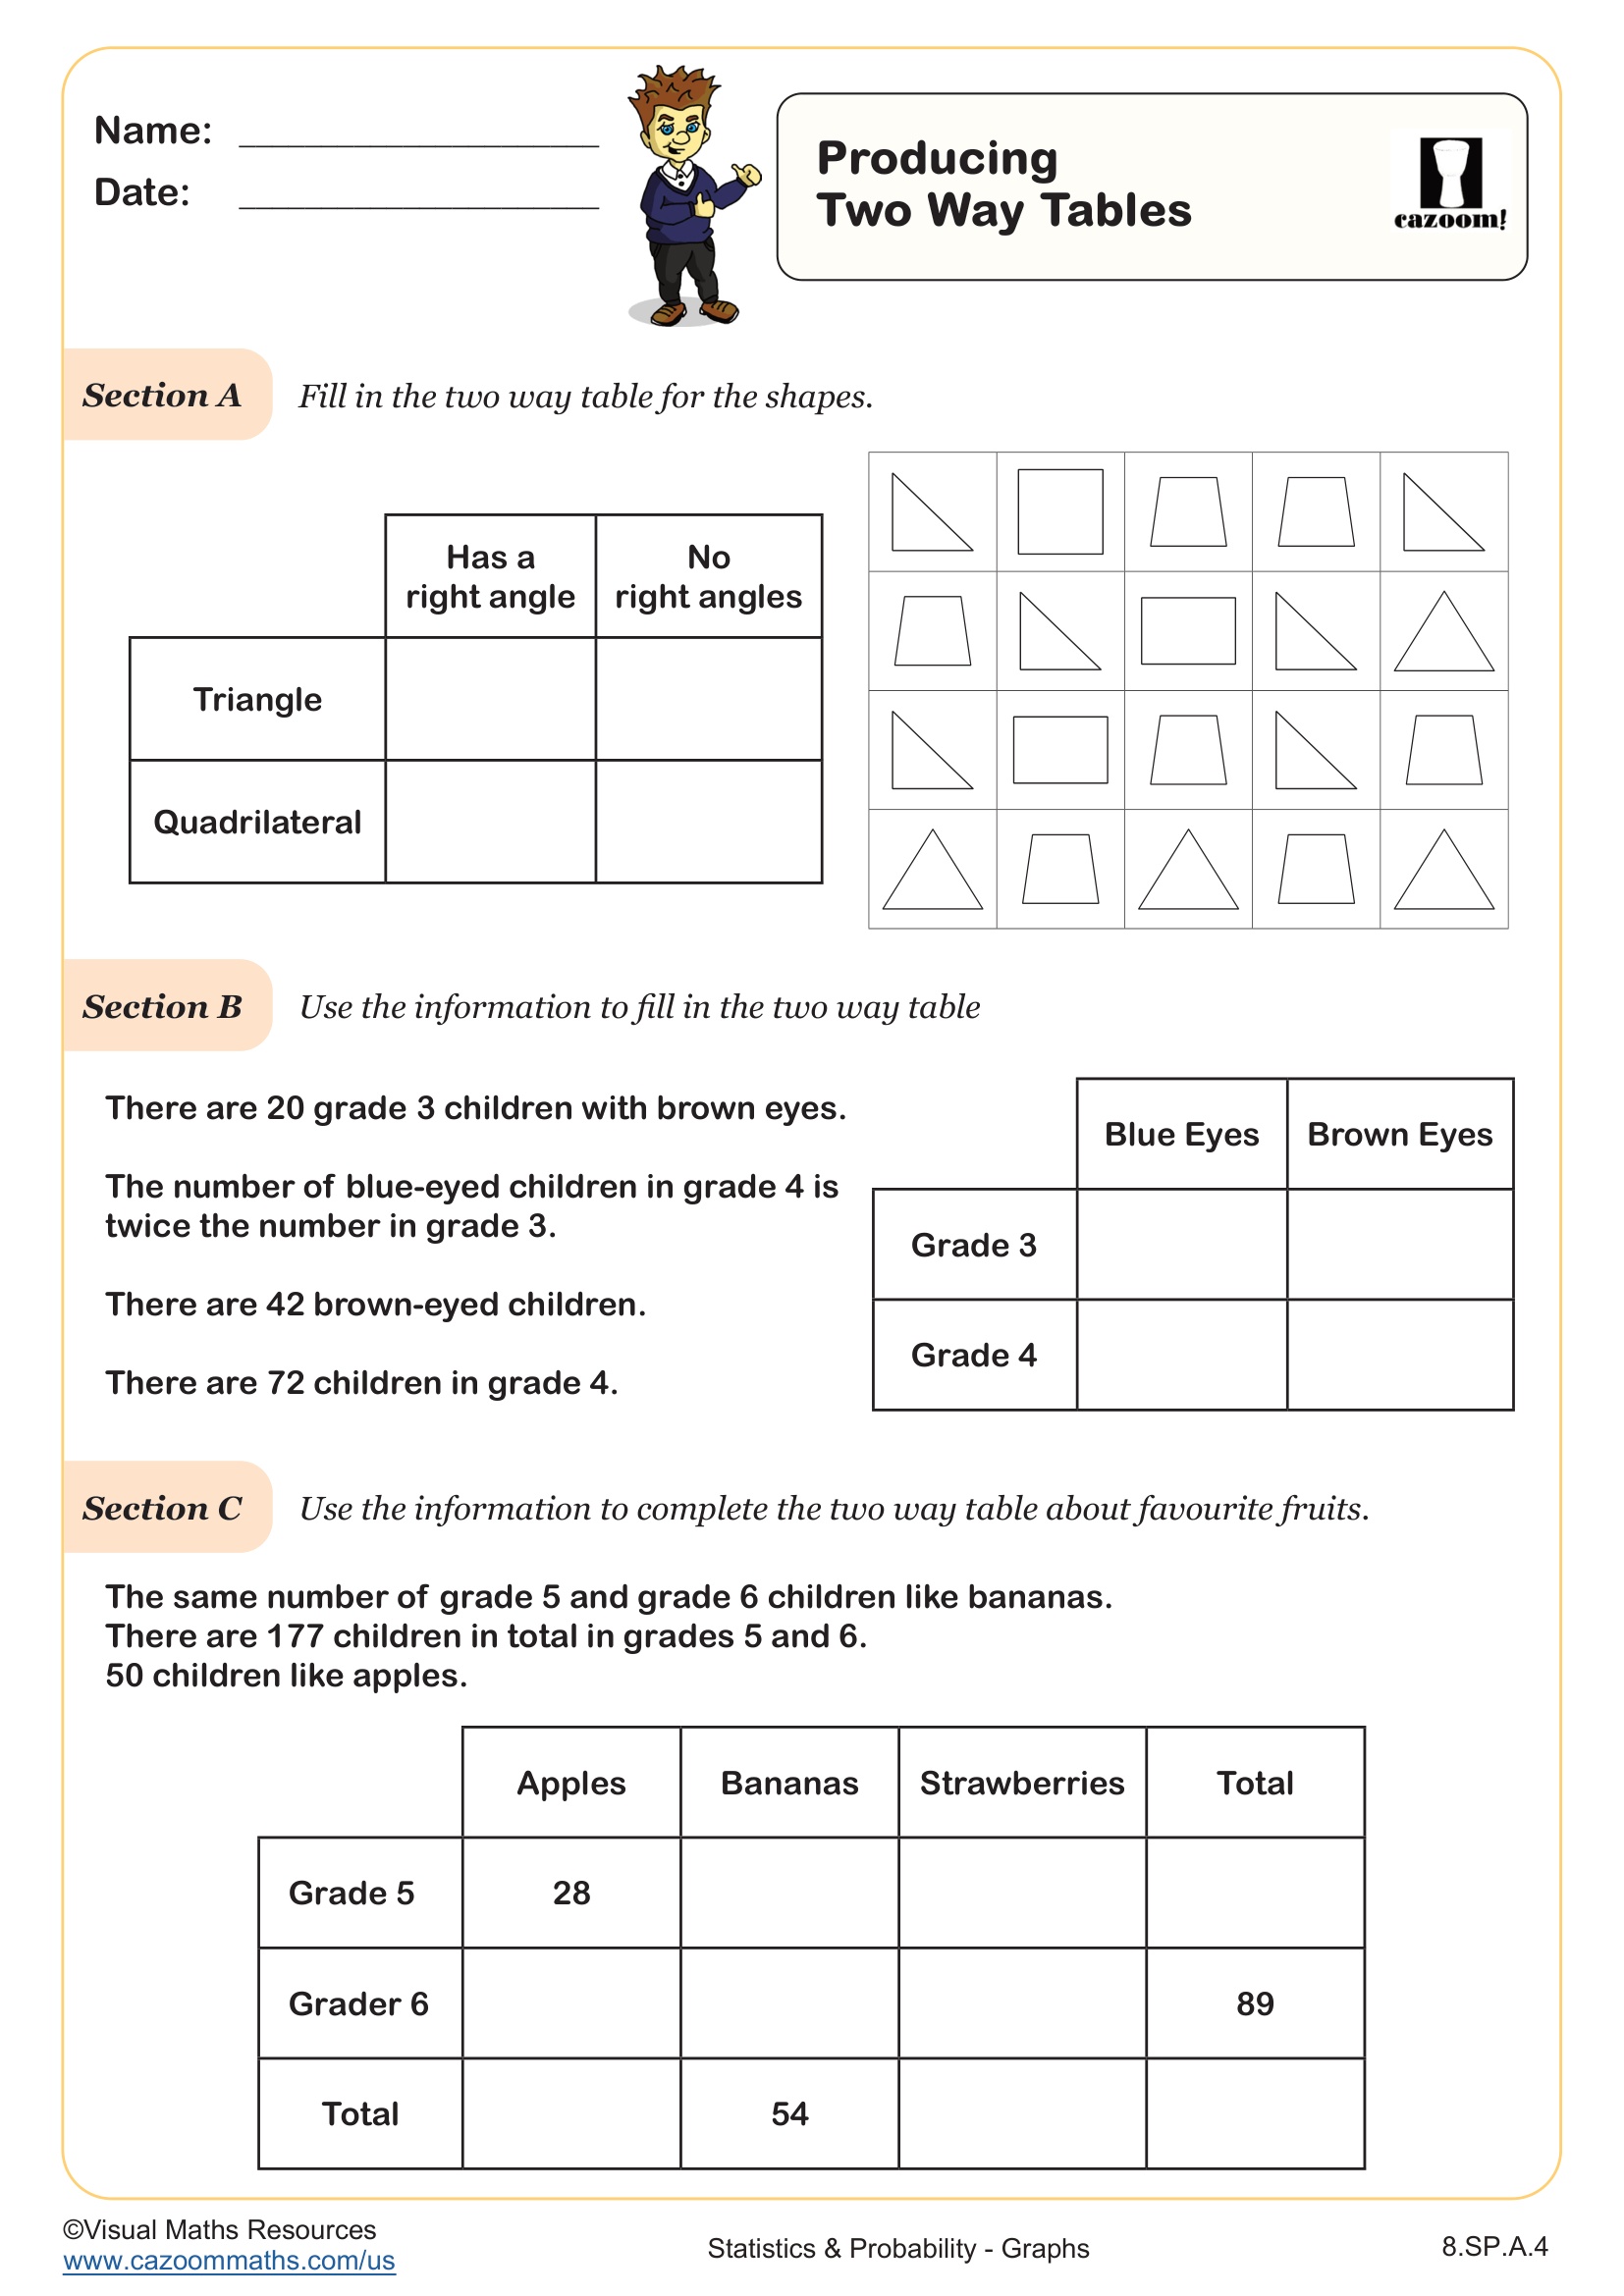
Reading from Two Way Tables WORKSHEET DESCRIPTION
In this worksheet, learners can practise reading information presented in two way tables. there are six tables, each with two questions for learners to answer. These may involve calculating totals or finding fractions in their simplest form. This activity can be followed by the worksheet called Producing Two Way Tables.
All worksheets are created by the team of experienced teachers at Cazoom Math.

RELATED TO Reading from Two Way Tables WORKSHEET
Frequently Asked Questions
This worksheet is designed for 8th Grade students and those taking IM 1 (Integrated Math 1). At these levels, students are ready to interpret statistical data presented in organized formats and work with fraction simplification skills that complement the two-way table analysis.