Back to:
Reading Pie Charts (B) WORKSHEET
Suitable for Grades: 6th Grade
CCSS: 6.SP.B.4
CCSS Description: Display numerical data in plots on a number line, including dot plots, histograms, and box plots.
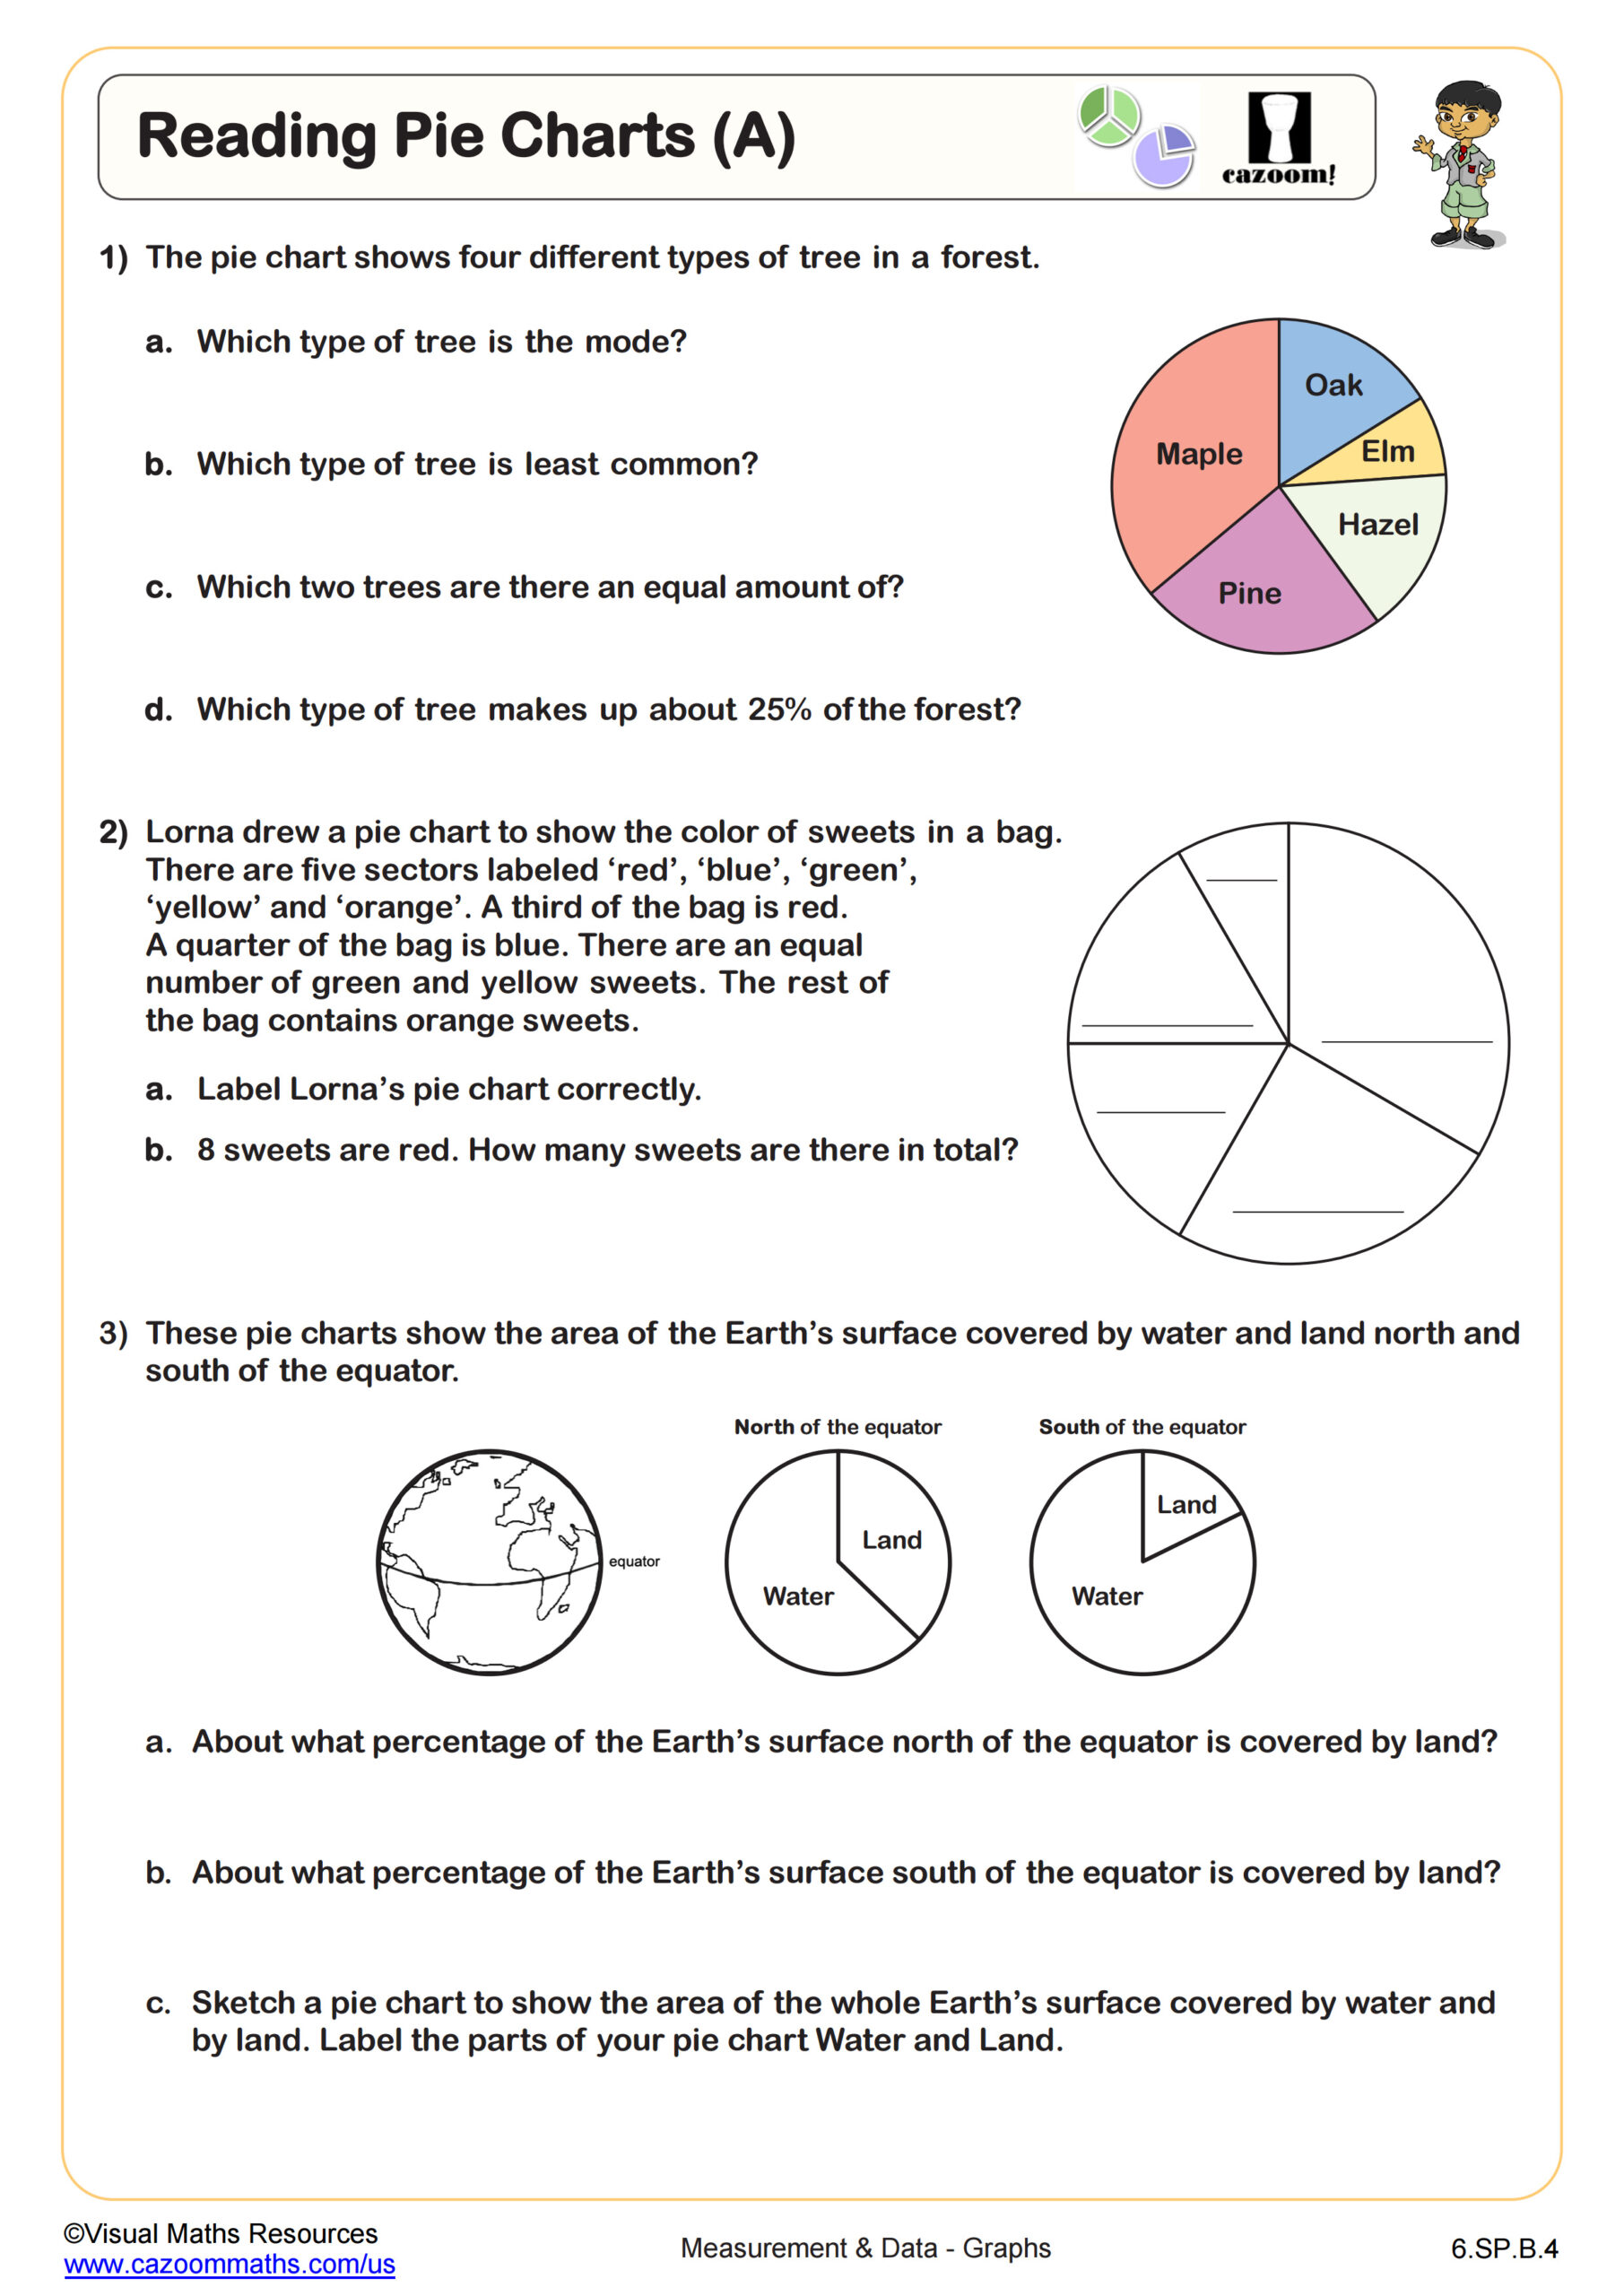
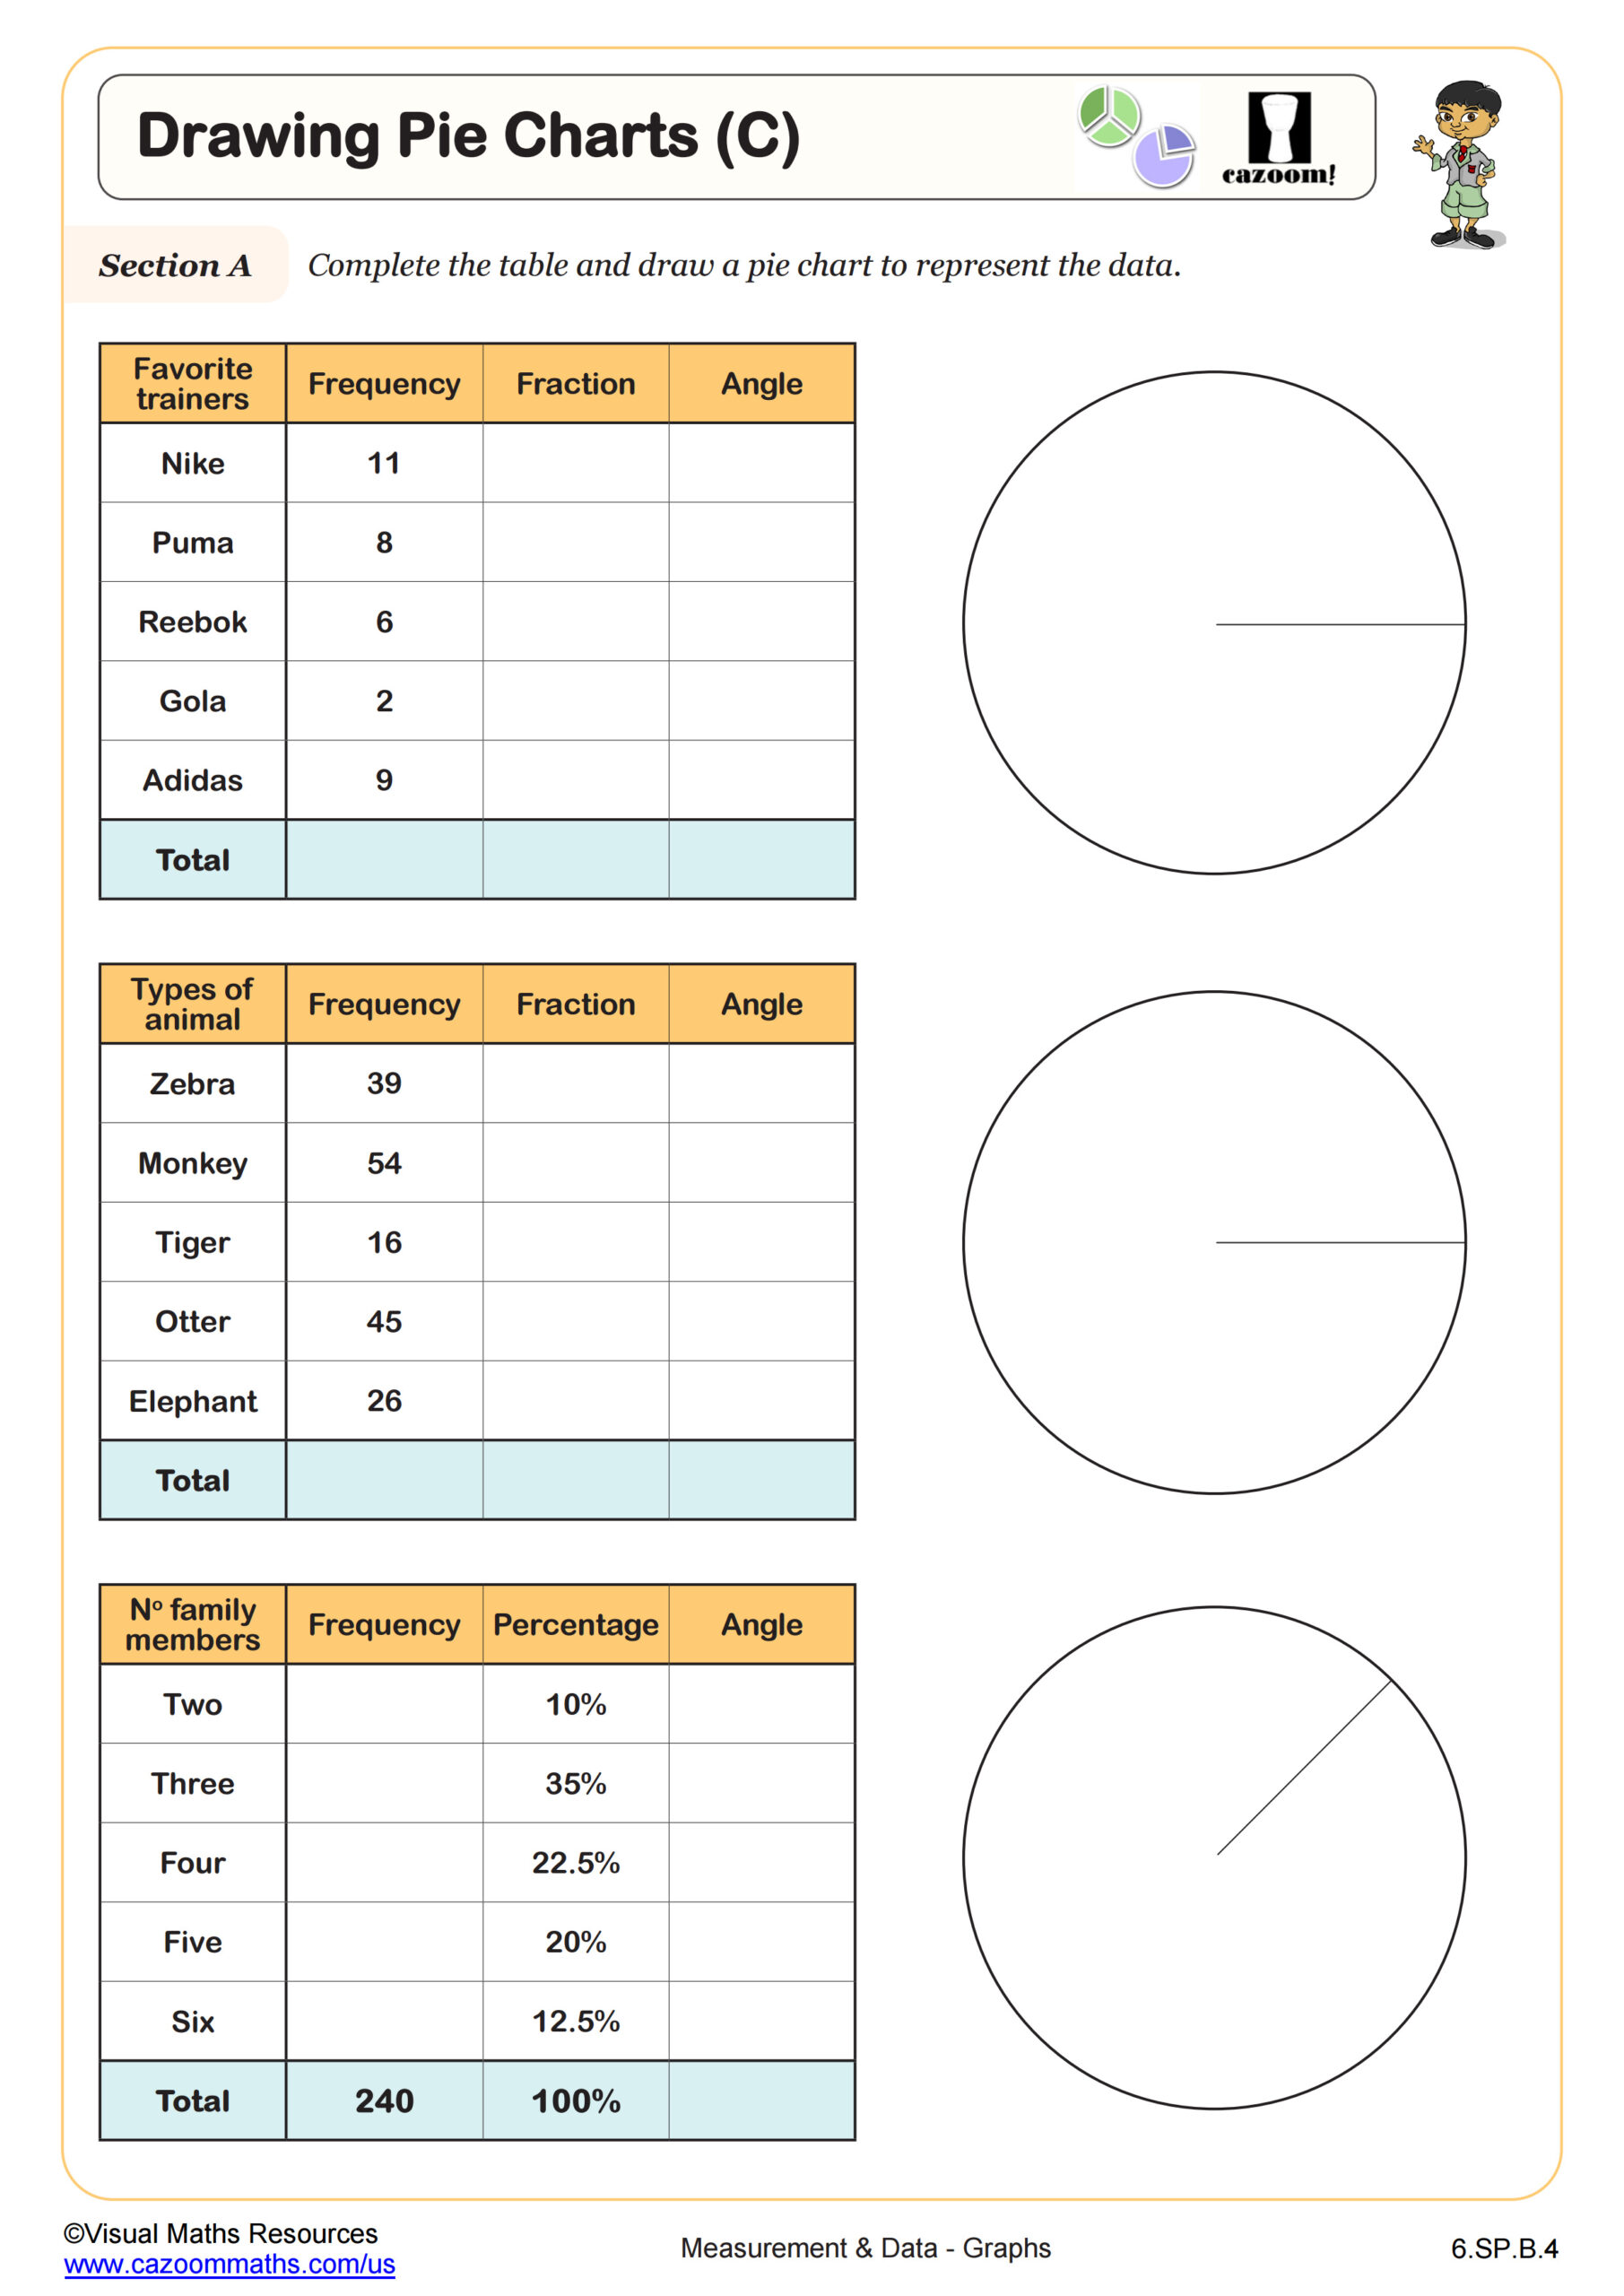
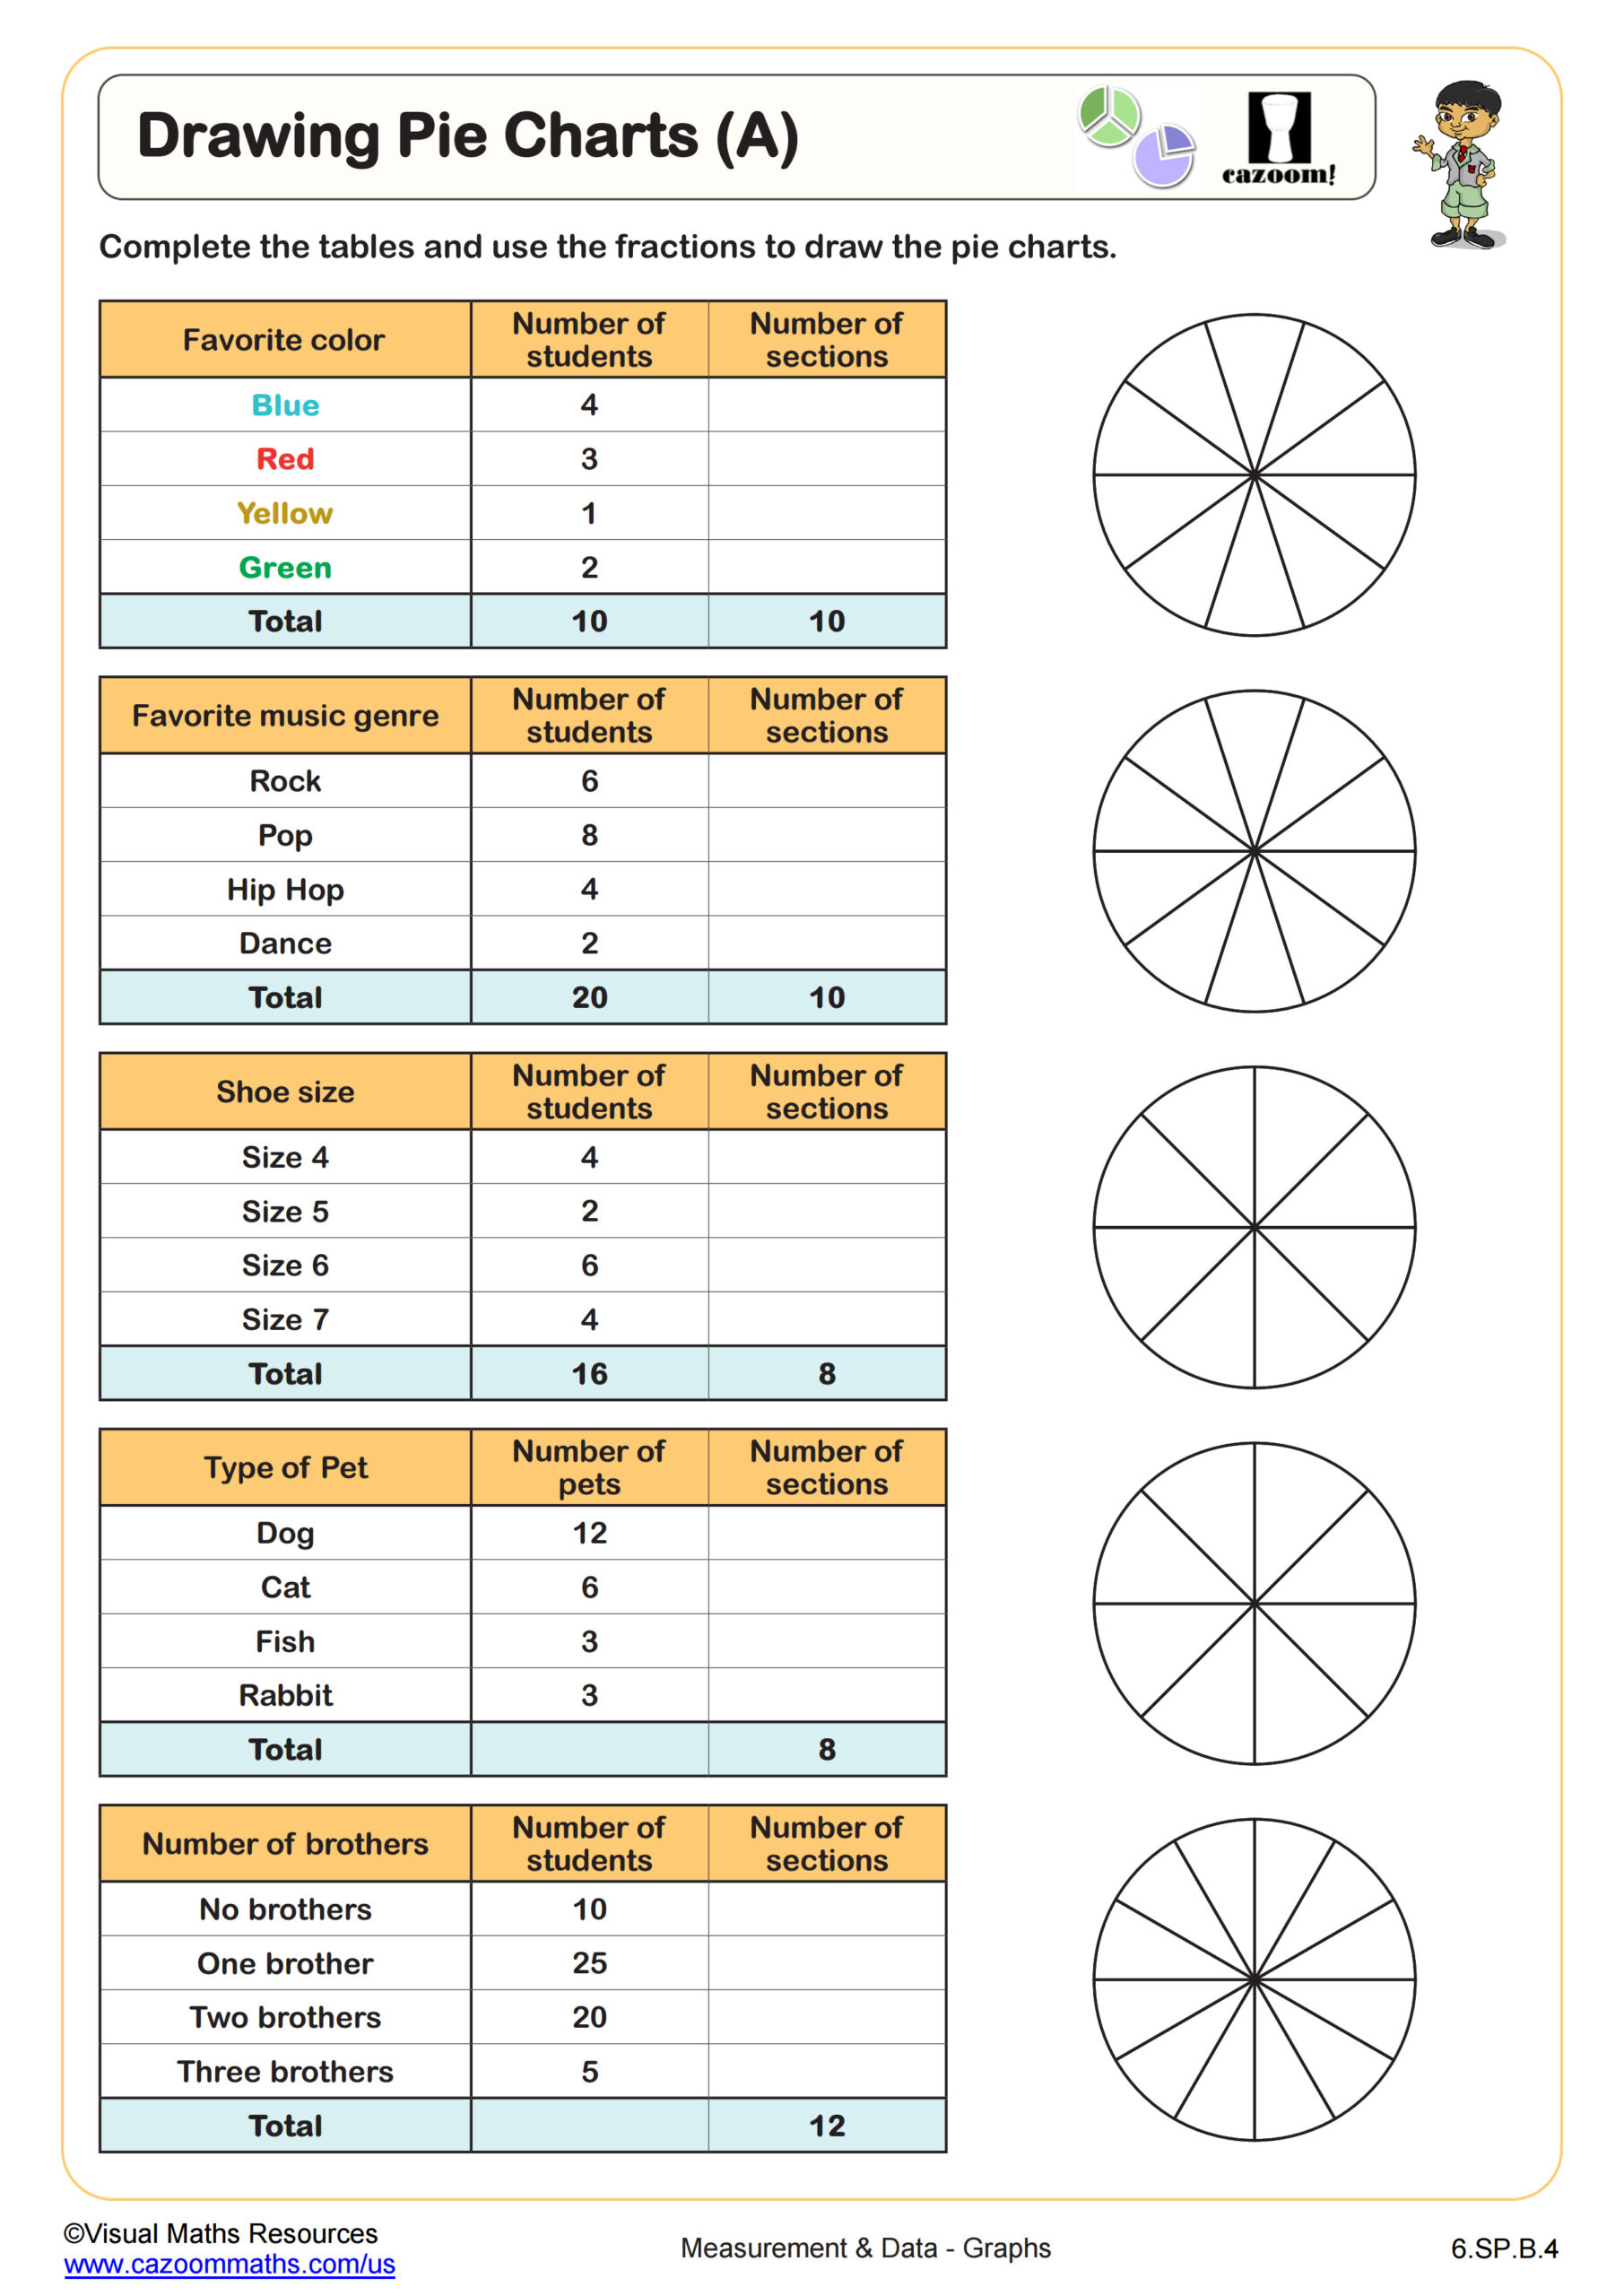
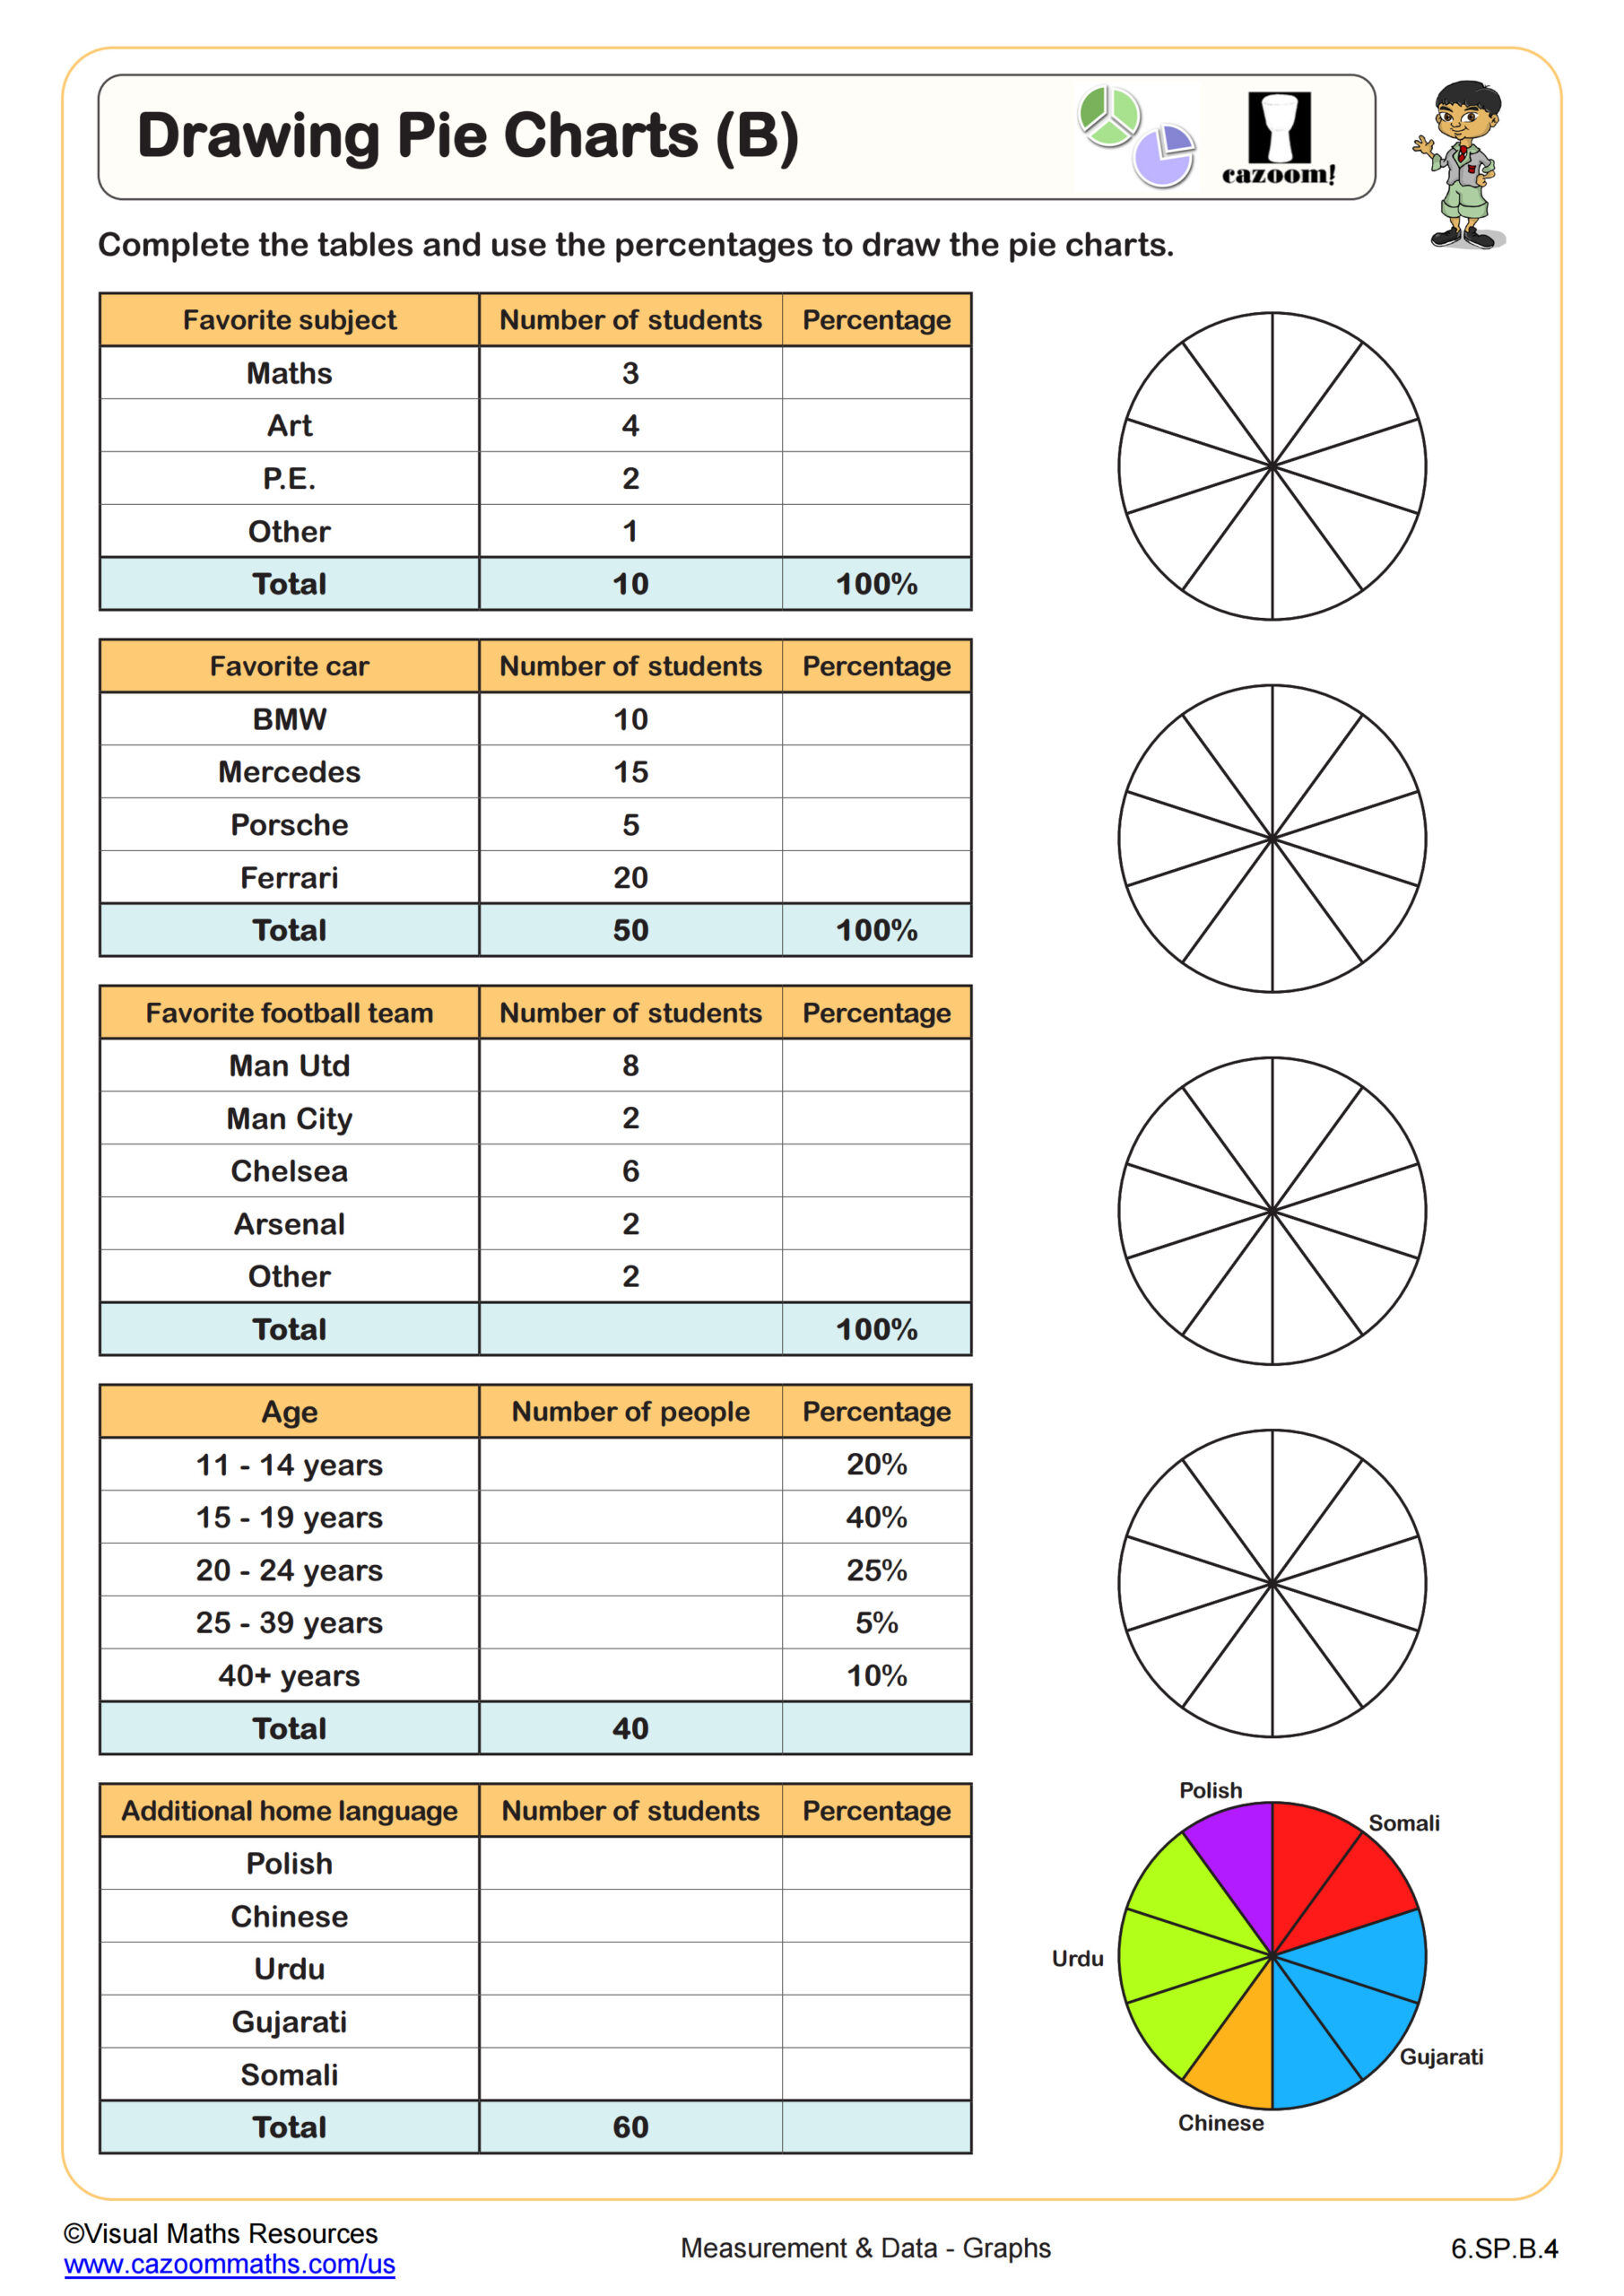
Reading Pie Charts (B) WORKSHEET DESCRIPTION
This worksheet extends on Reading Pie Charts (A). Leaners will need to answer questions about pie charts and use information regarding angles of sectors to calculated frequencies and percentages. Follow this worksheet with Completing Tables from Pie Charts.
All worksheets are created by the team of experienced teachers at Cazoom Math.
 Worksheet")
RELATED TO Reading Pie Charts (B) WORKSHEET
Frequently Asked Questions
This worksheet is designed for 6th grade students who are ready to work with more advanced pie chart concepts. Students at this level should be comfortable with basic fraction and percentage calculations, as they'll need these skills to work with sector angles and convert between different representations of data.