Recipe Proportions (C) WORKSHEET
Recognize and represent proportional relationships between quantities. a. Decide whether two quantities are in a proportional relationship, e.g., by testing for equivalent ratios in a table or graphing on a coordinate plane and observing whether the graph is a straight line through the origin. b. Identify the constant of proportionality (unit rate) in tables, graphs, equations, diagrams, and verbal descriptions of proportional relationships. c. Represent proportional relationships by equations. For example, if total cost t is proportional to the number n of items purchased at a constant price p, the relationship between the total cost and the number of items can be expressed as t = pn. d. Explain what a point (x, y) on the graph of a proportional relationship means in terms of the situation, with special attention to the points (0, 0) and (1, r) where r is the unit rate.
Recipe Proportions (C) WORKSHEET DESCRIPTION
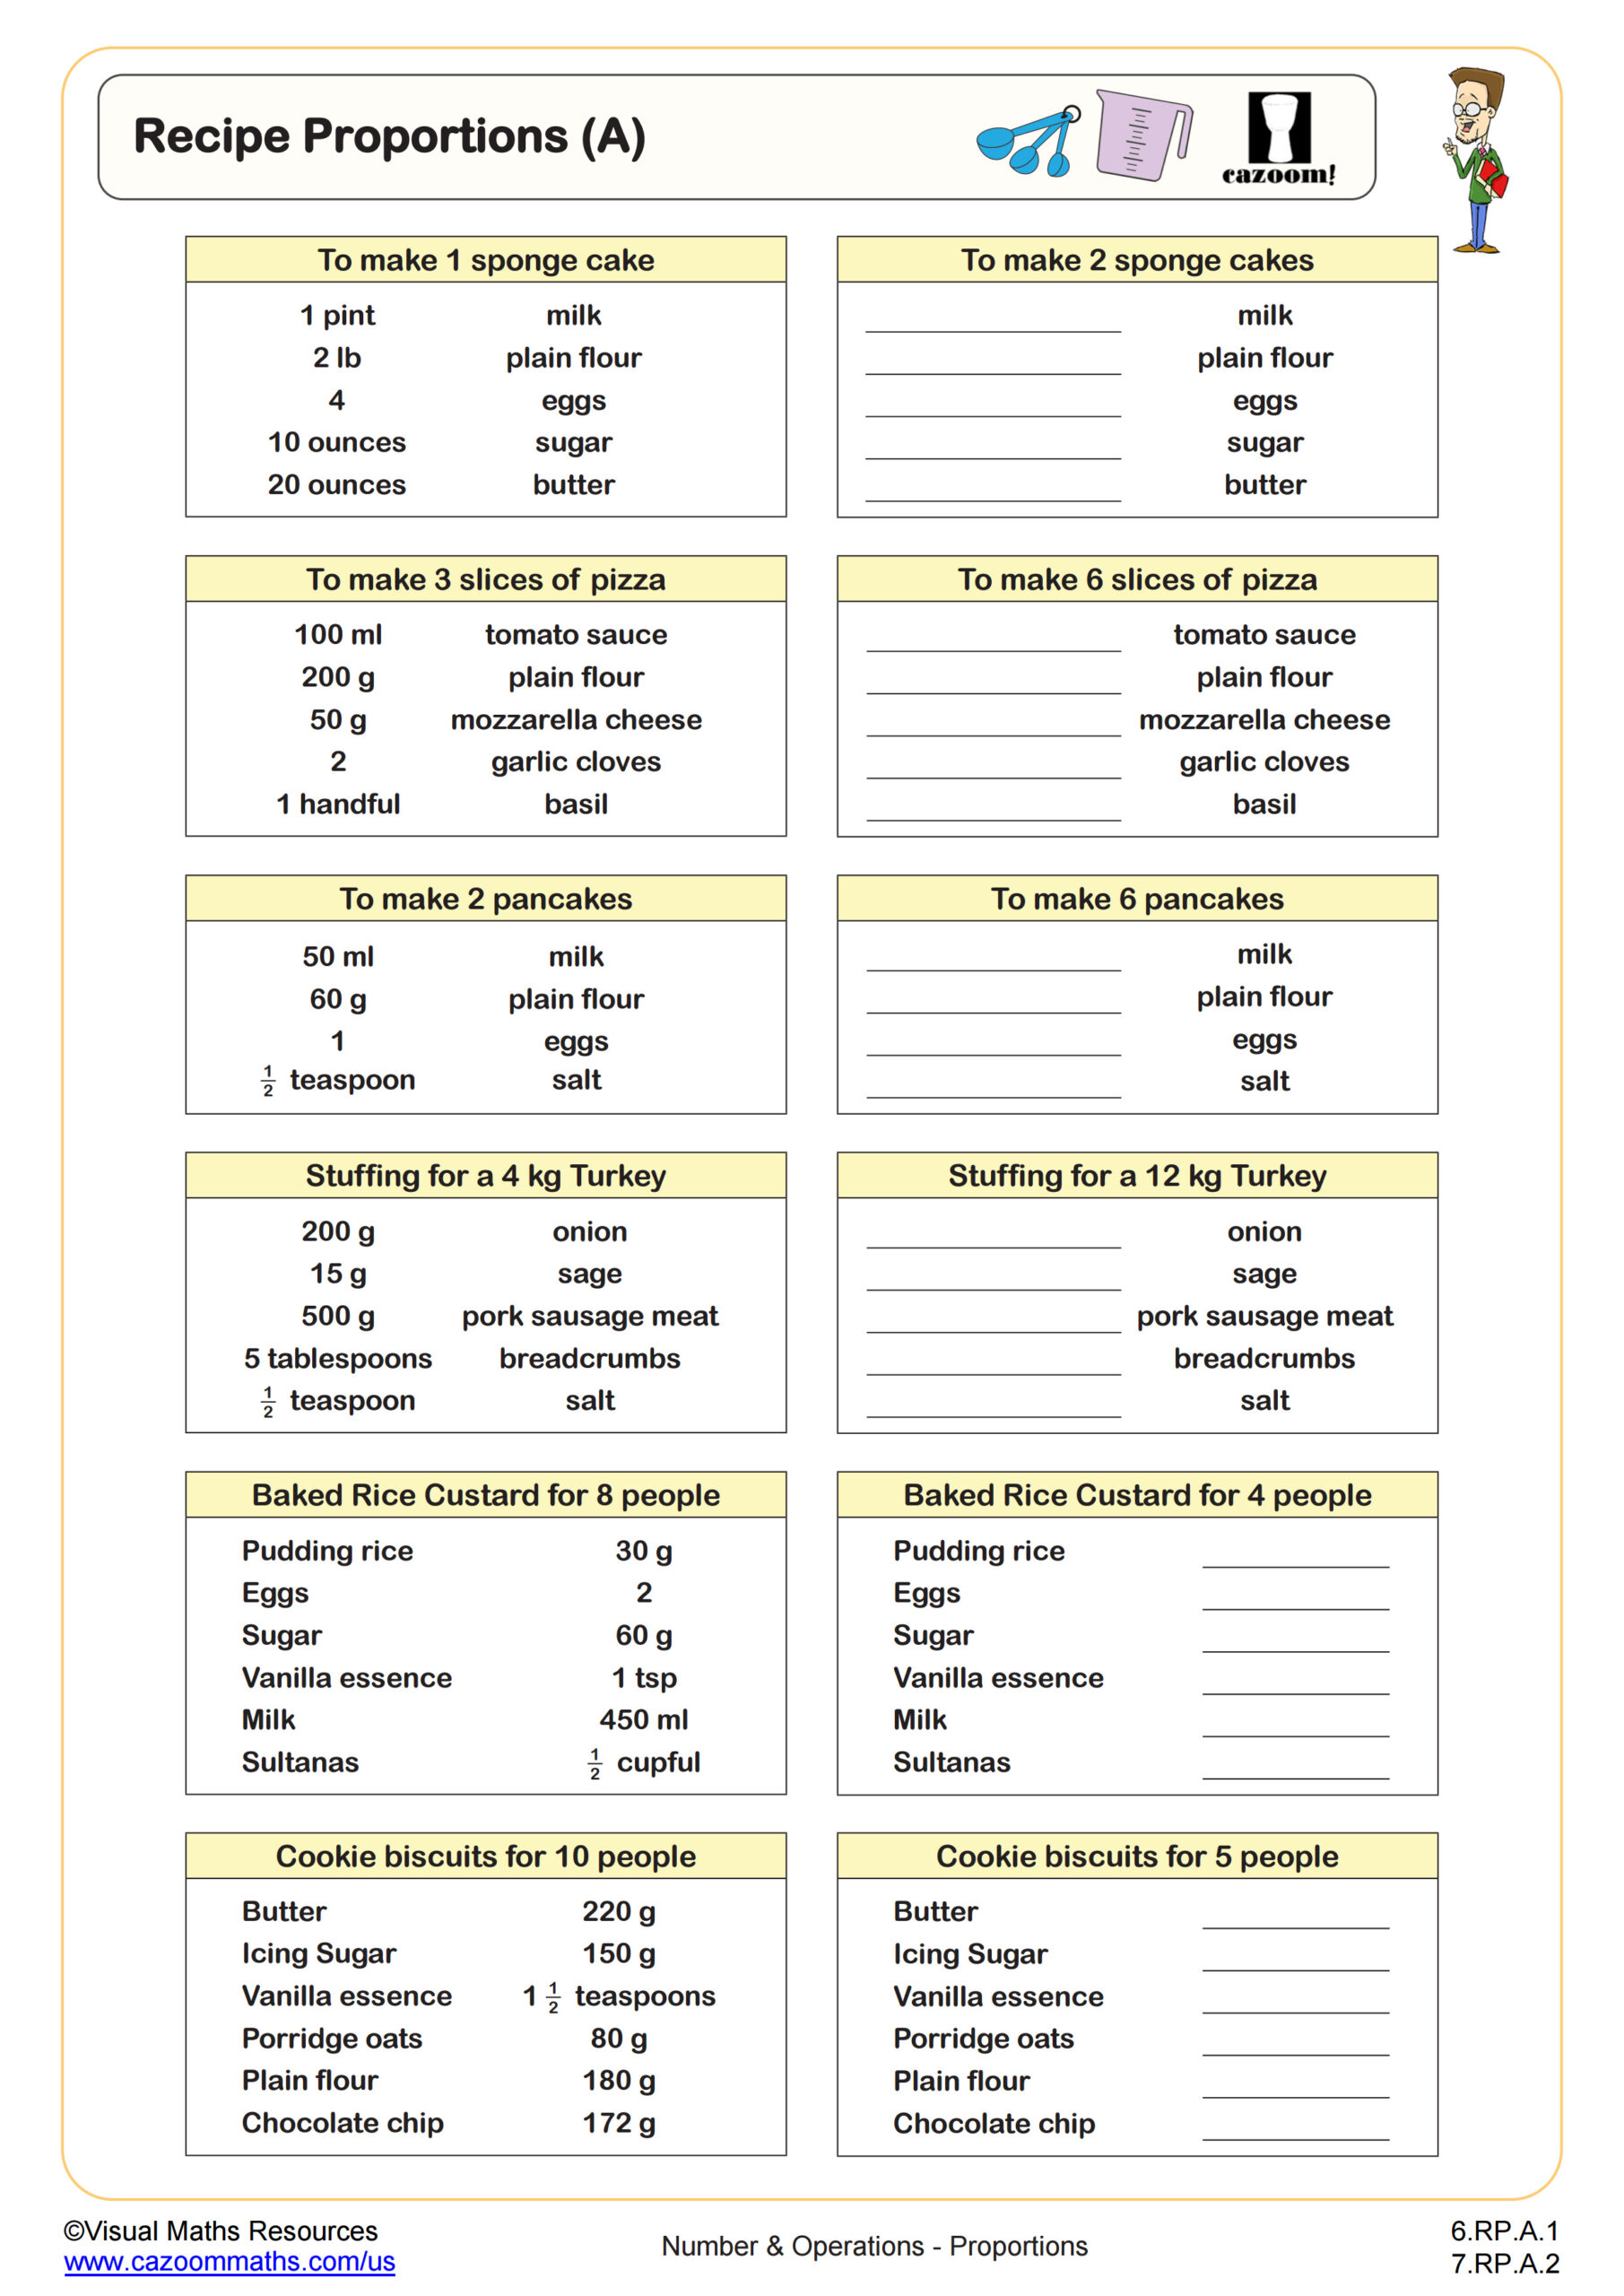
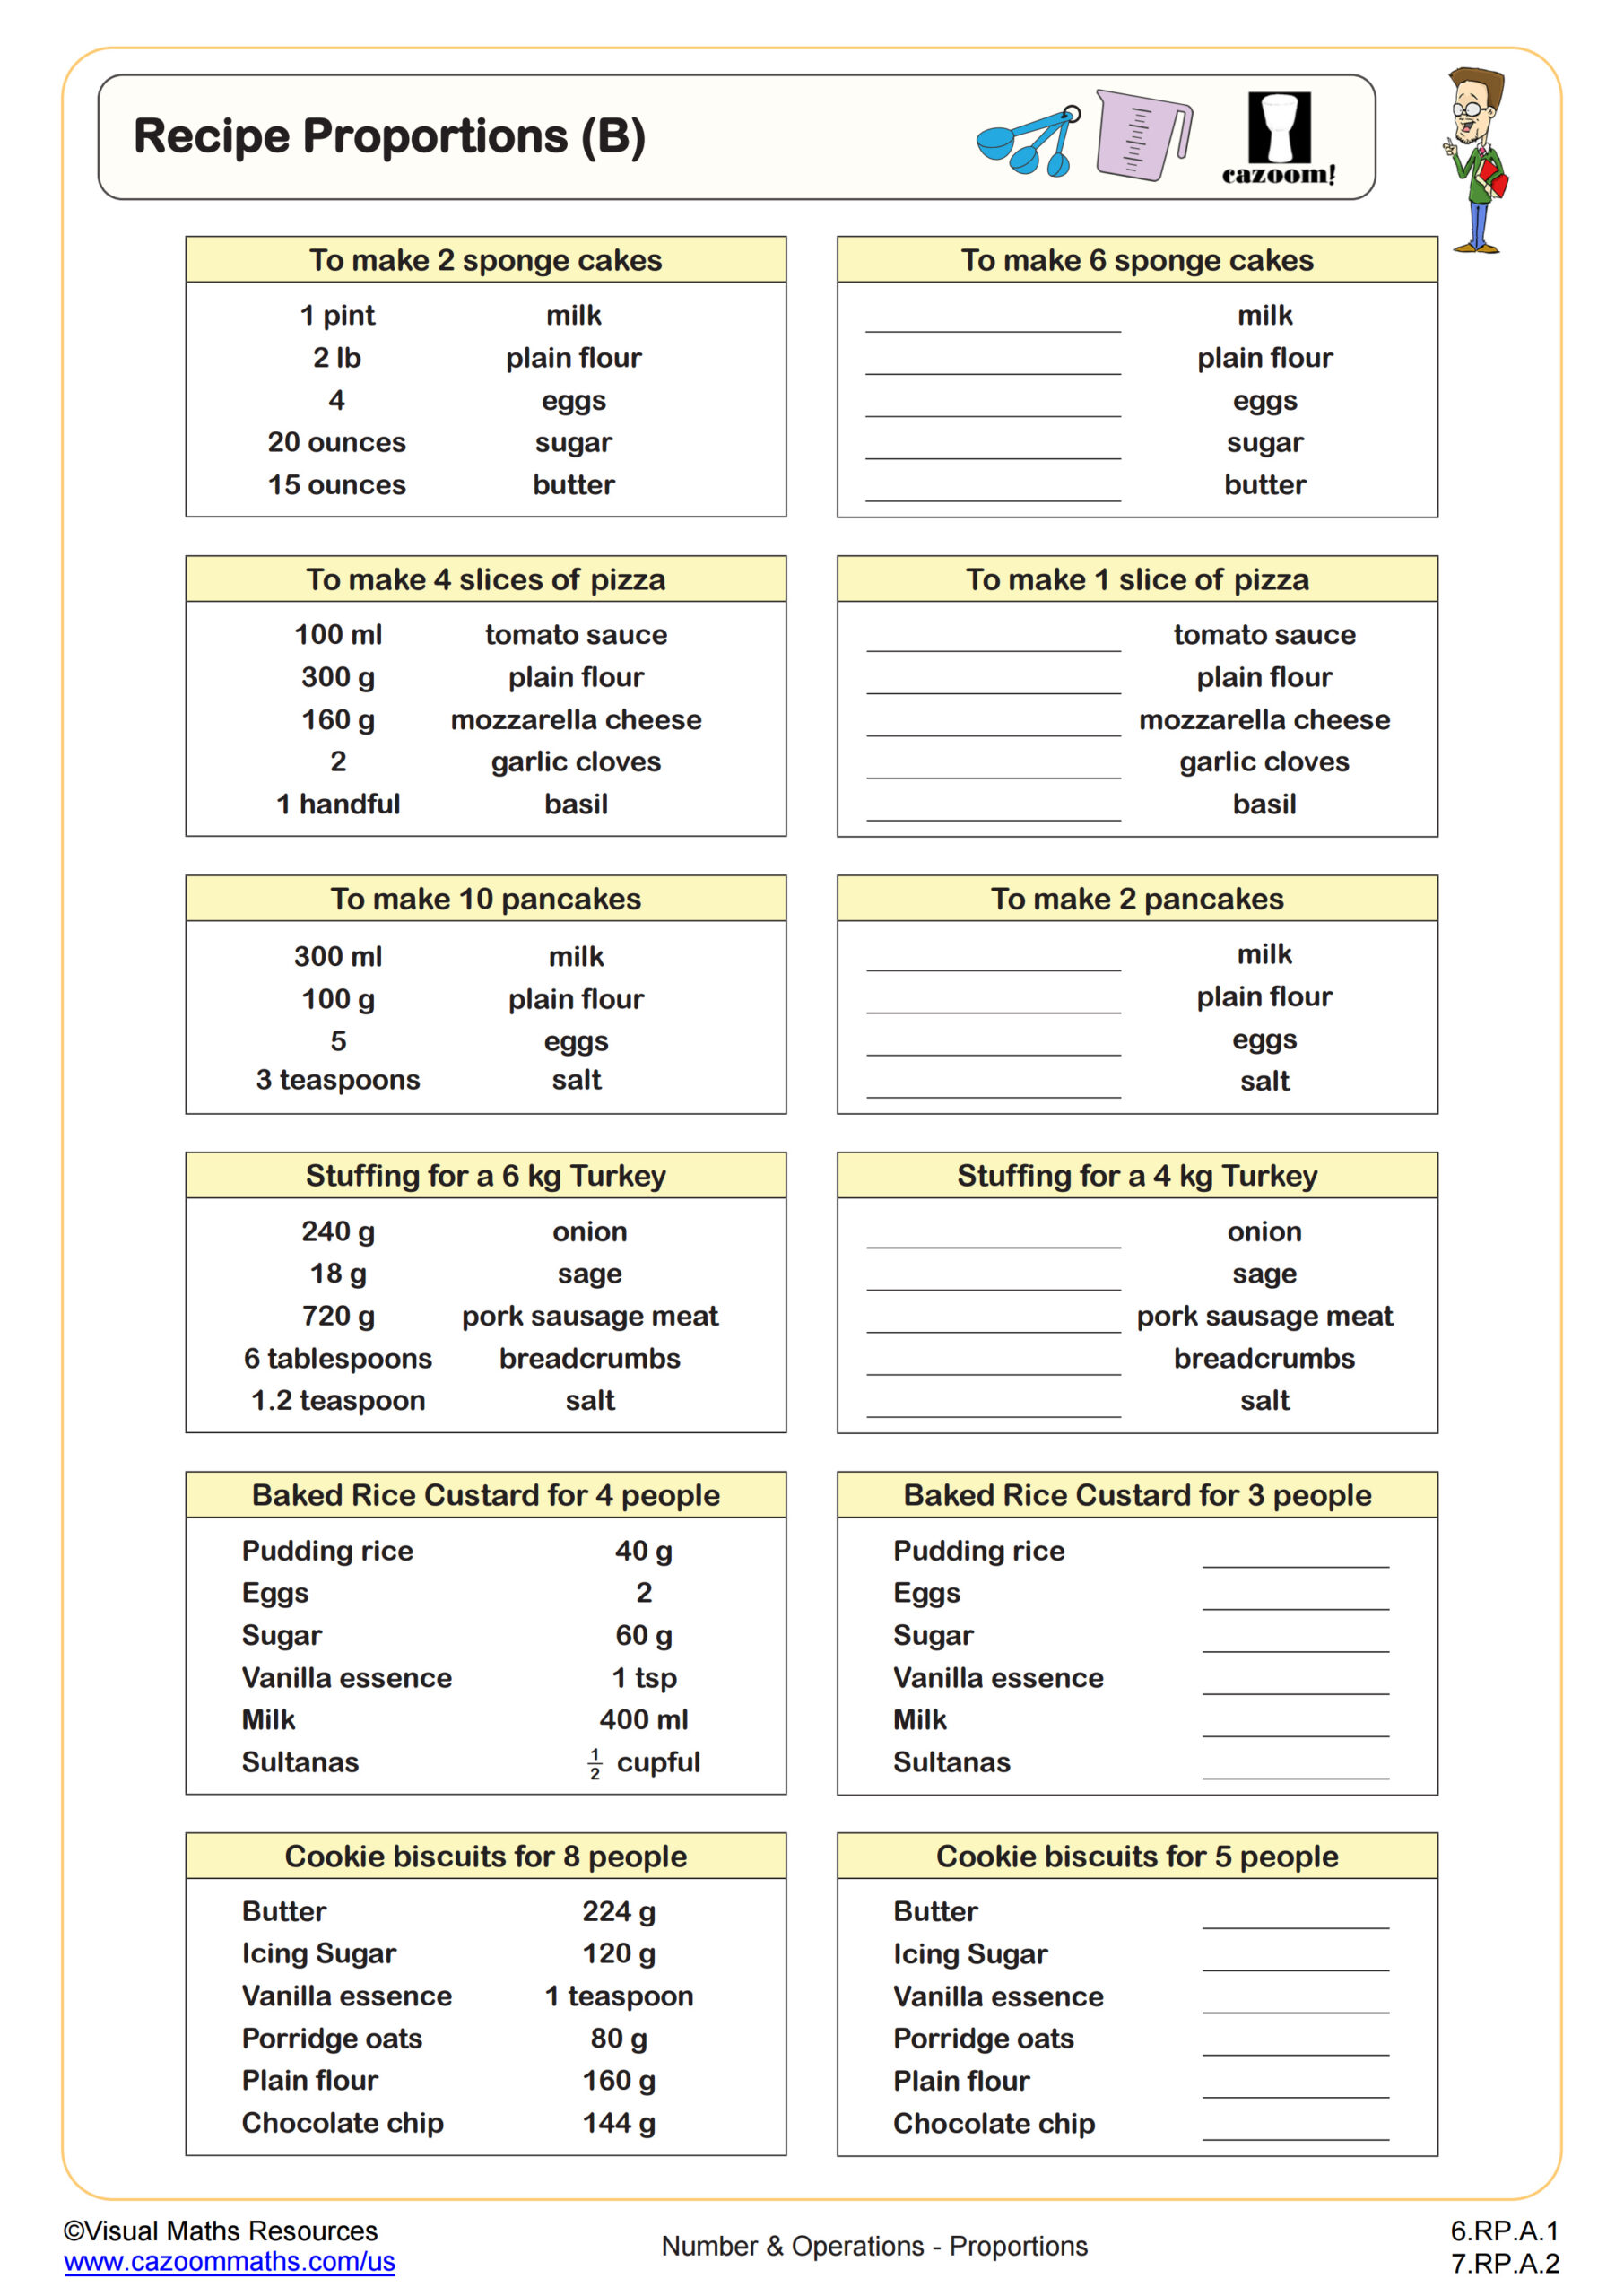
This is the last in our worksheet series of recipe problems and is ideal for any students who would benefit from the extra multiplication and division challenge that Recipes Proportions ( C) brings. Recipe problems are the perfect conceptual introduction to direct proportion for many students. They remain ever popular with exam boards and let’s face it, form an important life skill!
In Recipe Proportions ( C ), students have 6 recipe cards that need scaling by integer and fractional scale factors. Examples include recipes from 6 to 15 and 8 to 20.
Your learners will be faced with challenges such as 1 ½ x 2 ½ and should be encouraged to complete this worksheet without a calculator.
All worksheets are created by the team of experienced teachers at Cazoom Math.
 Worksheet")
RELATED TO Recipe Proportions (C) WORKSHEET
Frequently Asked Questions
This recipe proportions (c) worksheet is designed for students in 6th Grade and 7th Grade and aligns with Common Core State Standards.