Reverse Percentages - Using a Bar Model (A) WORKSHEET
Recognize and represent proportional relationships between quantities. a. Decide whether two quantities are in a proportional relationship, e.g., by testing for equivalent ratios in a table or graphing on a coordinate plane and observing whether the graph is a straight line through the origin. b. Identify the constant of proportionality (unit rate) in tables, graphs, equations, diagrams, and verbal descriptions of proportional relationships. c. Represent proportional relationships by equations. For example, if total cost t is proportional to the number n of items purchased at a constant price p, the relationship between the total cost and the number of items can be expressed as t = pn. d. Explain what a point (x, y) on the graph of a proportional relationship means in terms of the situation, with special attention to the points (0, 0) and (1, r) where r is the unit rate.
Reverse Percentages - Using a Bar Model (A) WORKSHEET DESCRIPTION
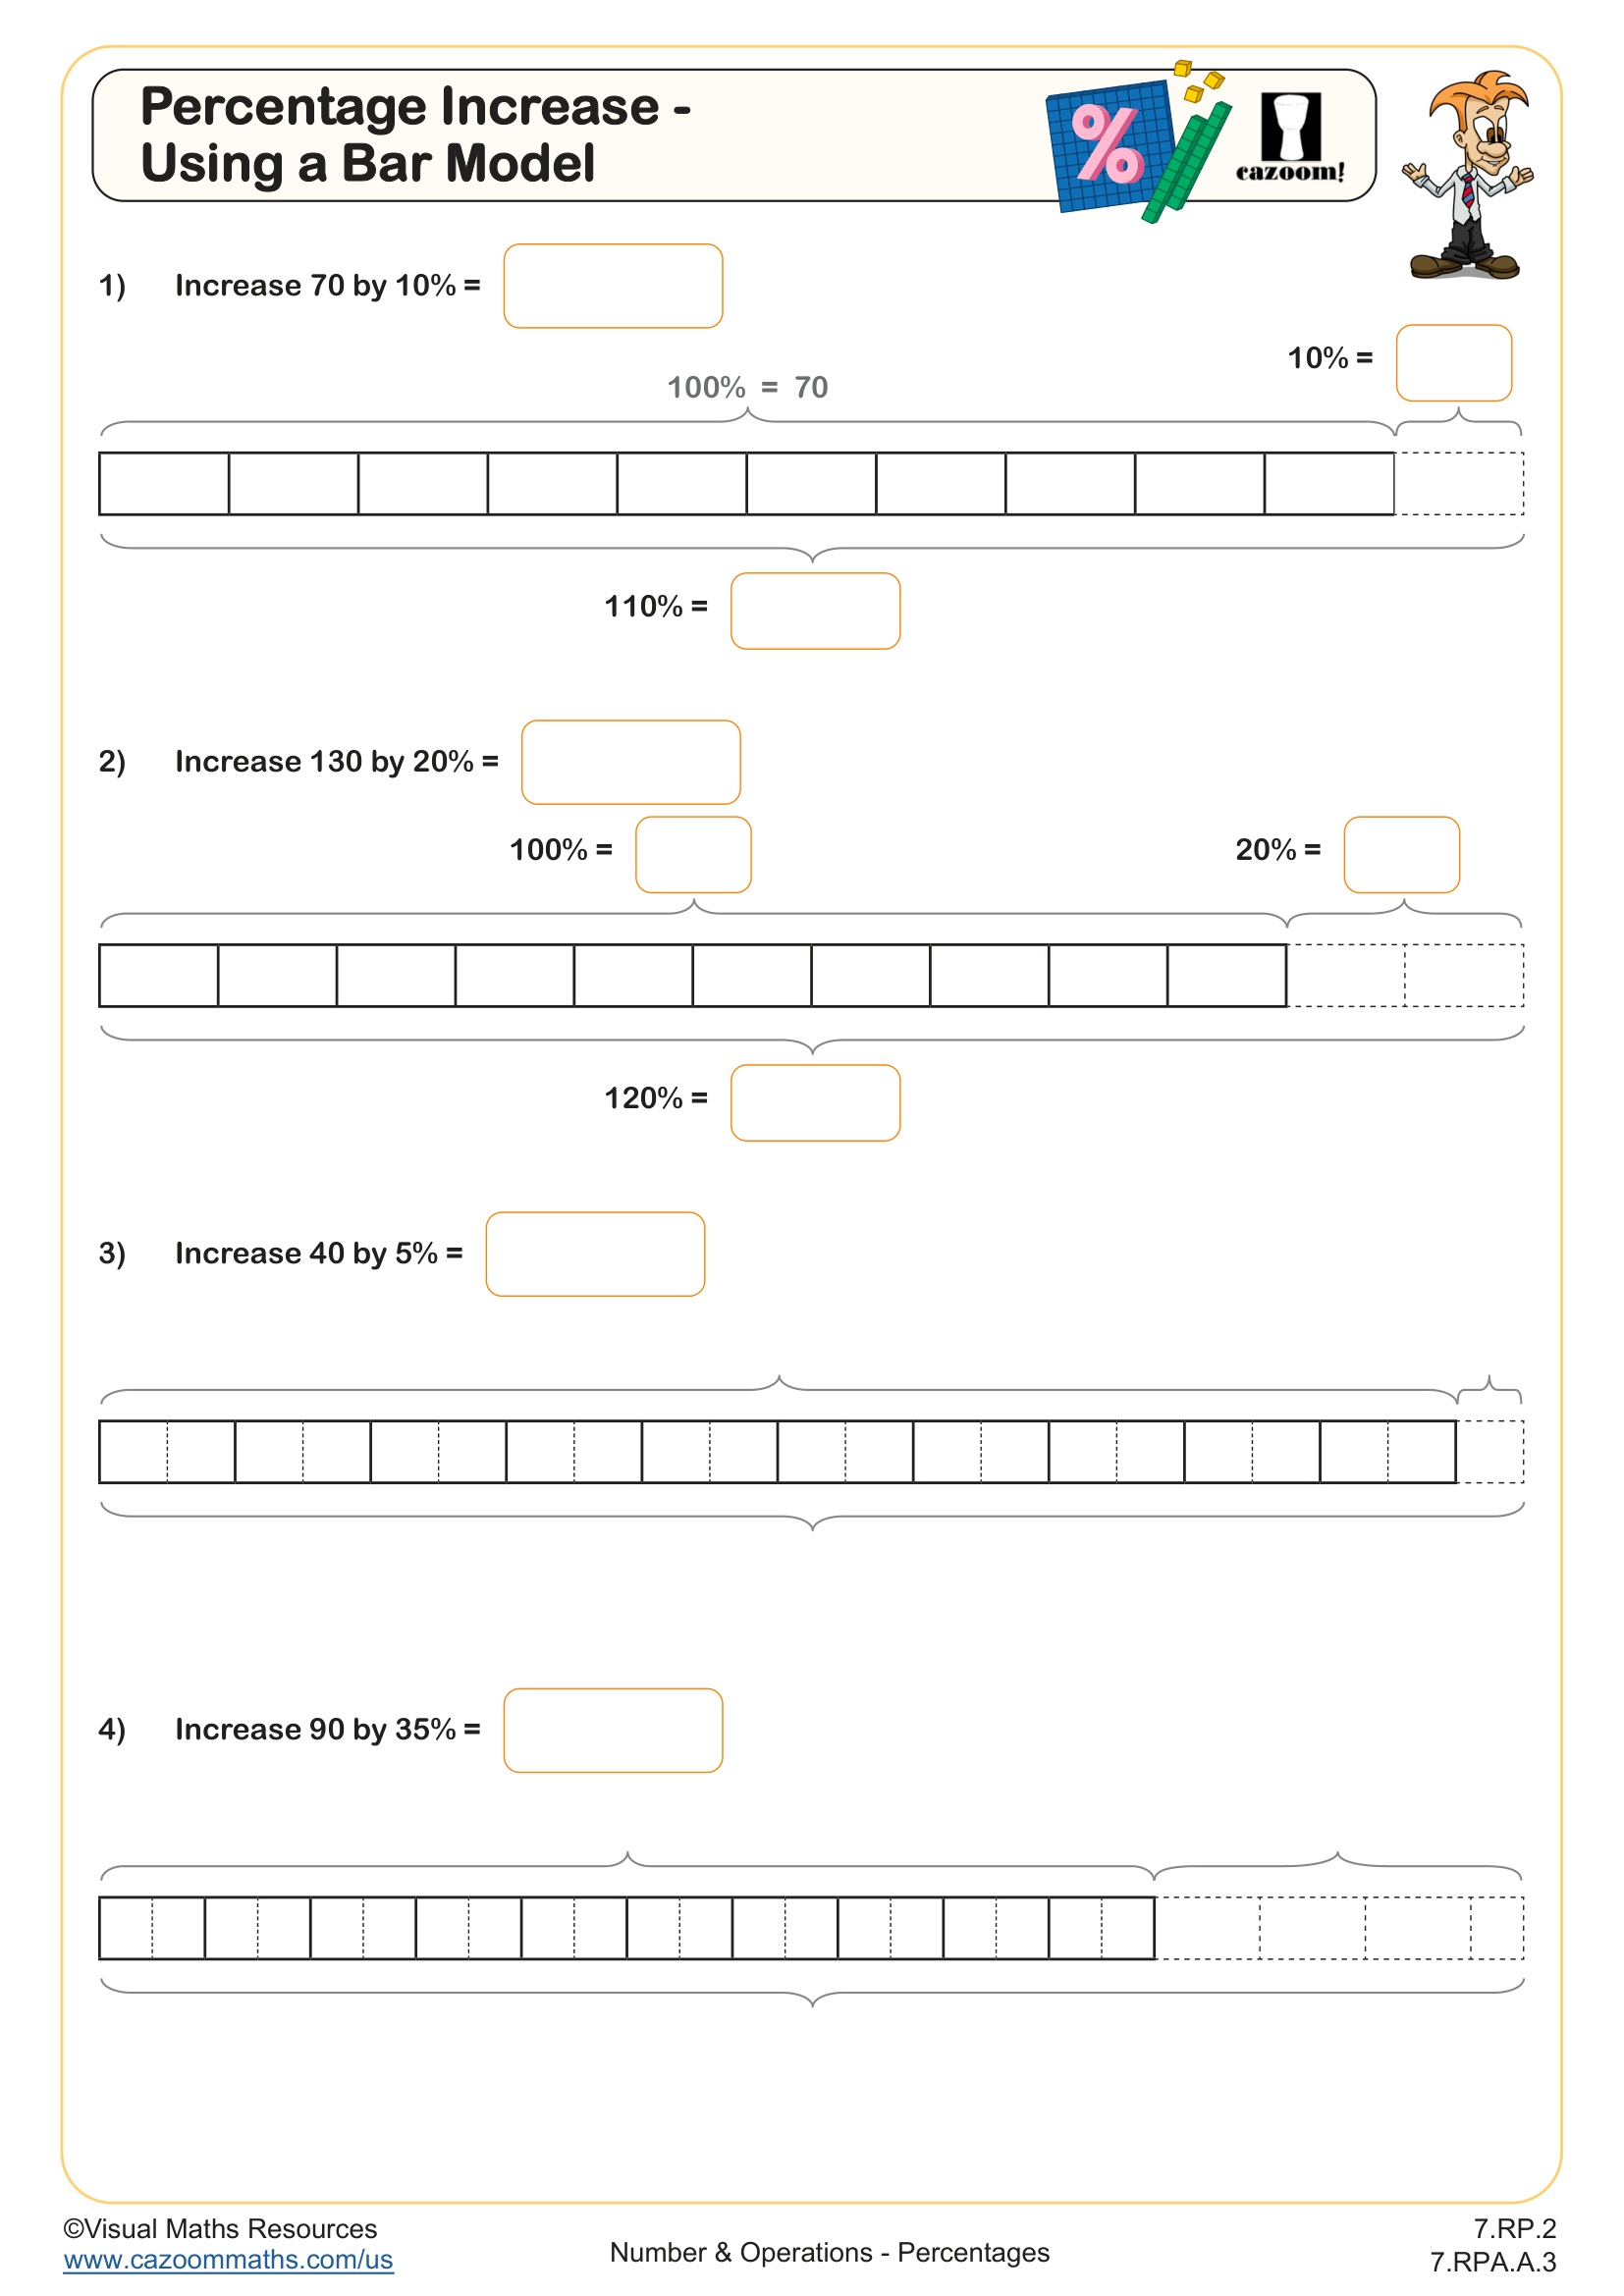
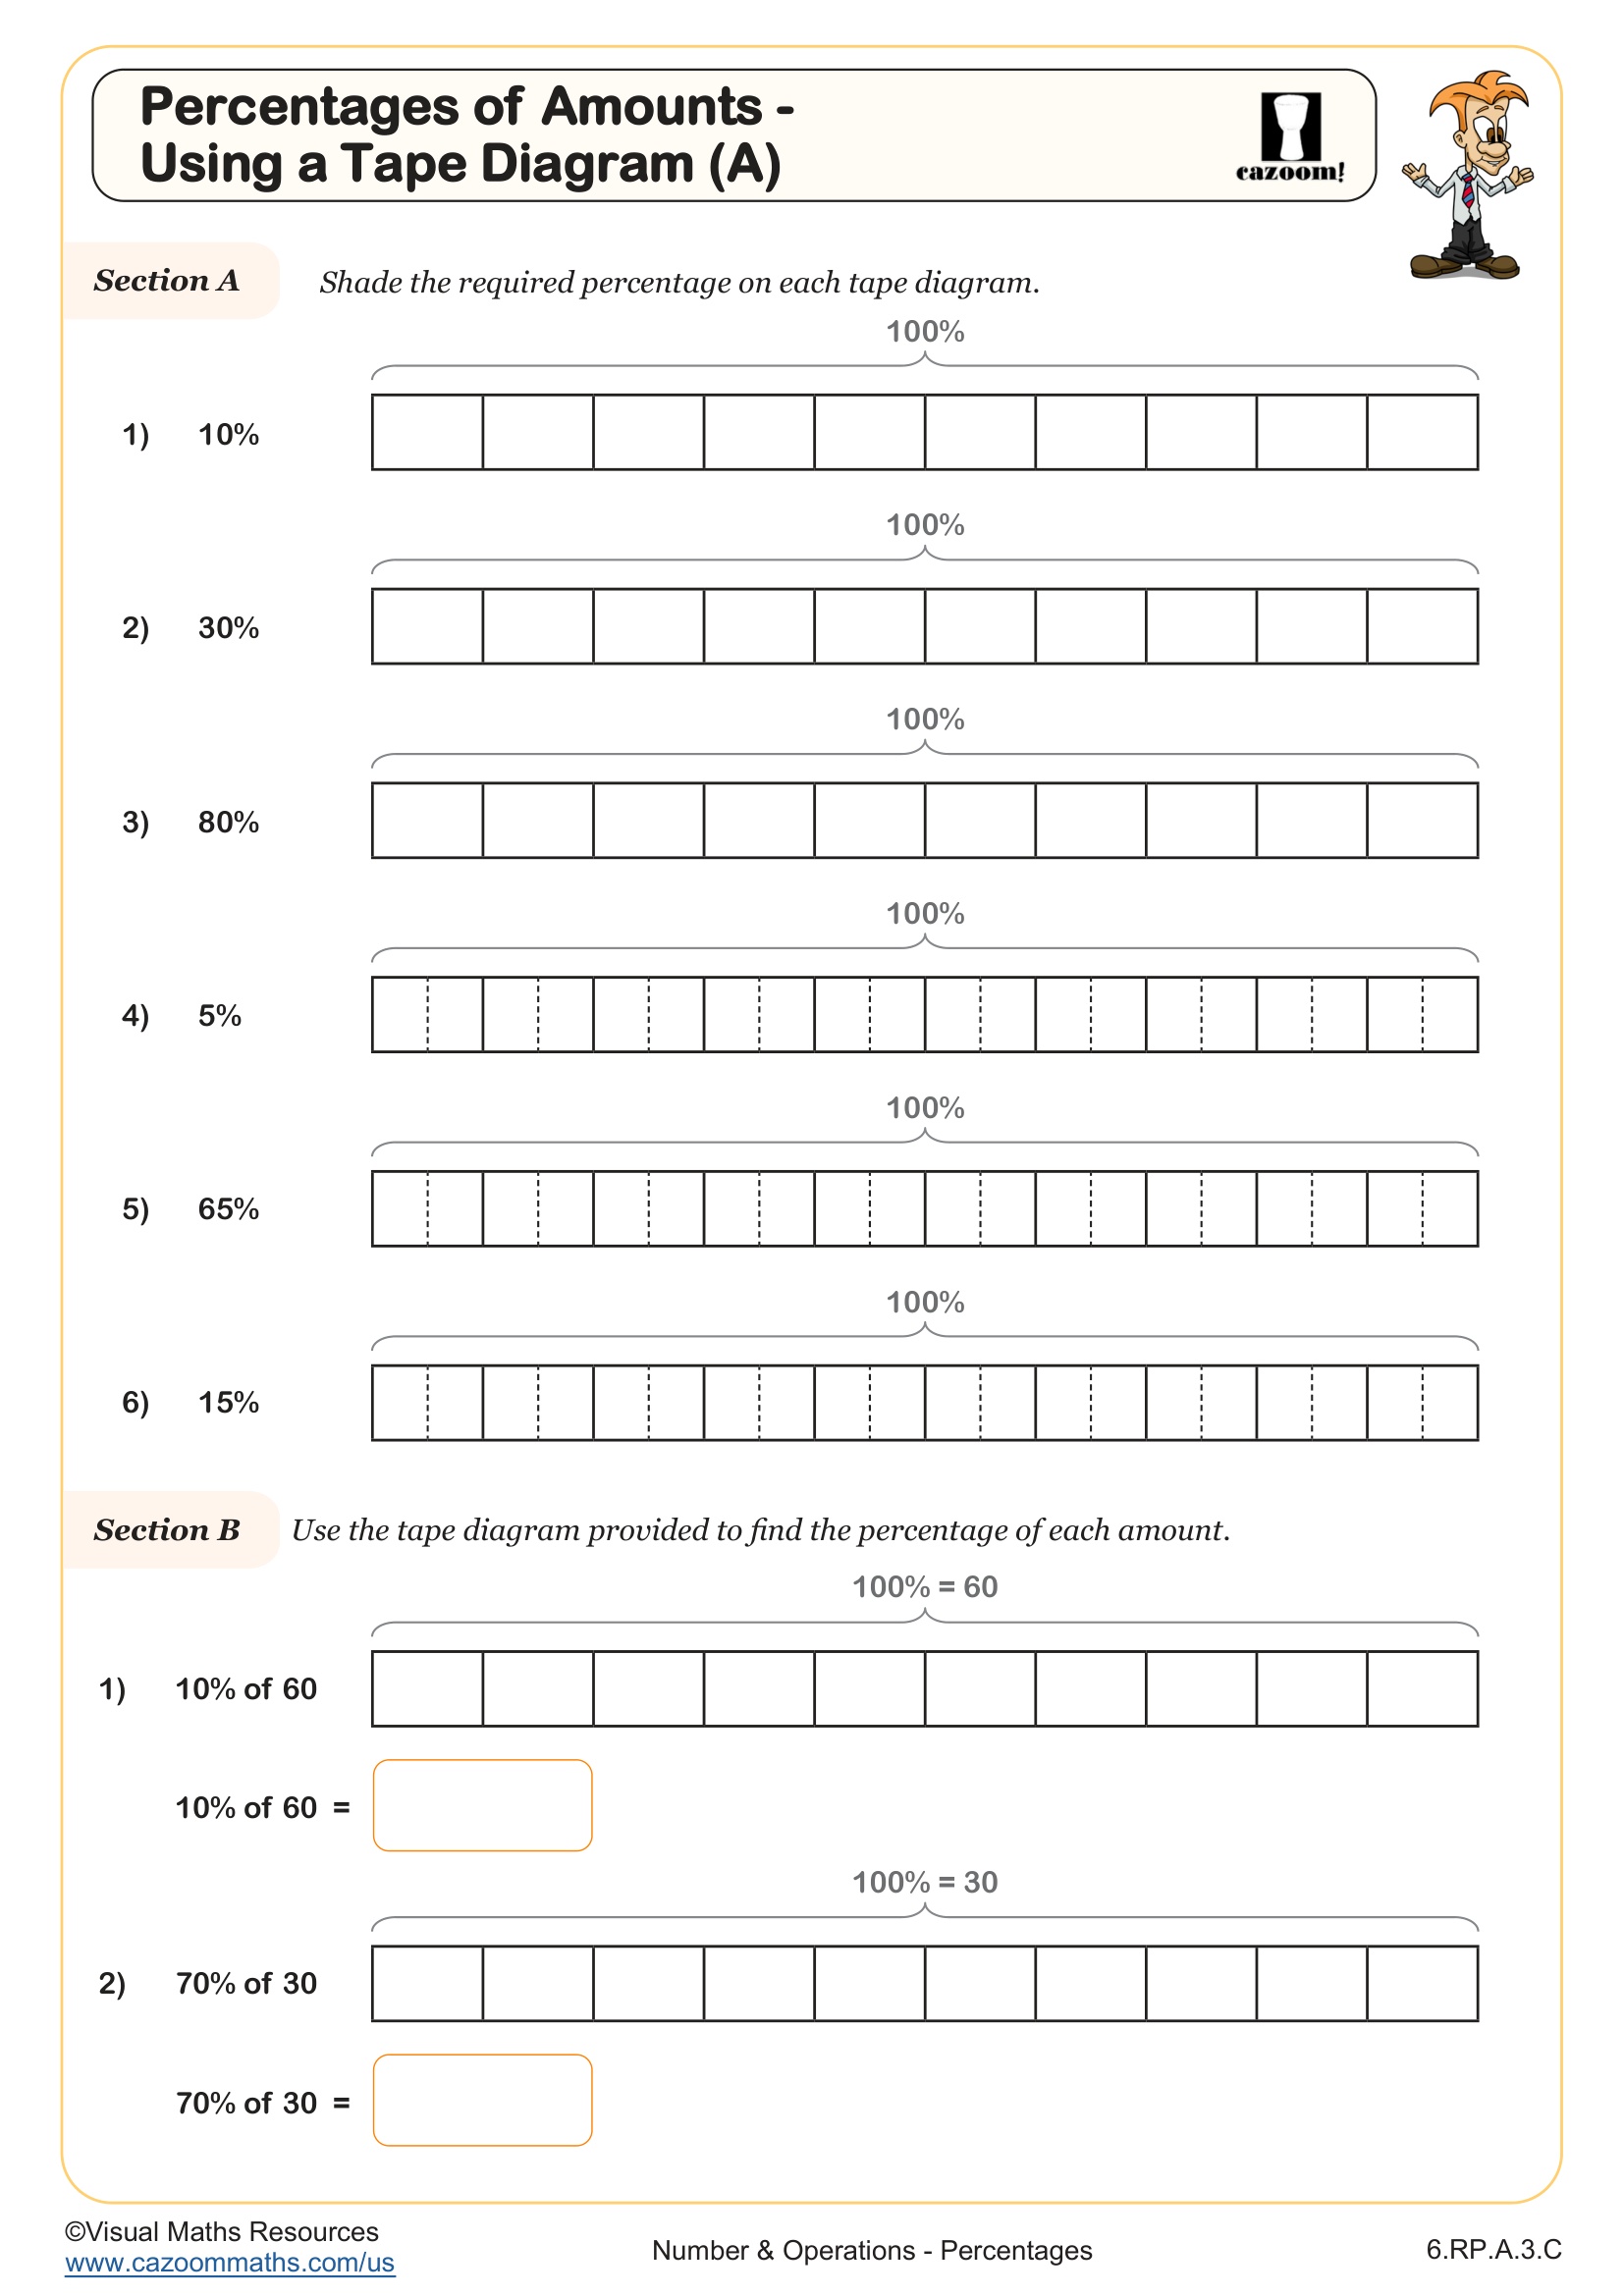
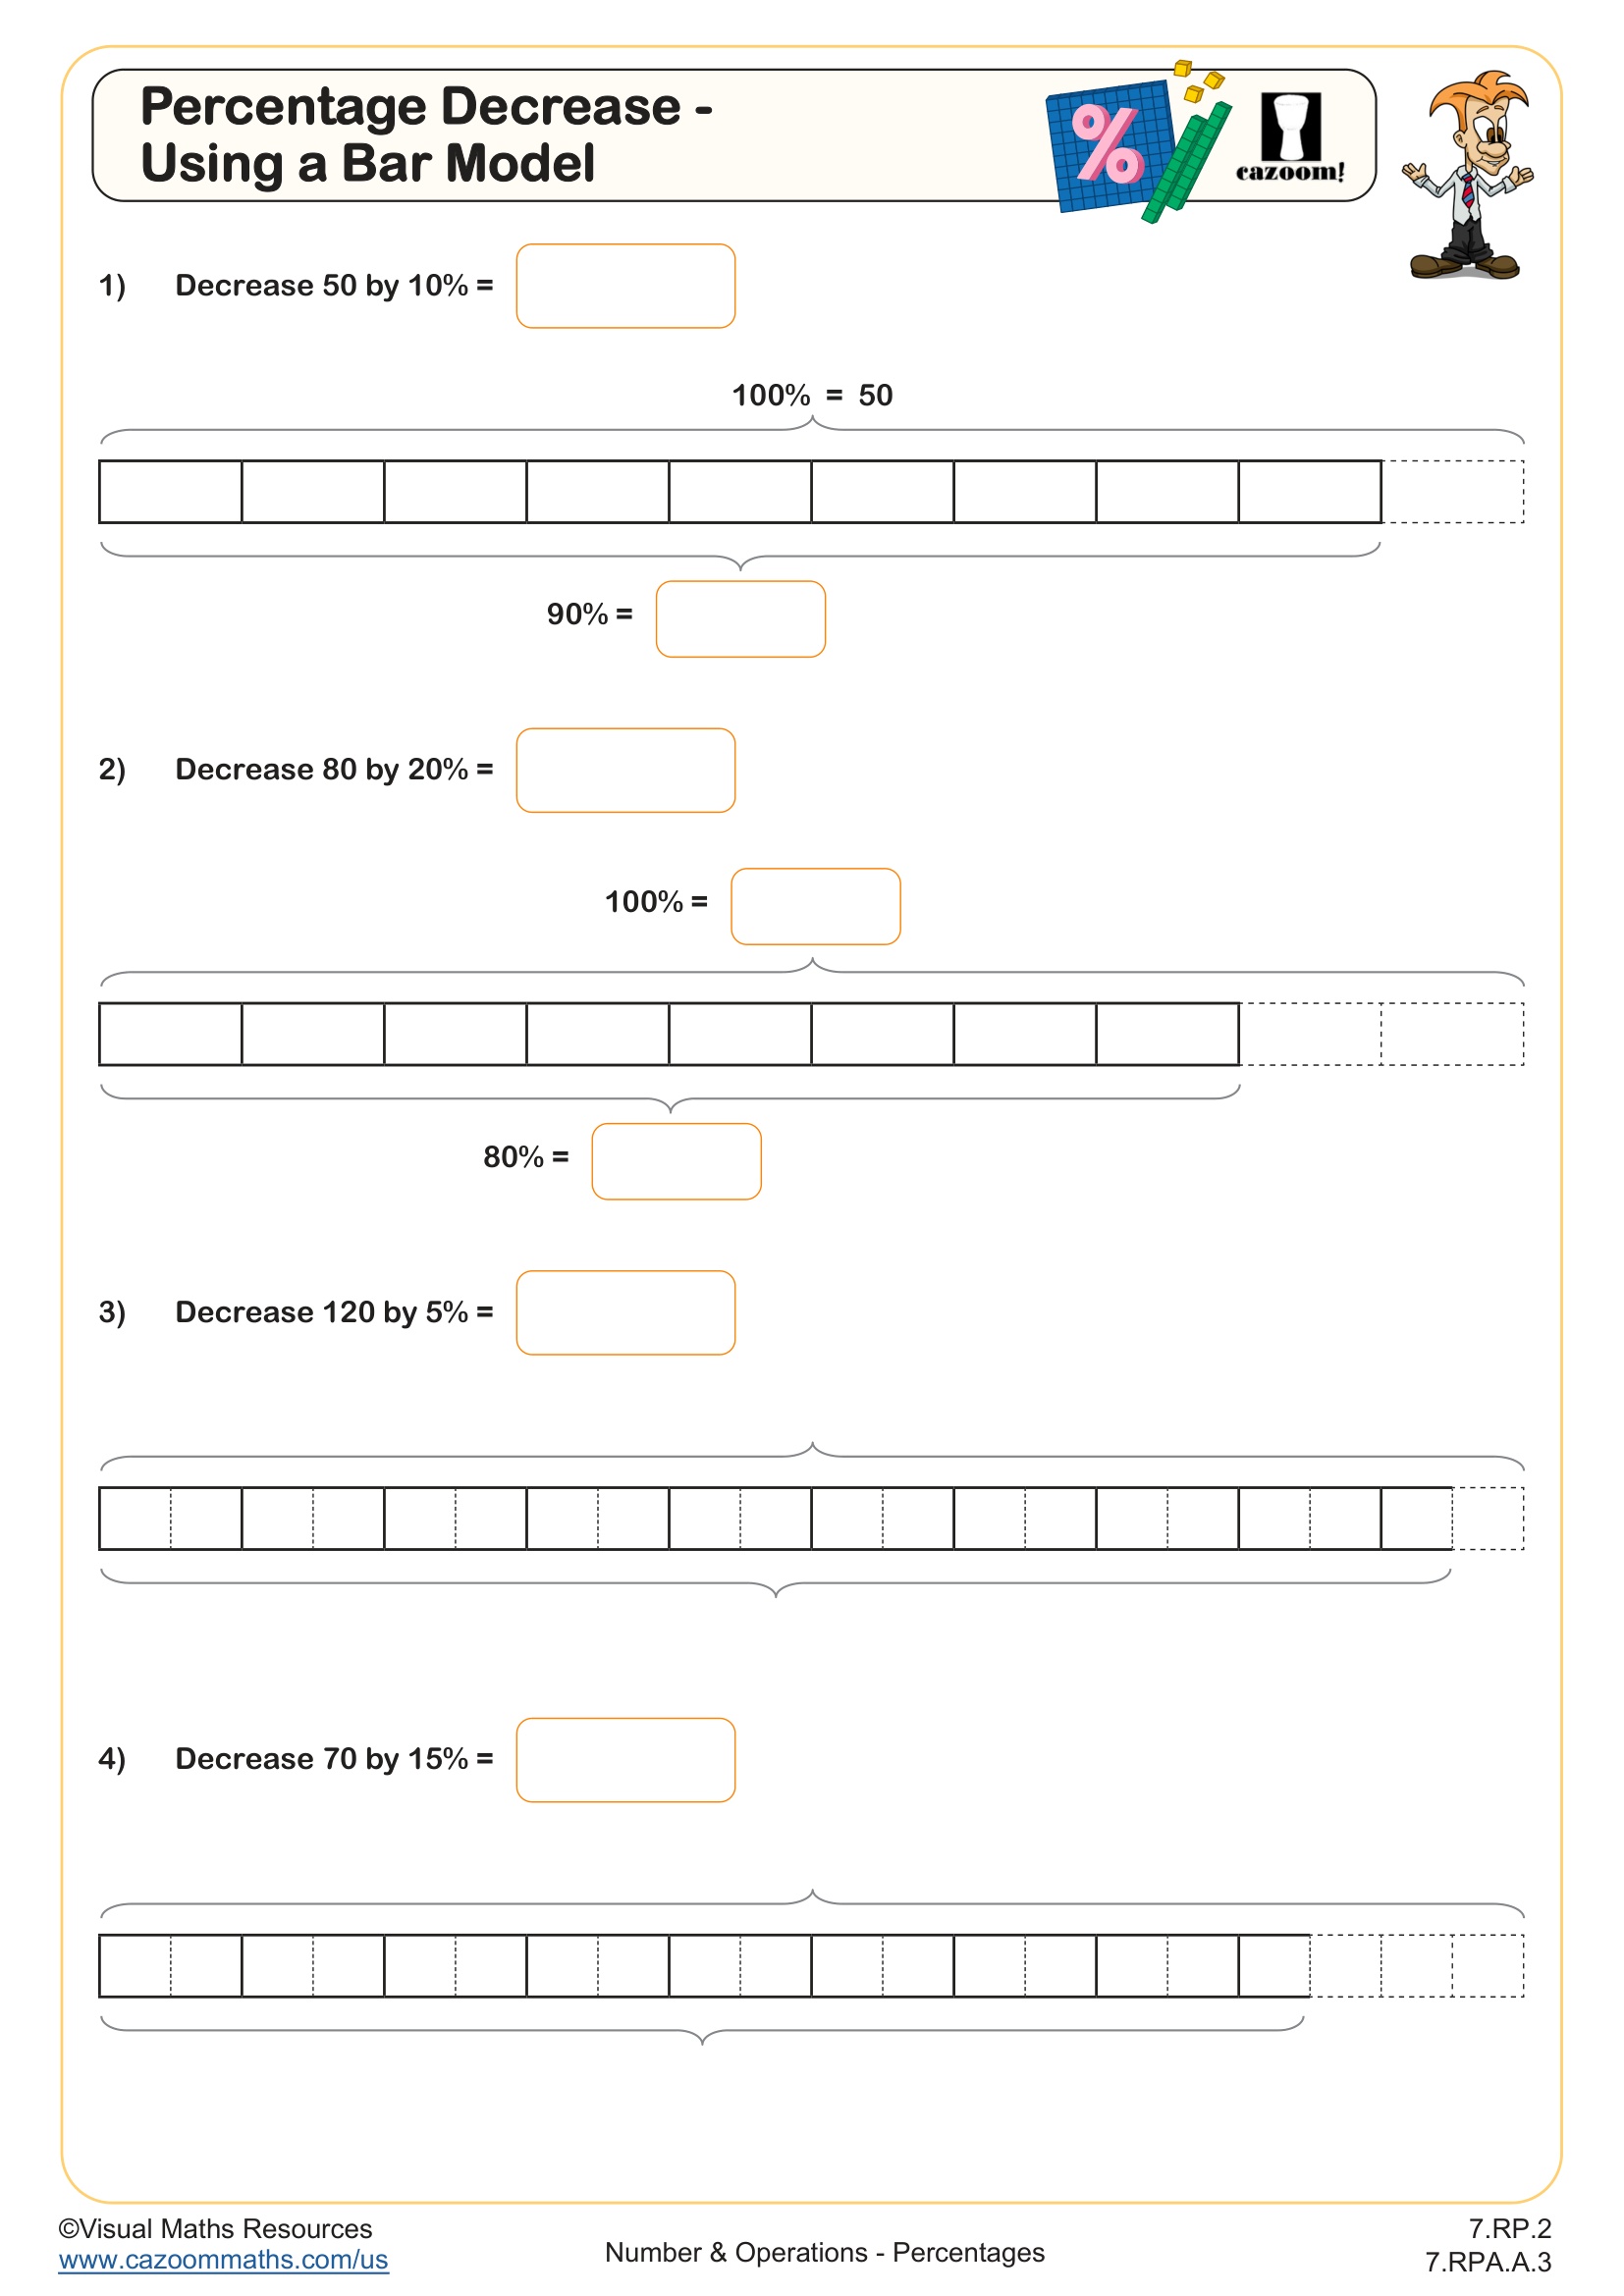
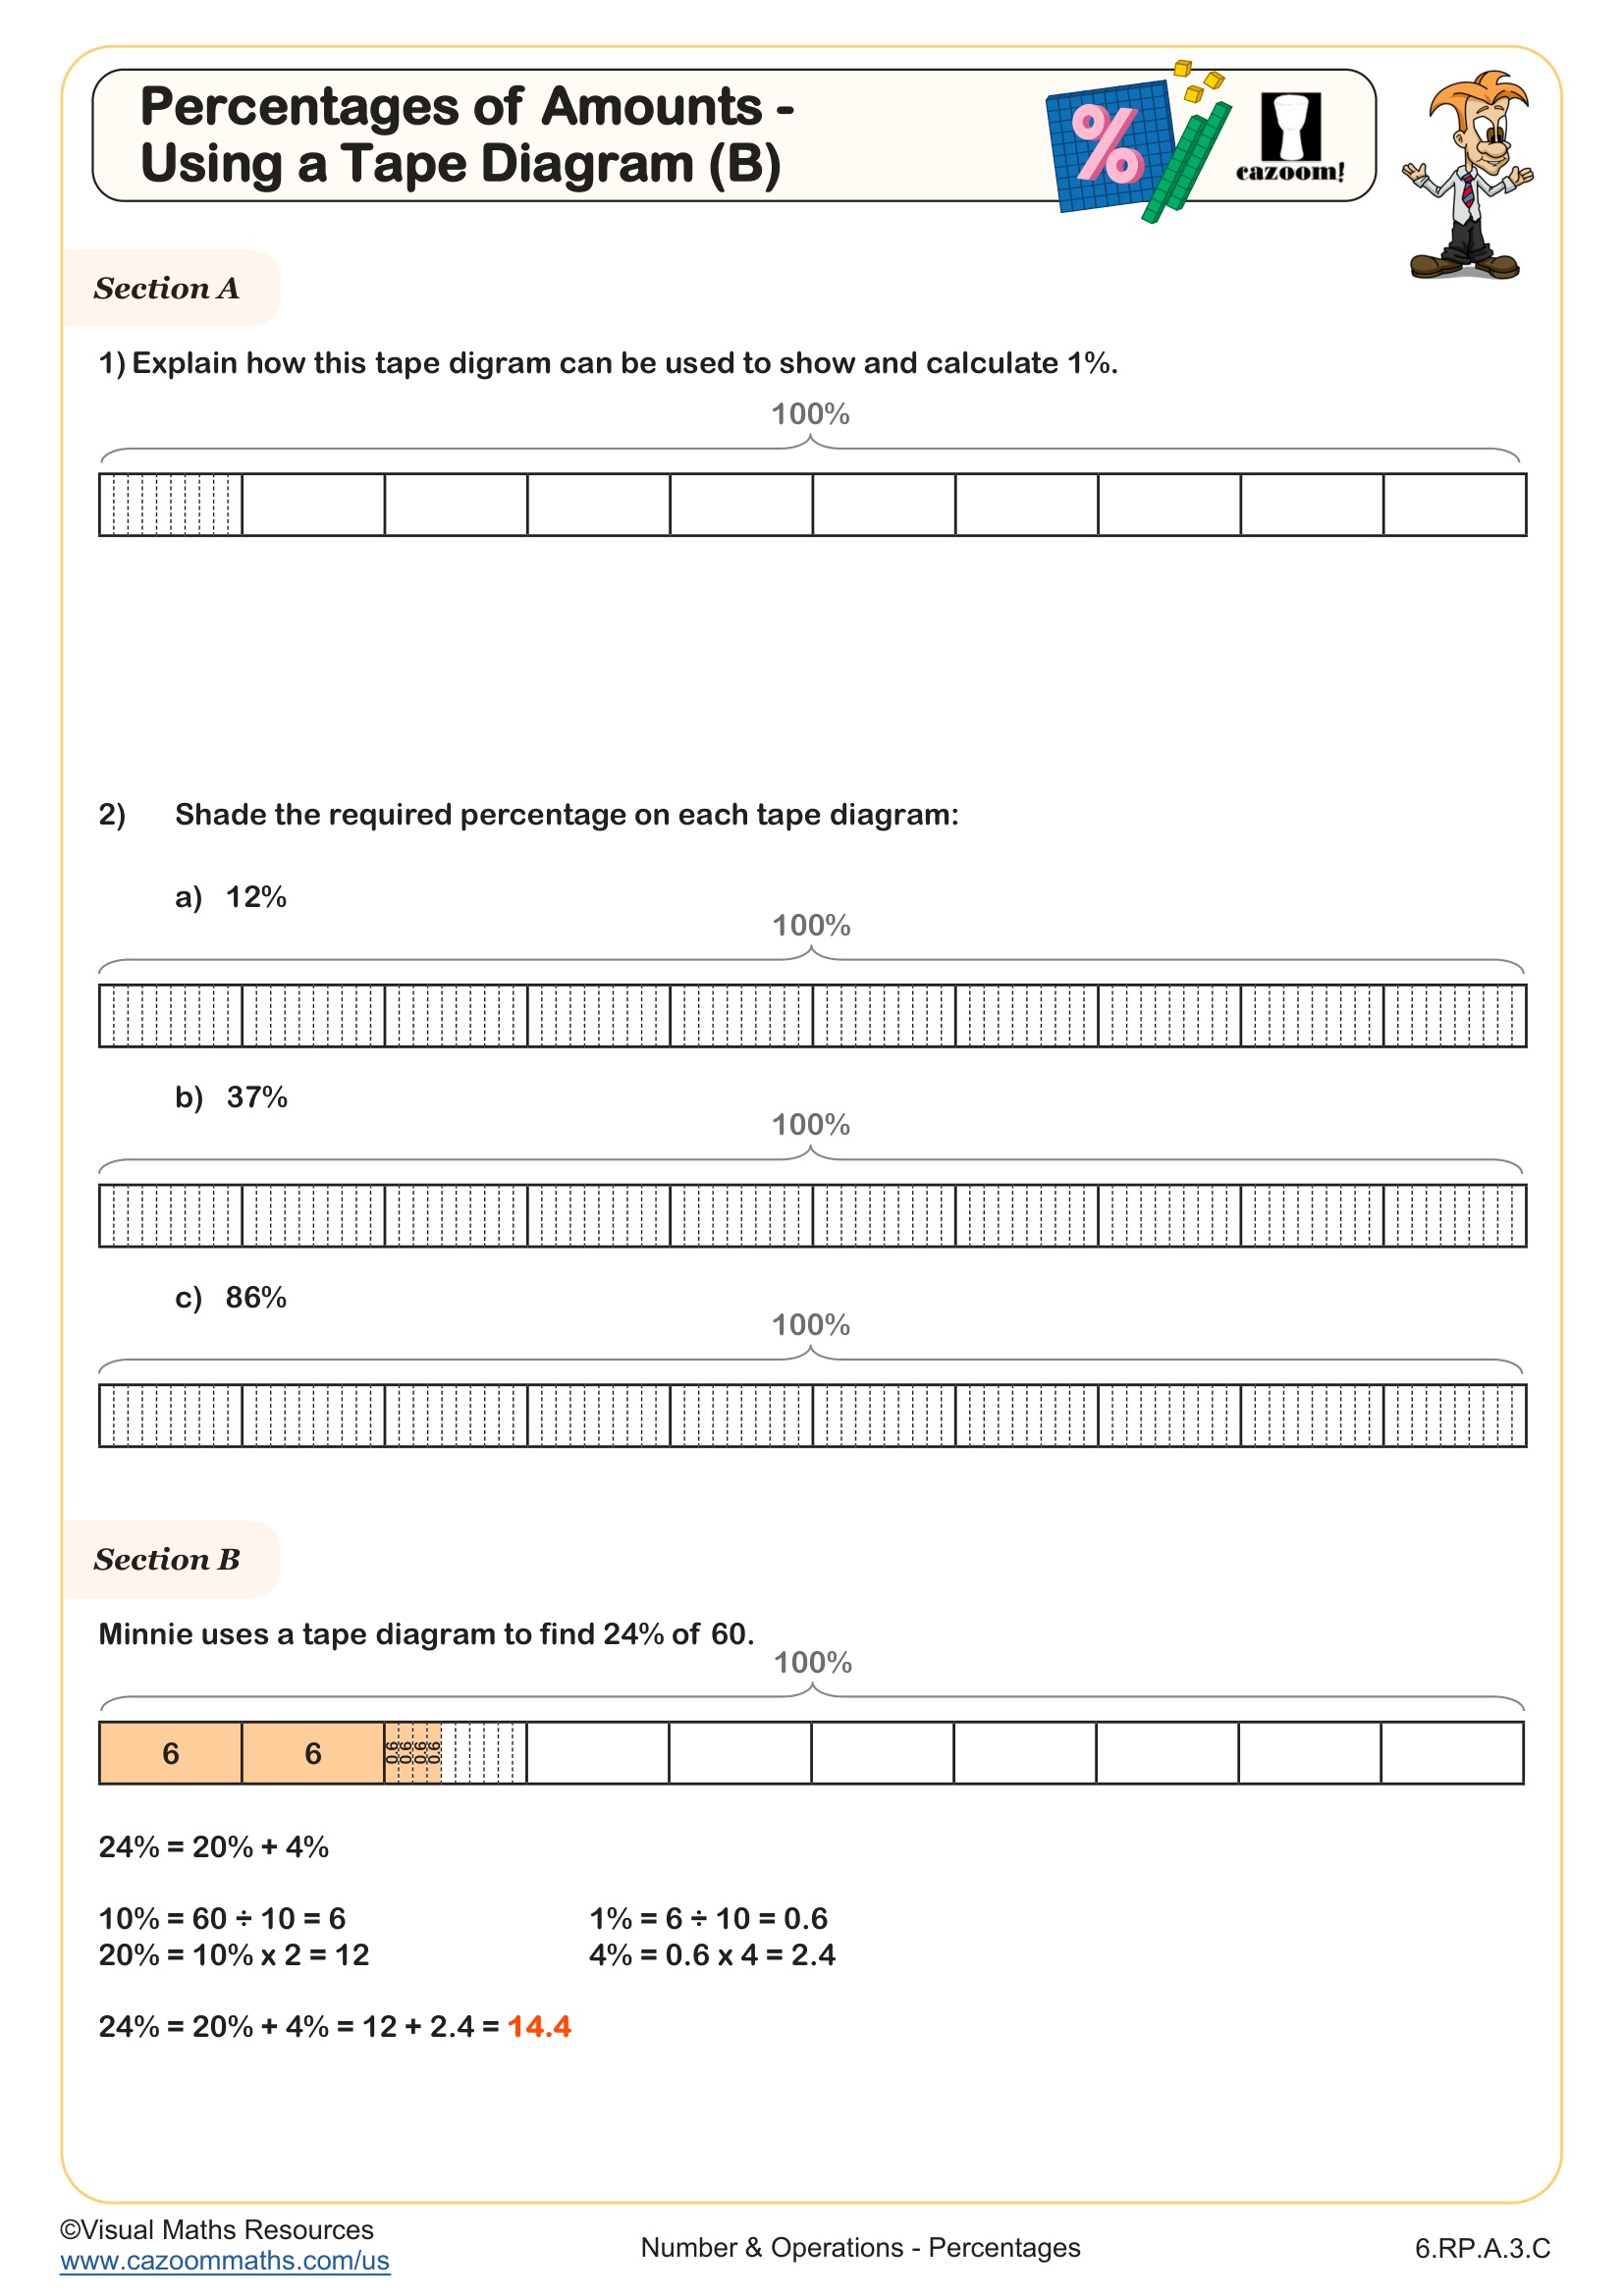
This worksheet provides an excellent introduction to finding the original amount when given a percentage of it. Bar models provide a visual tool for understanding percentages and help bridge the gap between concrete, pictorial, and abstract concepts.
Pupils are firstly given a bar model depicting 20% = 64 and are asked to consider what other percentages they can find using this fact. We have included prompts of multiples of 20% up to 100, 10%, 5% and 1%.
Section B consists of 9 increasingly difficult questions with a decreasing level of scaffolding provided.
All the percentages of the original given are less than 100%. See Reverse Percentages - Using a Bar Model (B) to work with percentages over 100%.
All worksheets are created by the team of experienced teachers at Cazoom Math.

RELATED TO Reverse Percentages - Using a Bar Model (A) WORKSHEET
Frequently Asked Questions
Bar models serve as a powerful visual bridge that helps 7th grade students move from concrete understanding to abstract mathematical thinking when working with reverse percentages. They allow students to see the relationship between different percentage values and the whole amount, making it easier to understand how to find the original value when only given a part. This visual representation is especially helpful when students need to work backwards from a known percentage to determine what 100% represents.