Reverse Percentages - Using a Bar Model (B) WORKSHEET
Use proportional relationships to solve multistep ratio and percent problems, including simple interest, tax, markups and markdowns, gratuities and commissions, fees, percent increase and decrease, and percent error.
Reverse Percentages - Using a Bar Model (B) WORKSHEET DESCRIPTION
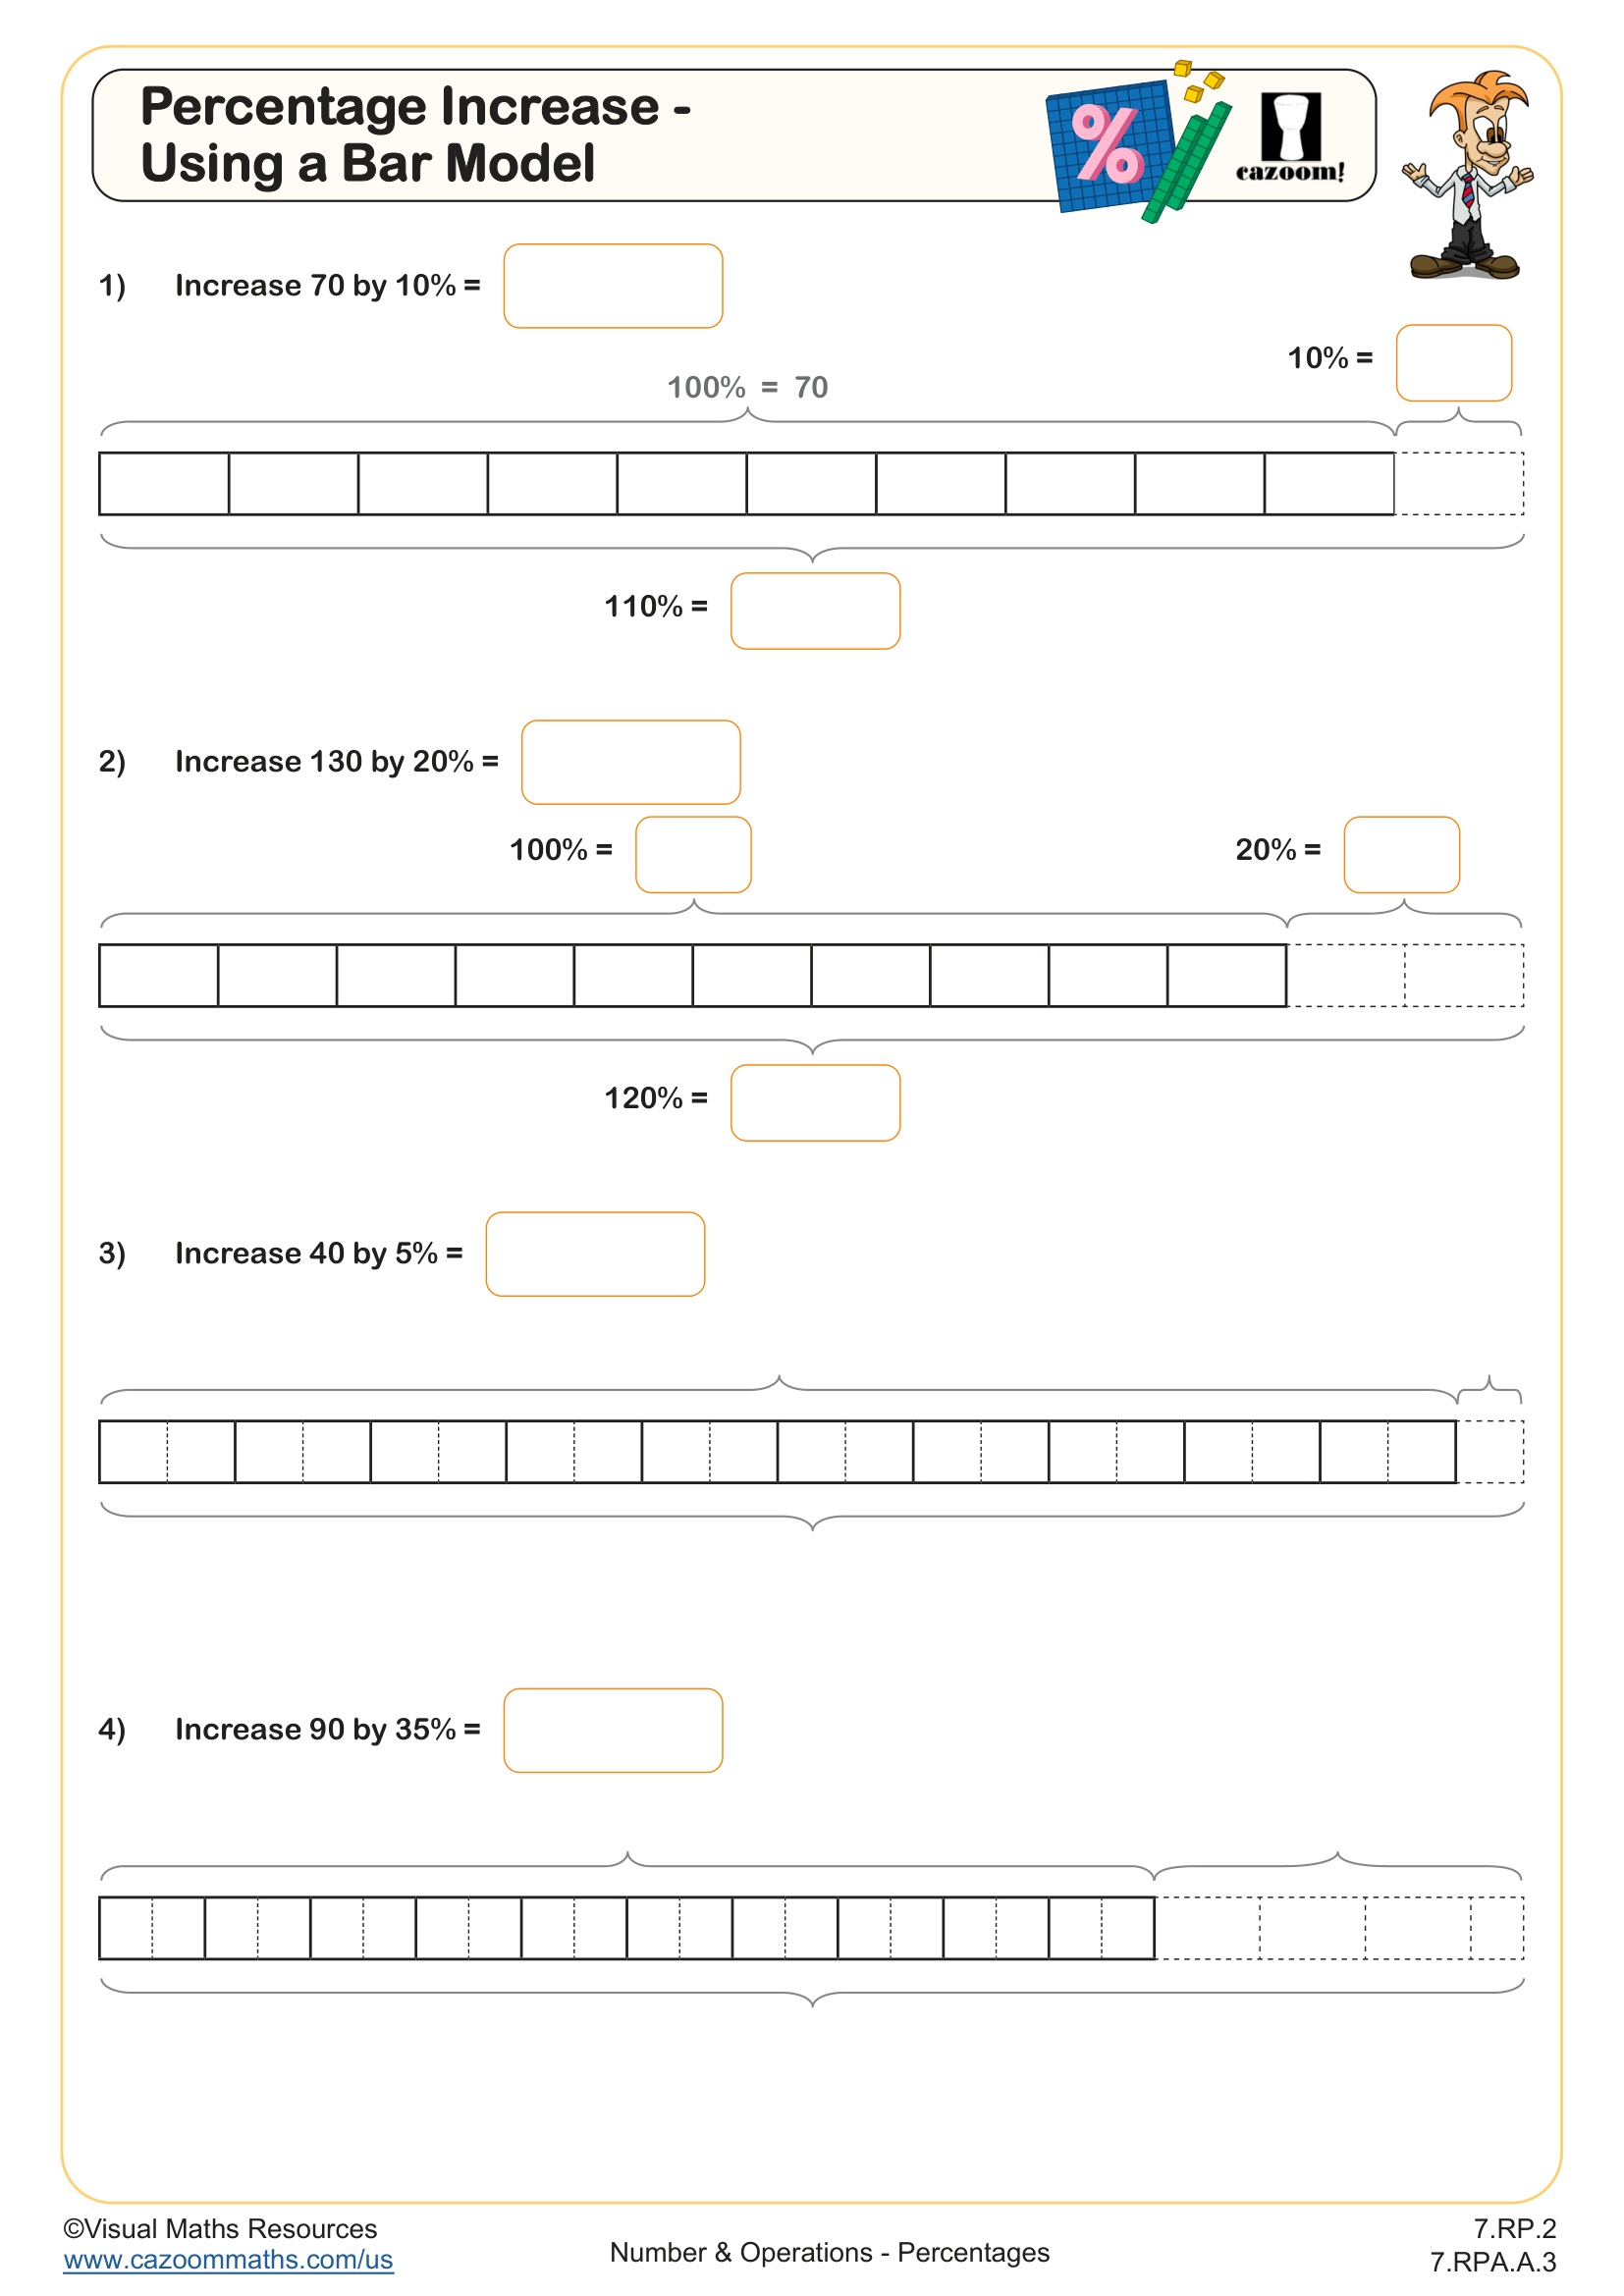
This worksheet provides an excellent introduction to finding the original amount when it has been subjected to a percentage increase. Bar models provide a visual tool for understanding percentages and help bridge the gap between concrete, pictorial, and abstract concepts.
All percentage increases are multiples of 5% and the different sections are structured with a decreasing level of scaffolding.
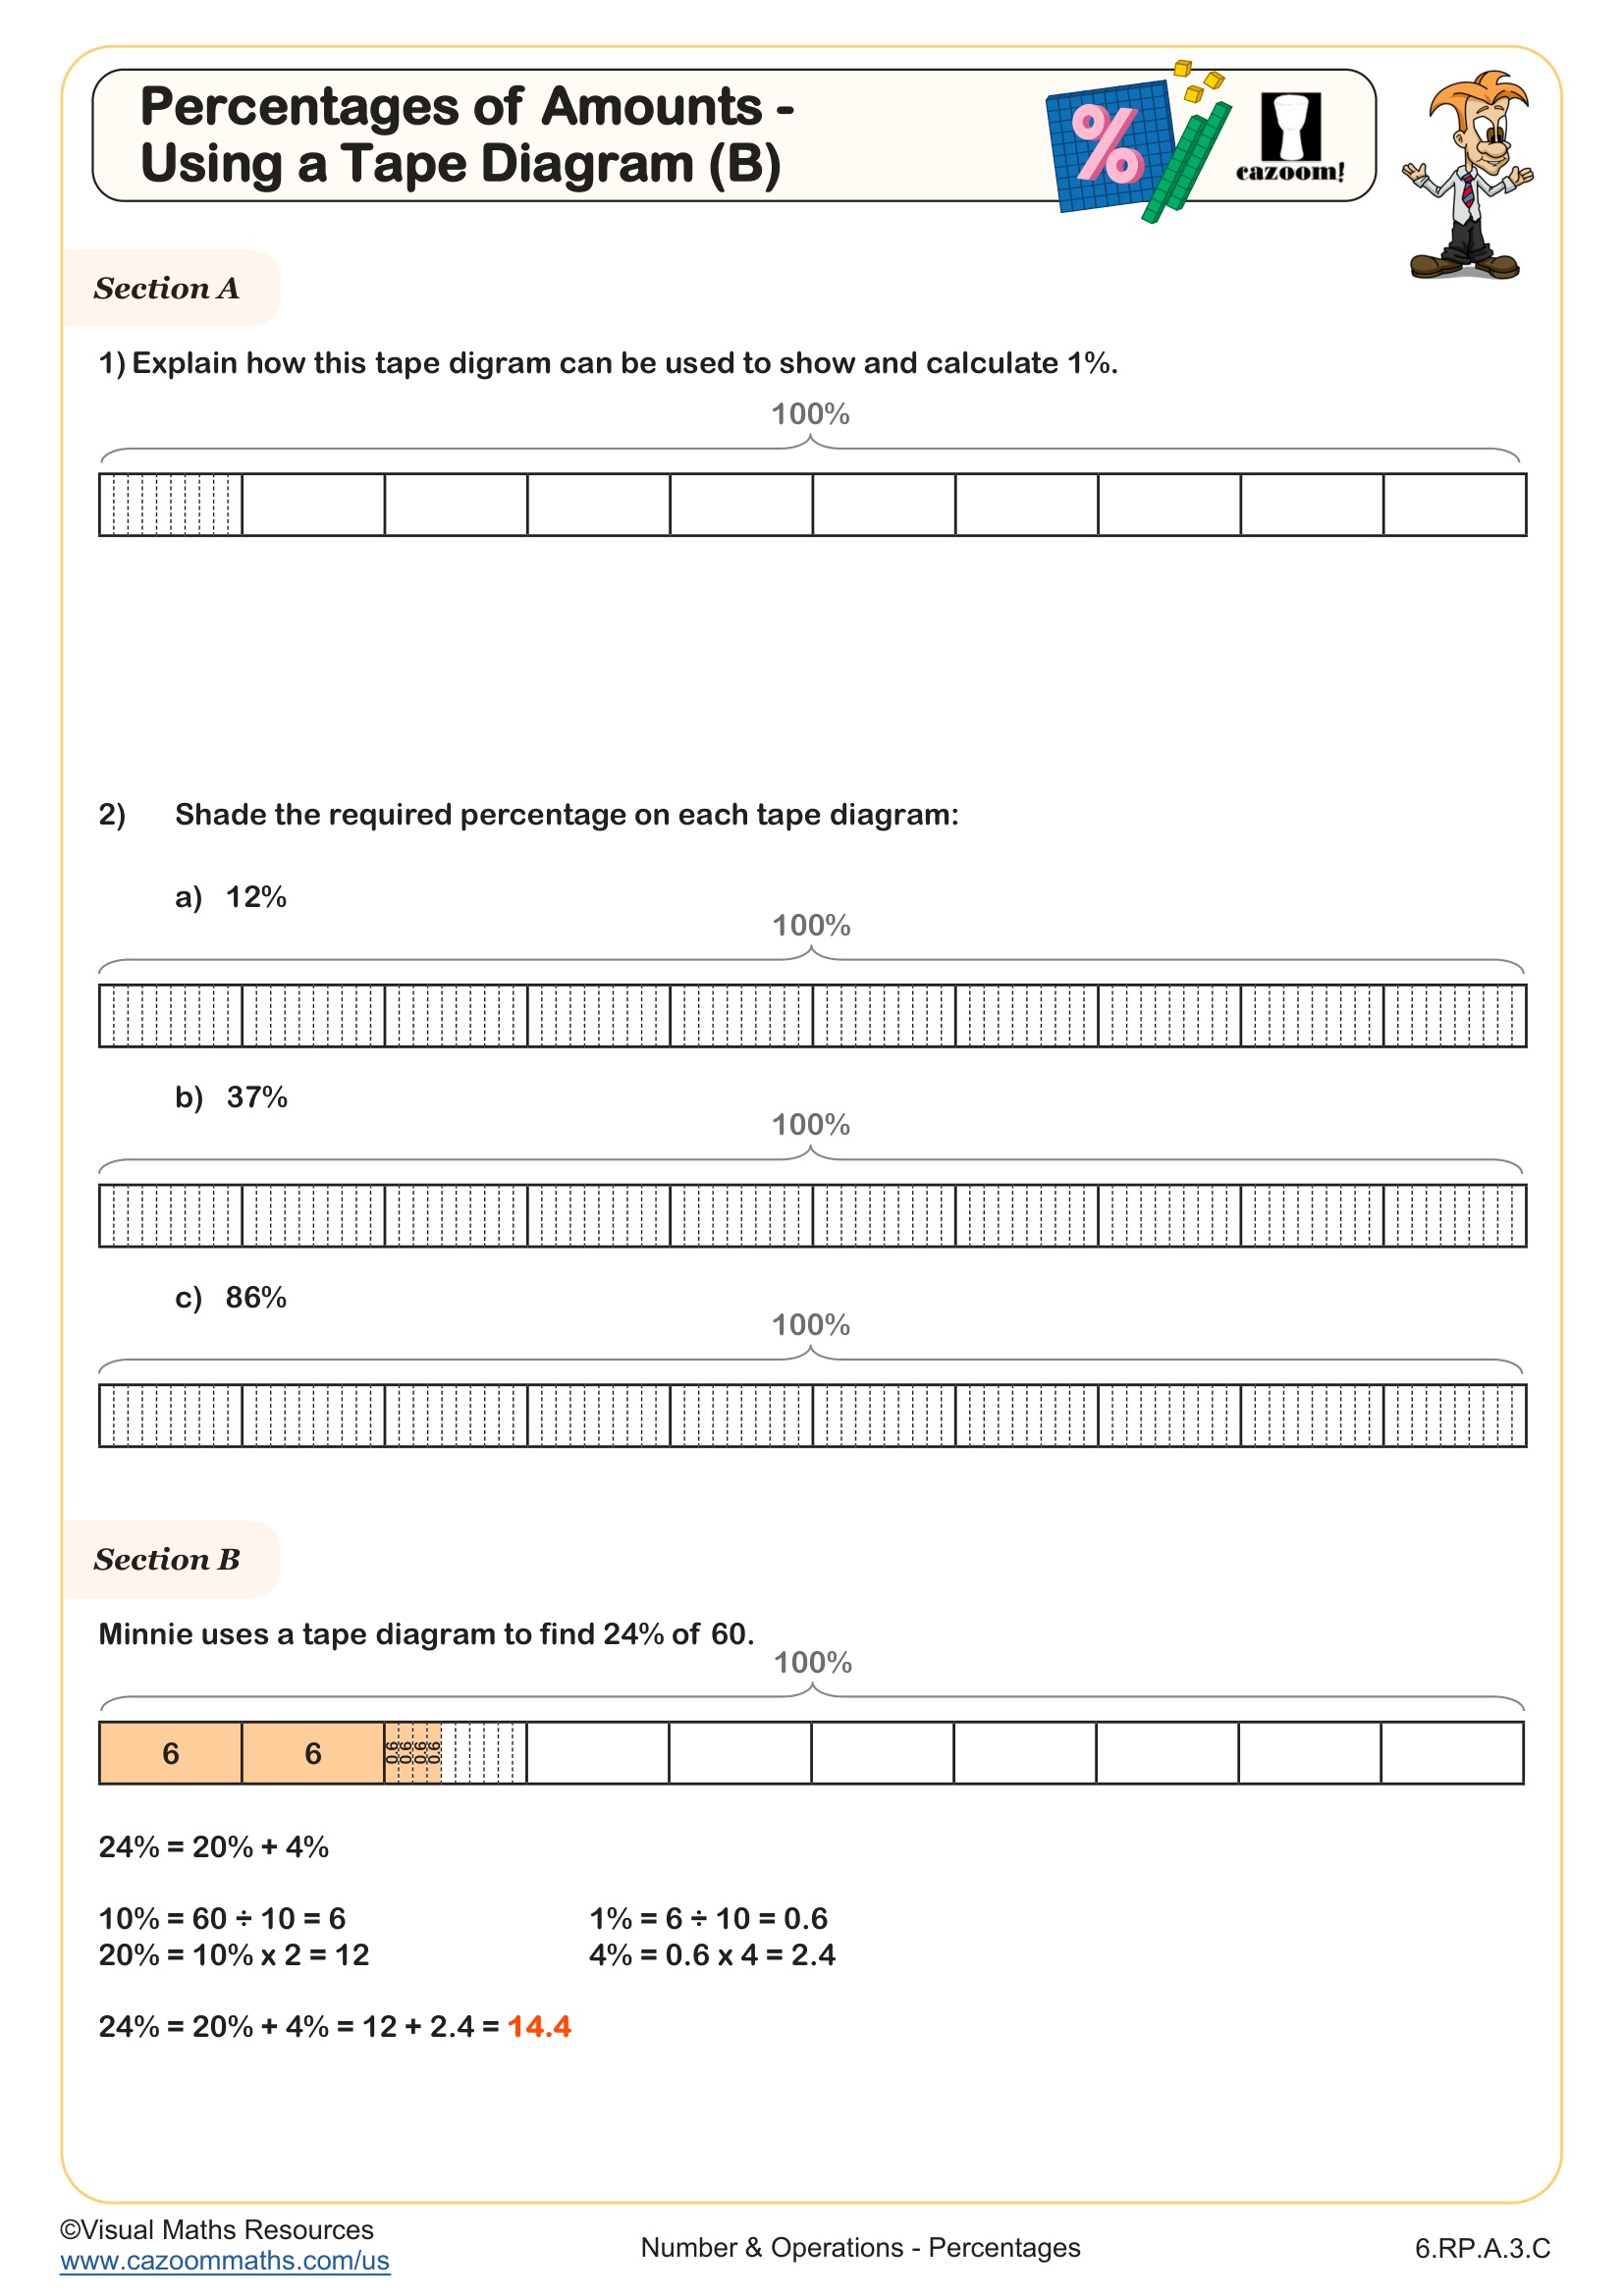
Section B provides an opportunity for students to articulate their understanding as they discuss what is the same and what's different between two different uses of the bar model for finding 100% after a 40% increase.
All worksheets are created by the team of experienced teachers at Cazoom Math.

RELATED TO Reverse Percentages - Using a Bar Model (B) WORKSHEET
Frequently Asked Questions
This worksheet is specifically designed for 7th grade students who are learning about percentages. The visual bar model approach helps students at this level transition from concrete understanding to more abstract mathematical thinking. The structured scaffolding makes it appropriate for students who are ready to tackle the challenging concept of working backwards from percentage increases.