Using Conversion Graphs WORKSHEET
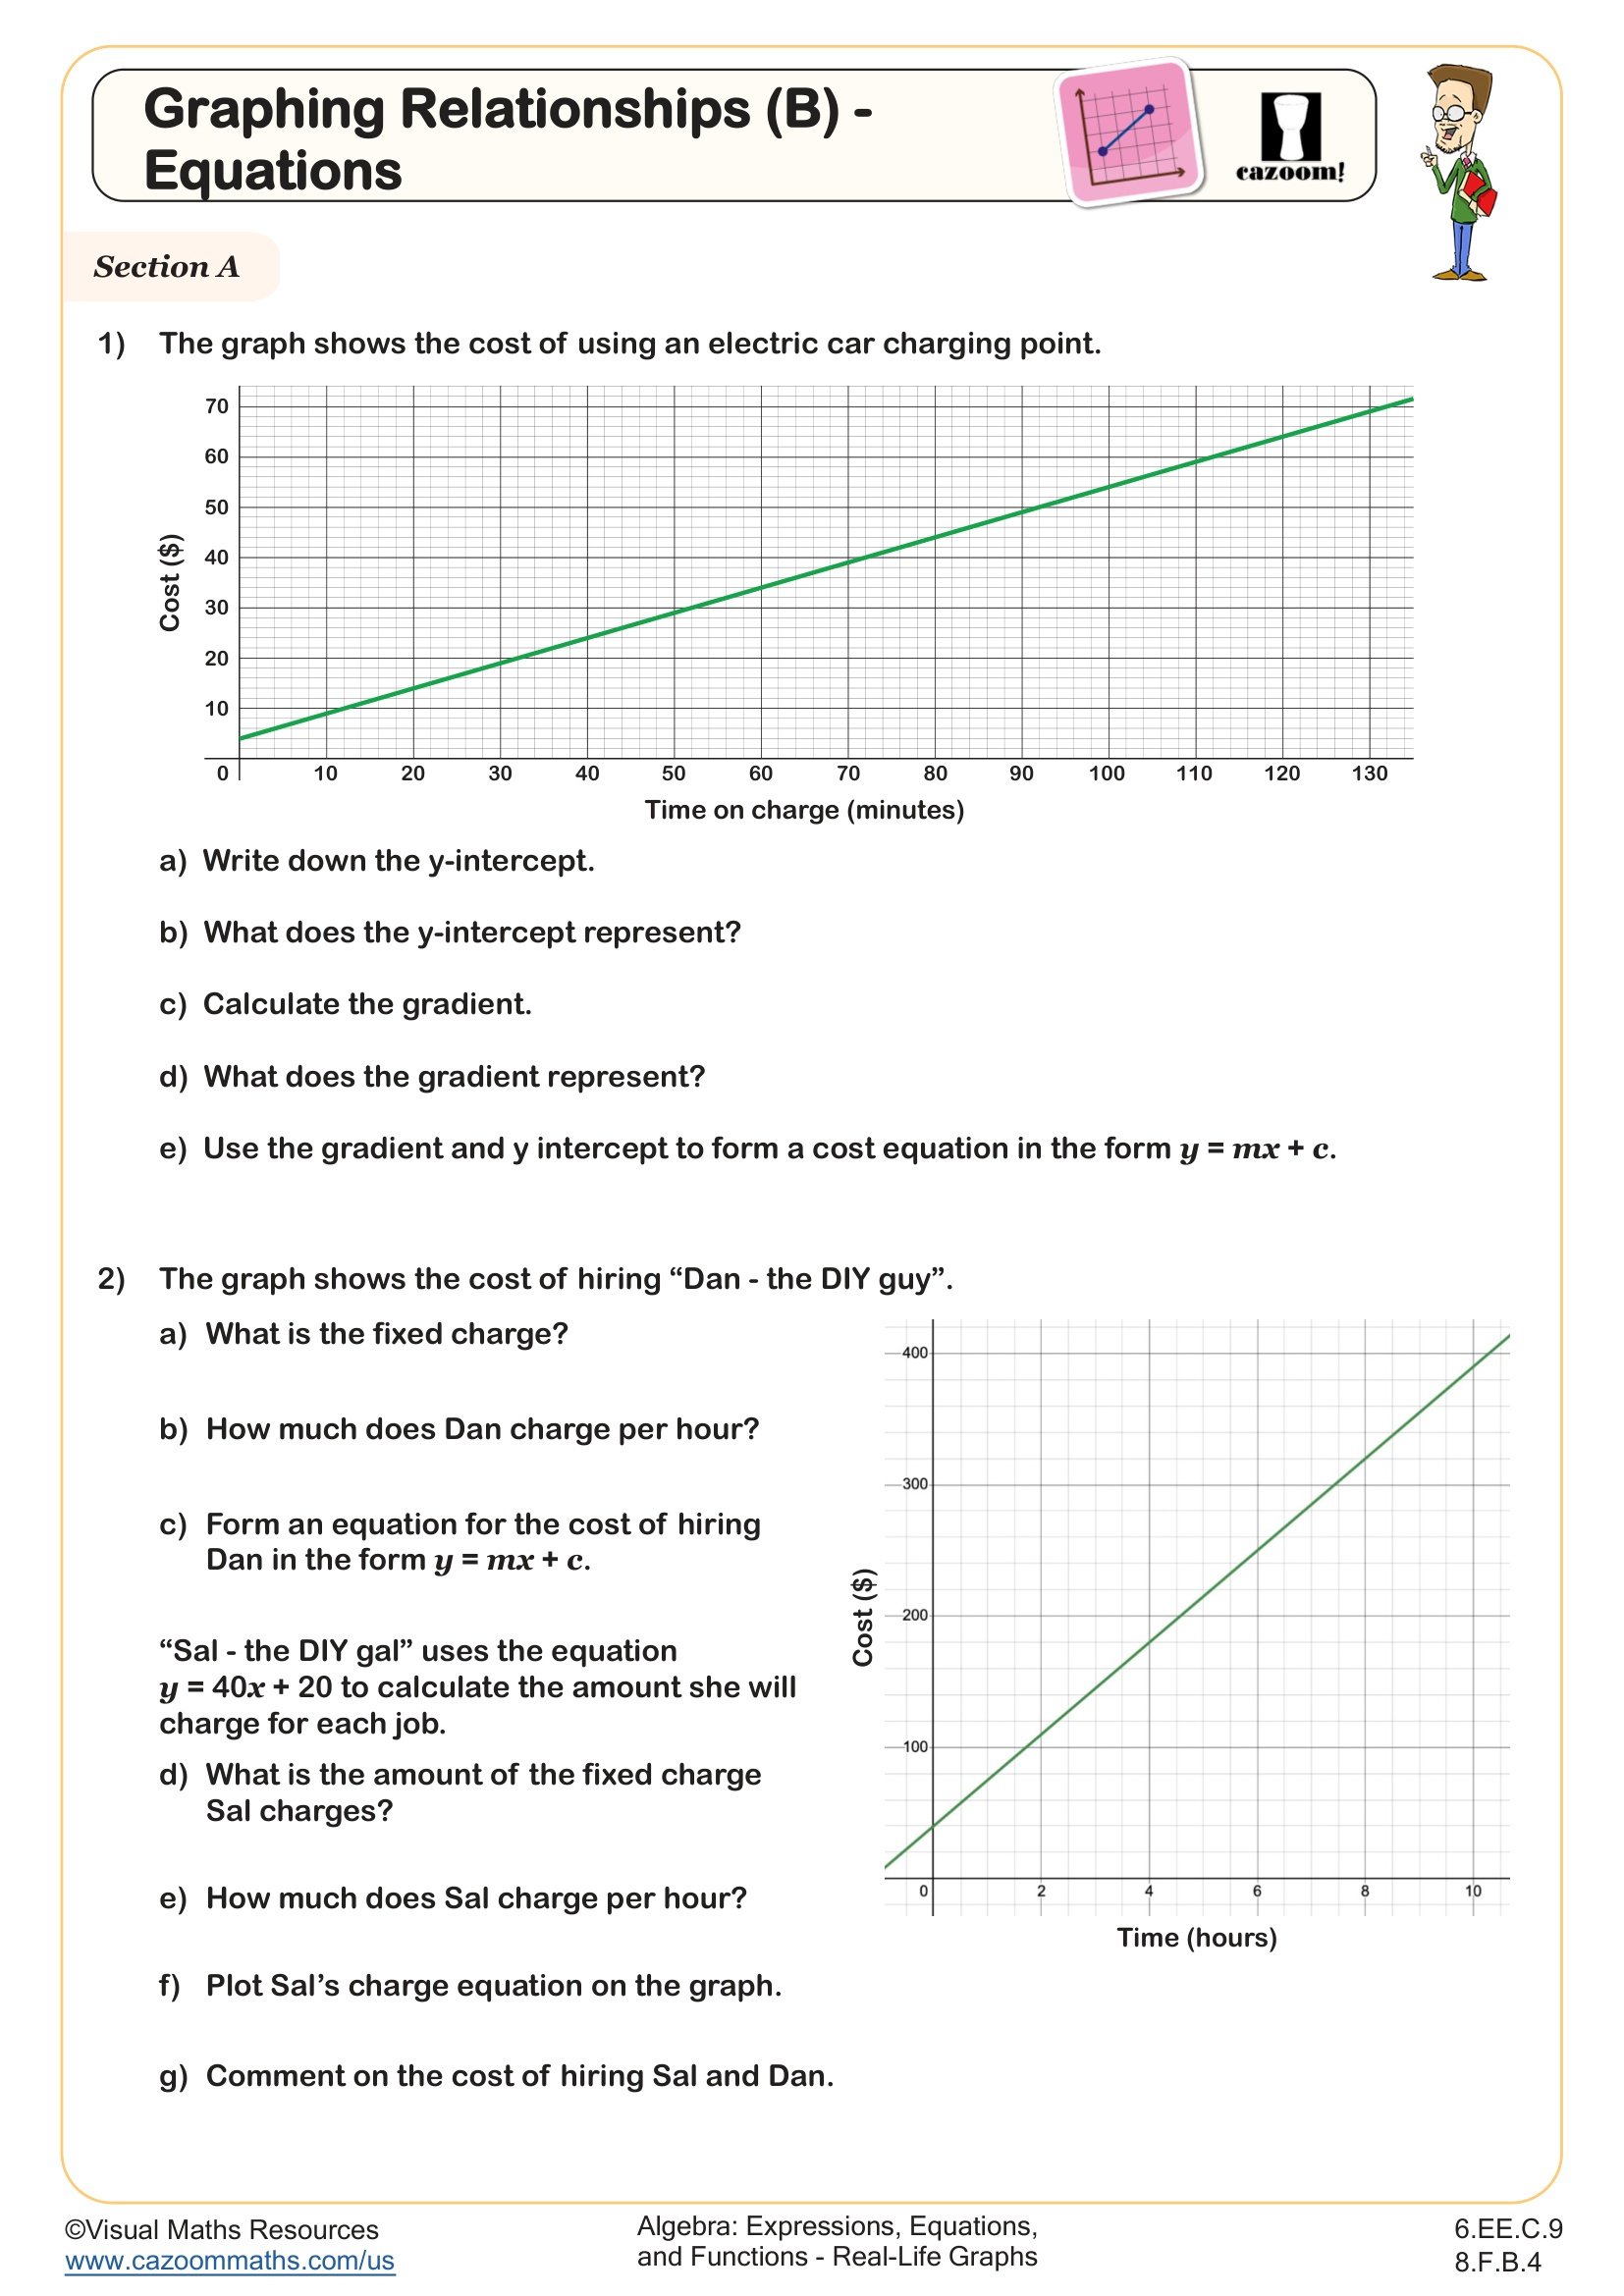
Use the equation of a linear model to solve problems in the context of bivariate measurement data, interpreting the slope and intercept. For example, in a linear model for a biology experiment, interpret a slope of 1.5 cm/hr as meaning that an additional hour of sunlight each day is associated with an additional 1.5 cm in mature plant height.
Using Conversion Graphs WORKSHEET DESCRIPTION
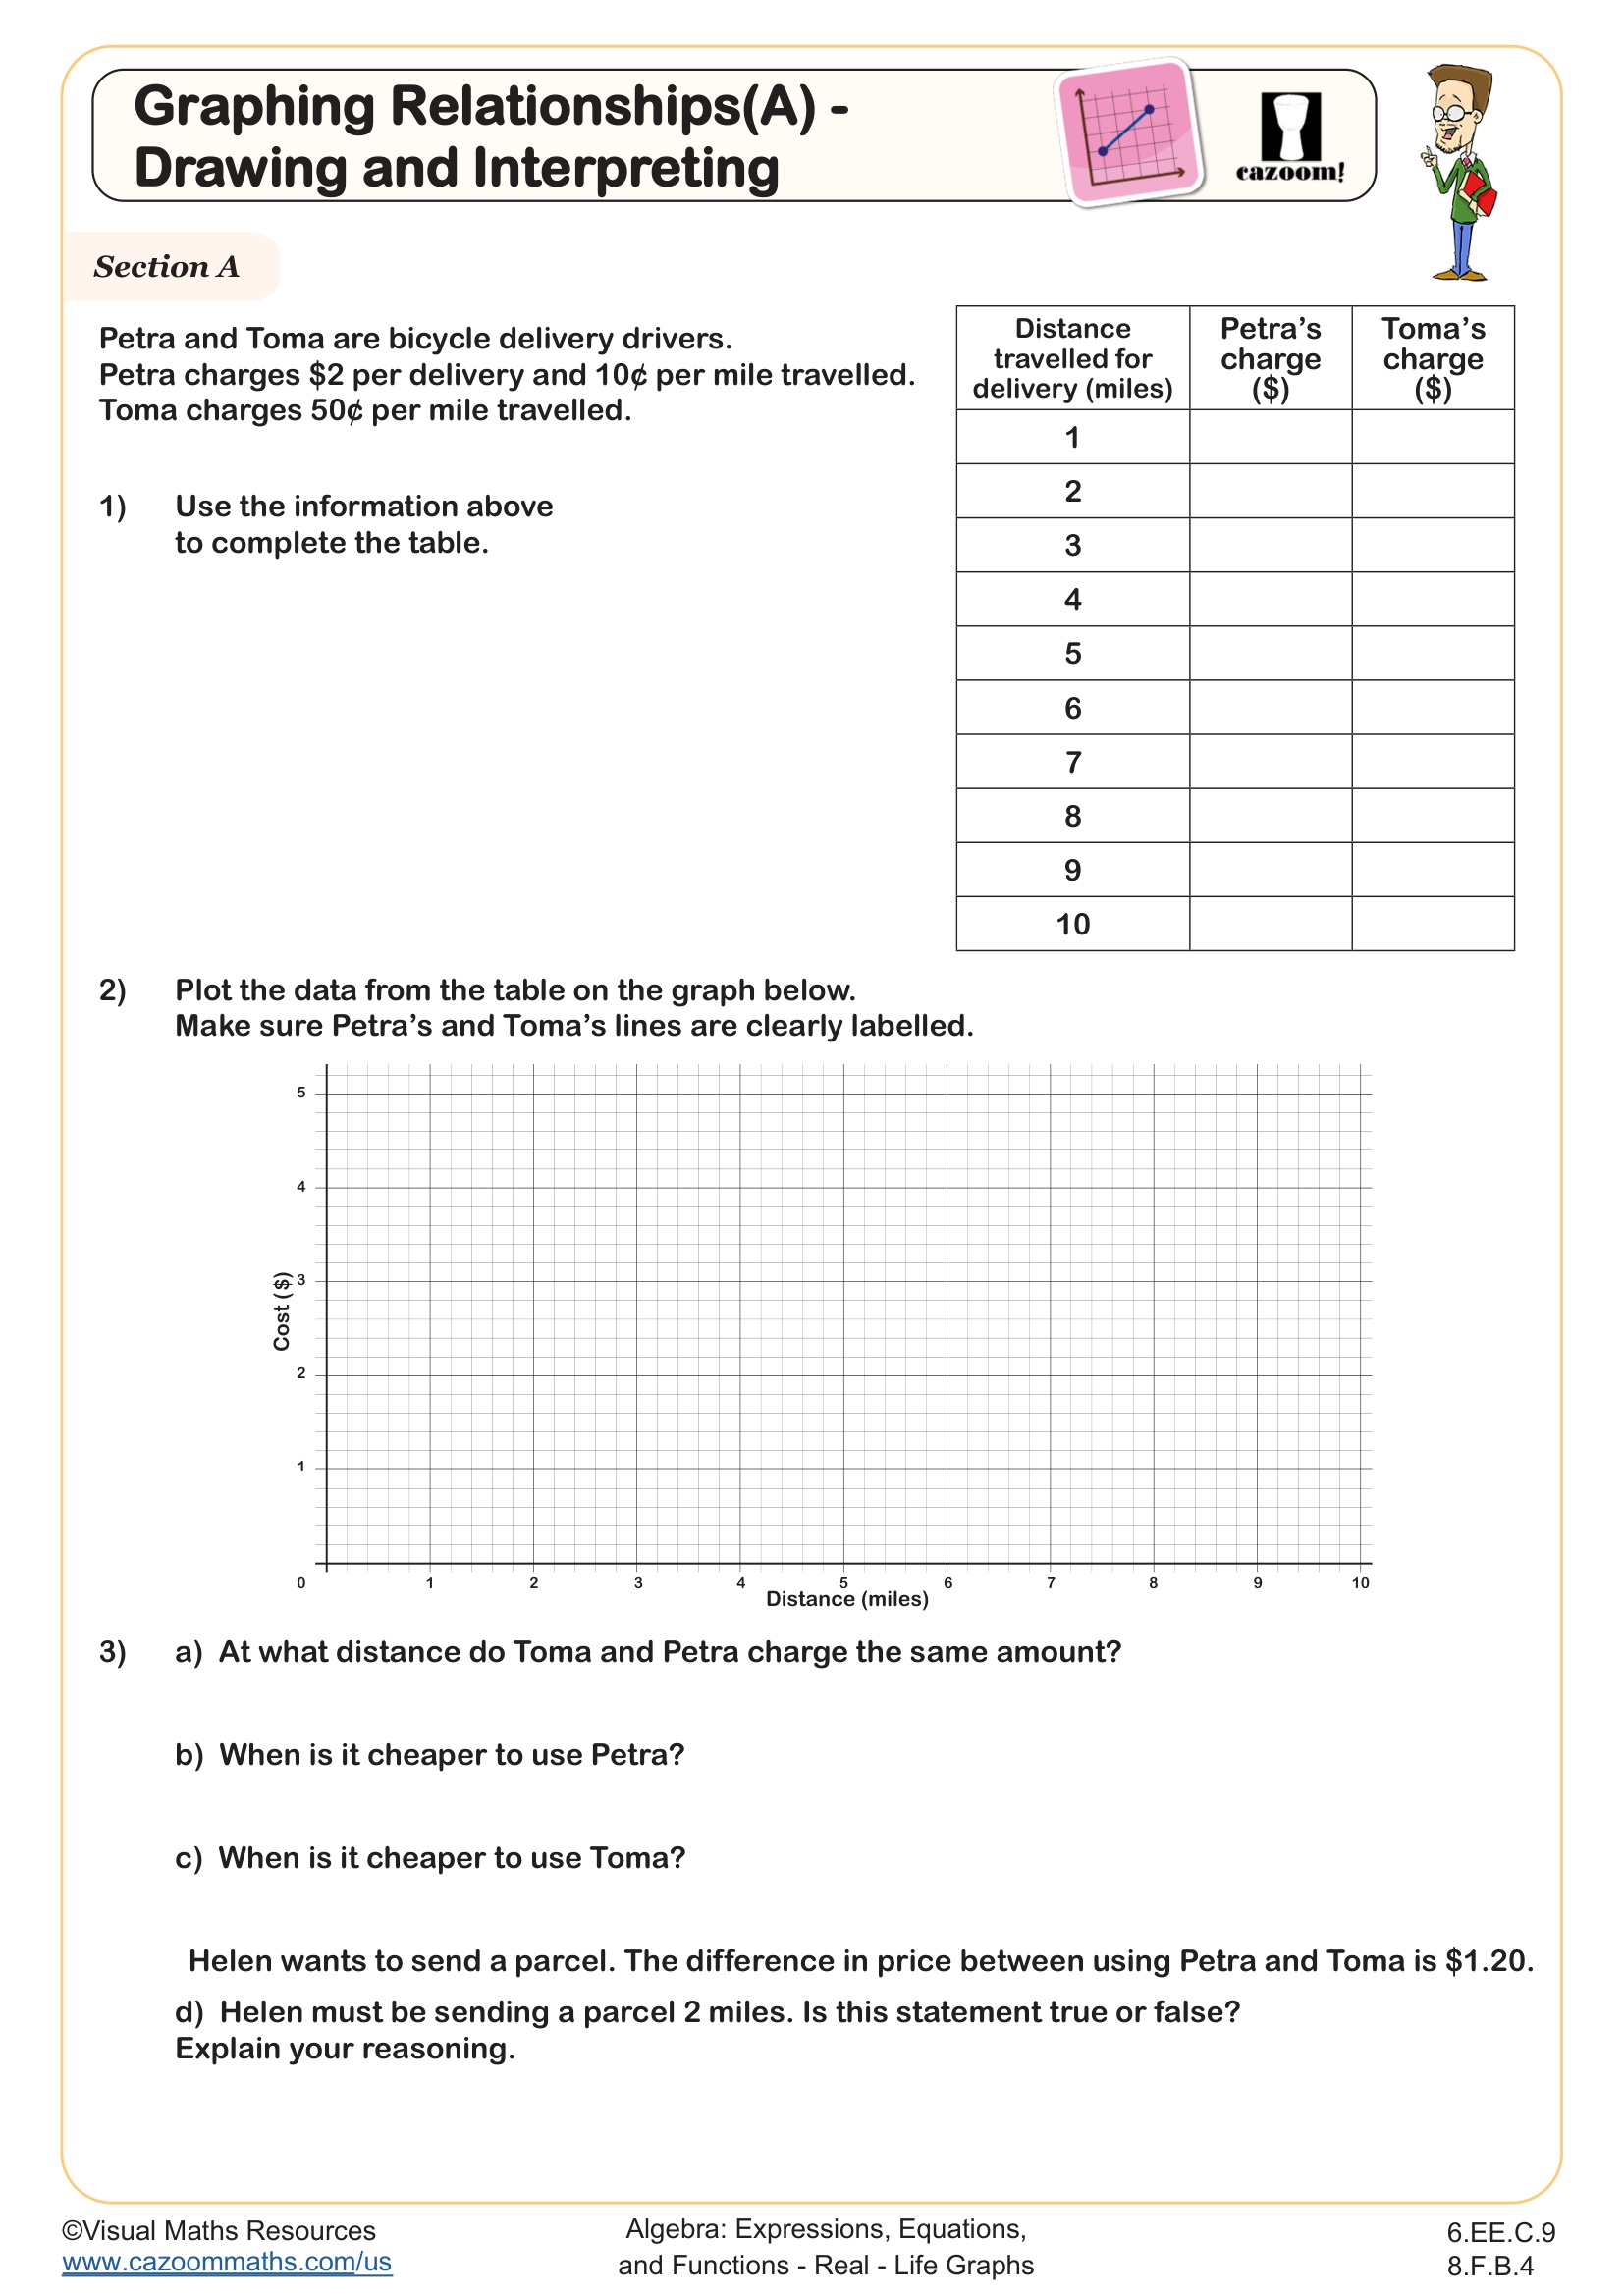
Students will read and interpret information from four different conversion graphs using this worksheet.
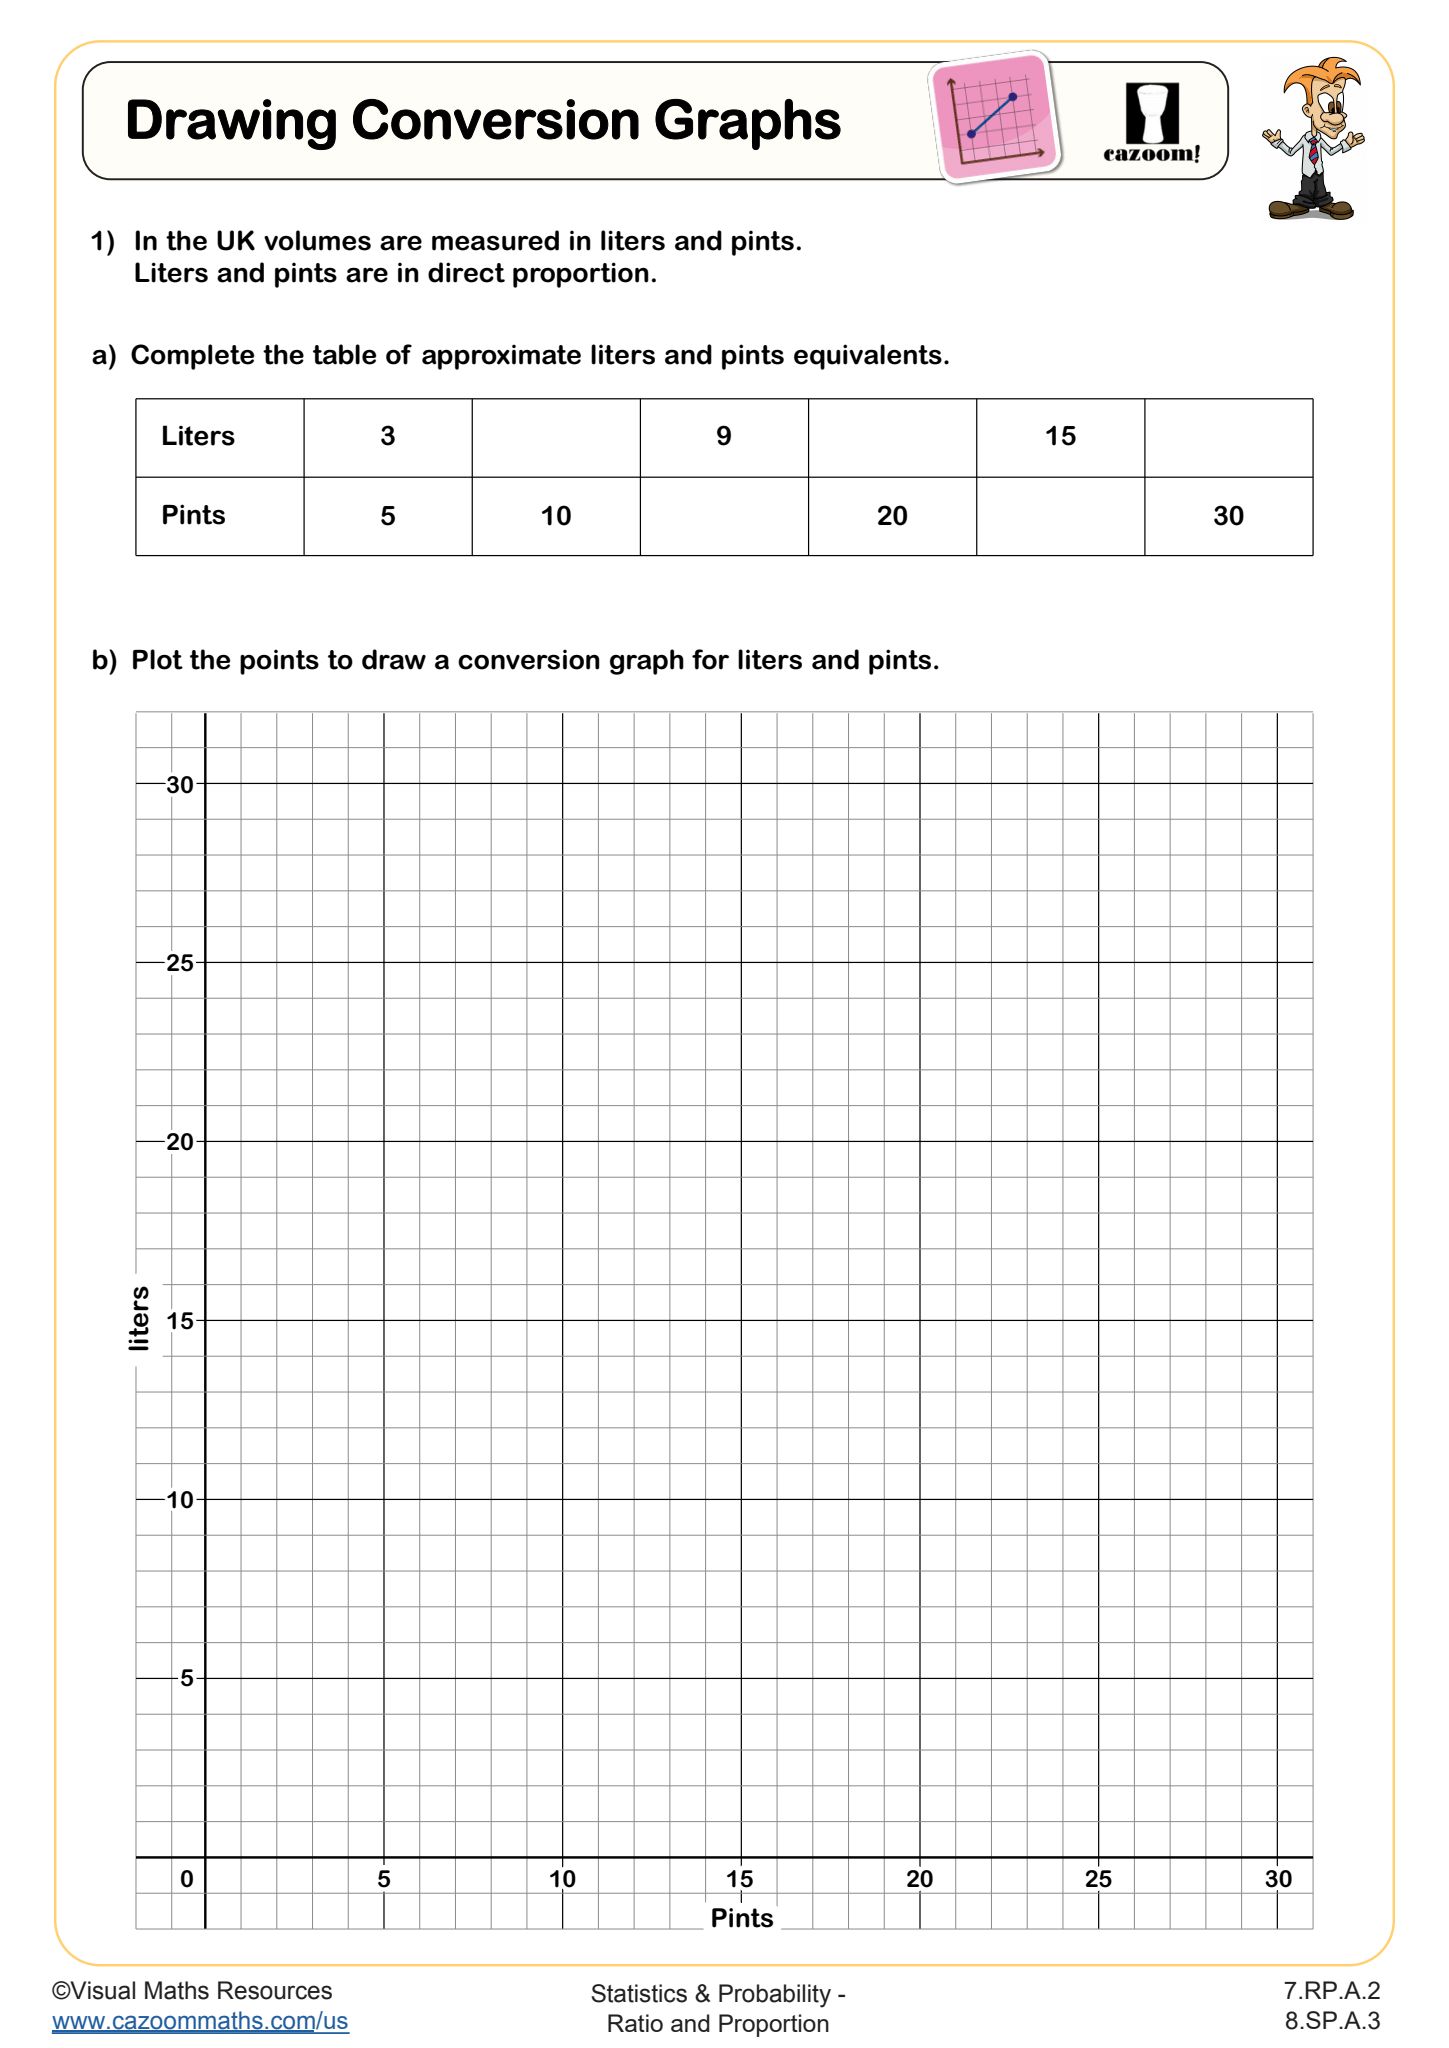
The conversion graphs include the following equivalences: kilometer to a mile, centimeter to an inch, degrees Celsius to Fahrenheit, and currency.
Learners will use direct proportion graphs to extrapolate information and explain why certain graphs may not support extrapolation.
Our collection also includes a worksheet focused on drawing conversion graphs.
All worksheets are created by the team of experienced teachers at Cazoom Math.

RELATED TO Using Conversion Graphs WORKSHEET
Frequently Asked Questions
This worksheet is designed for 7th and 8th grade students who are developing their understanding of proportion. At these grade levels, students have the mathematical foundation to work with direct proportion relationships and can handle the complexity of interpreting multiple types of conversion graphs simultaneously.