Using Venn Diagrams to Solve Problems WORKSHEET
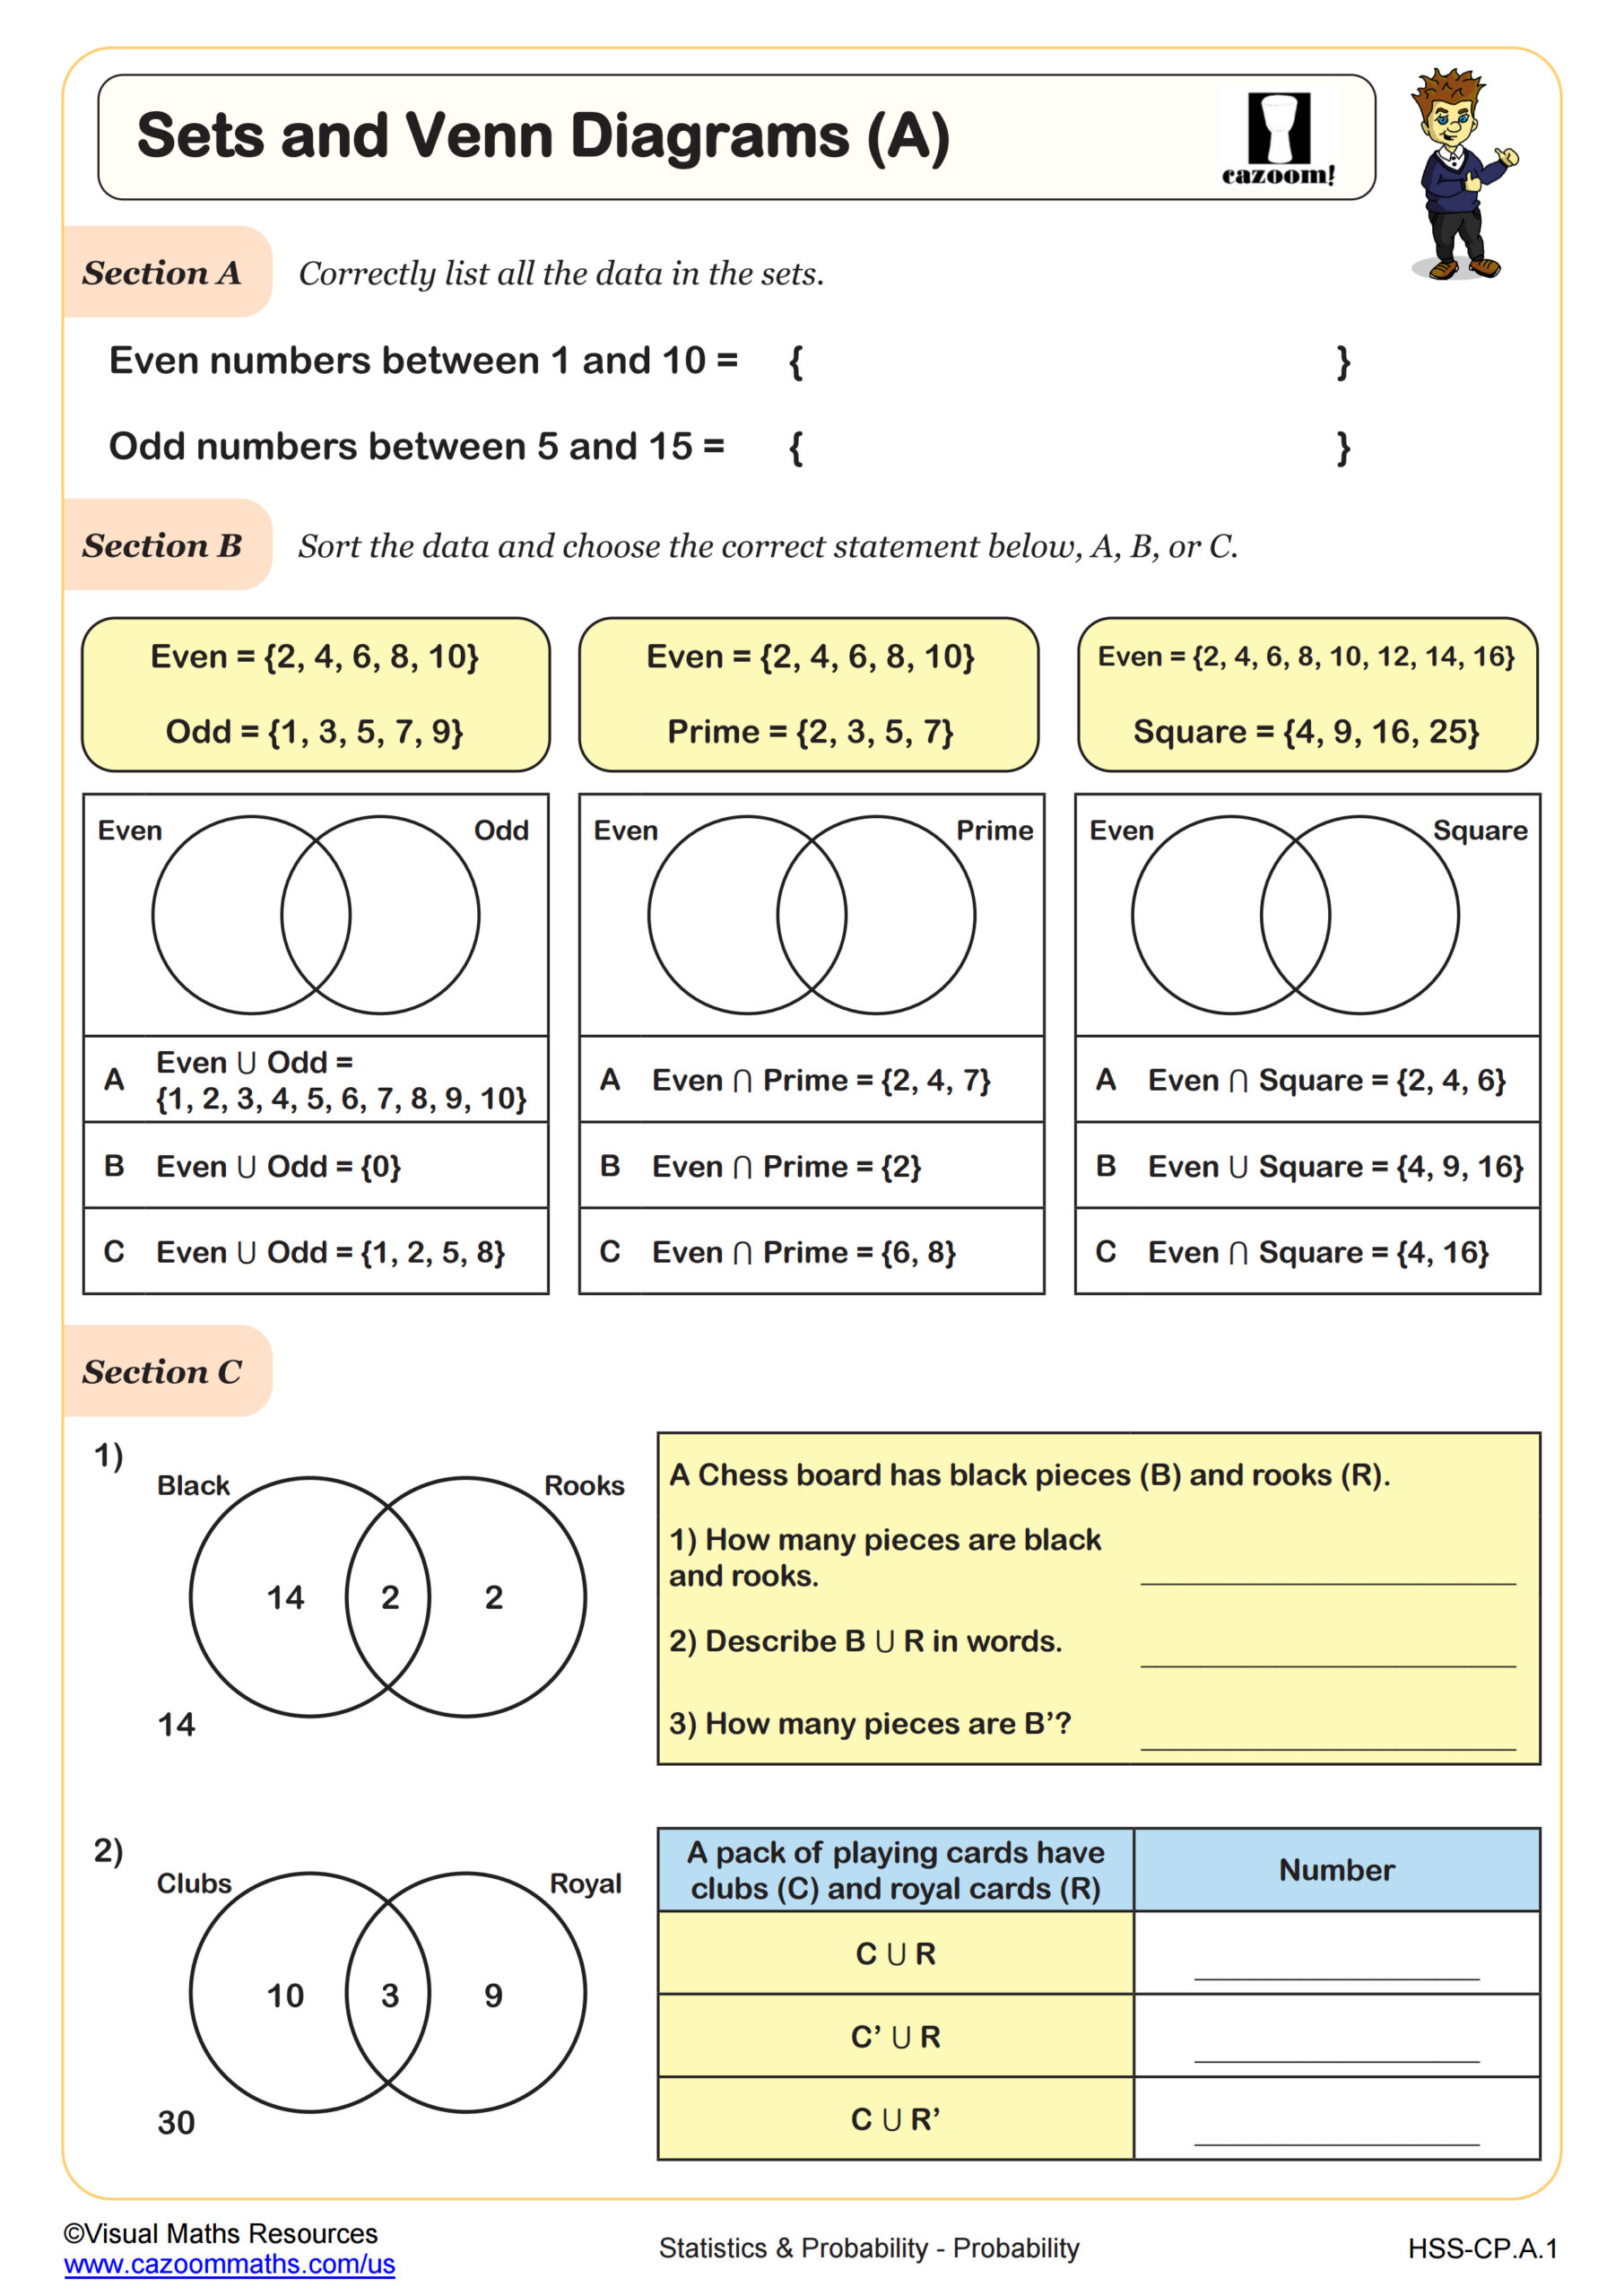
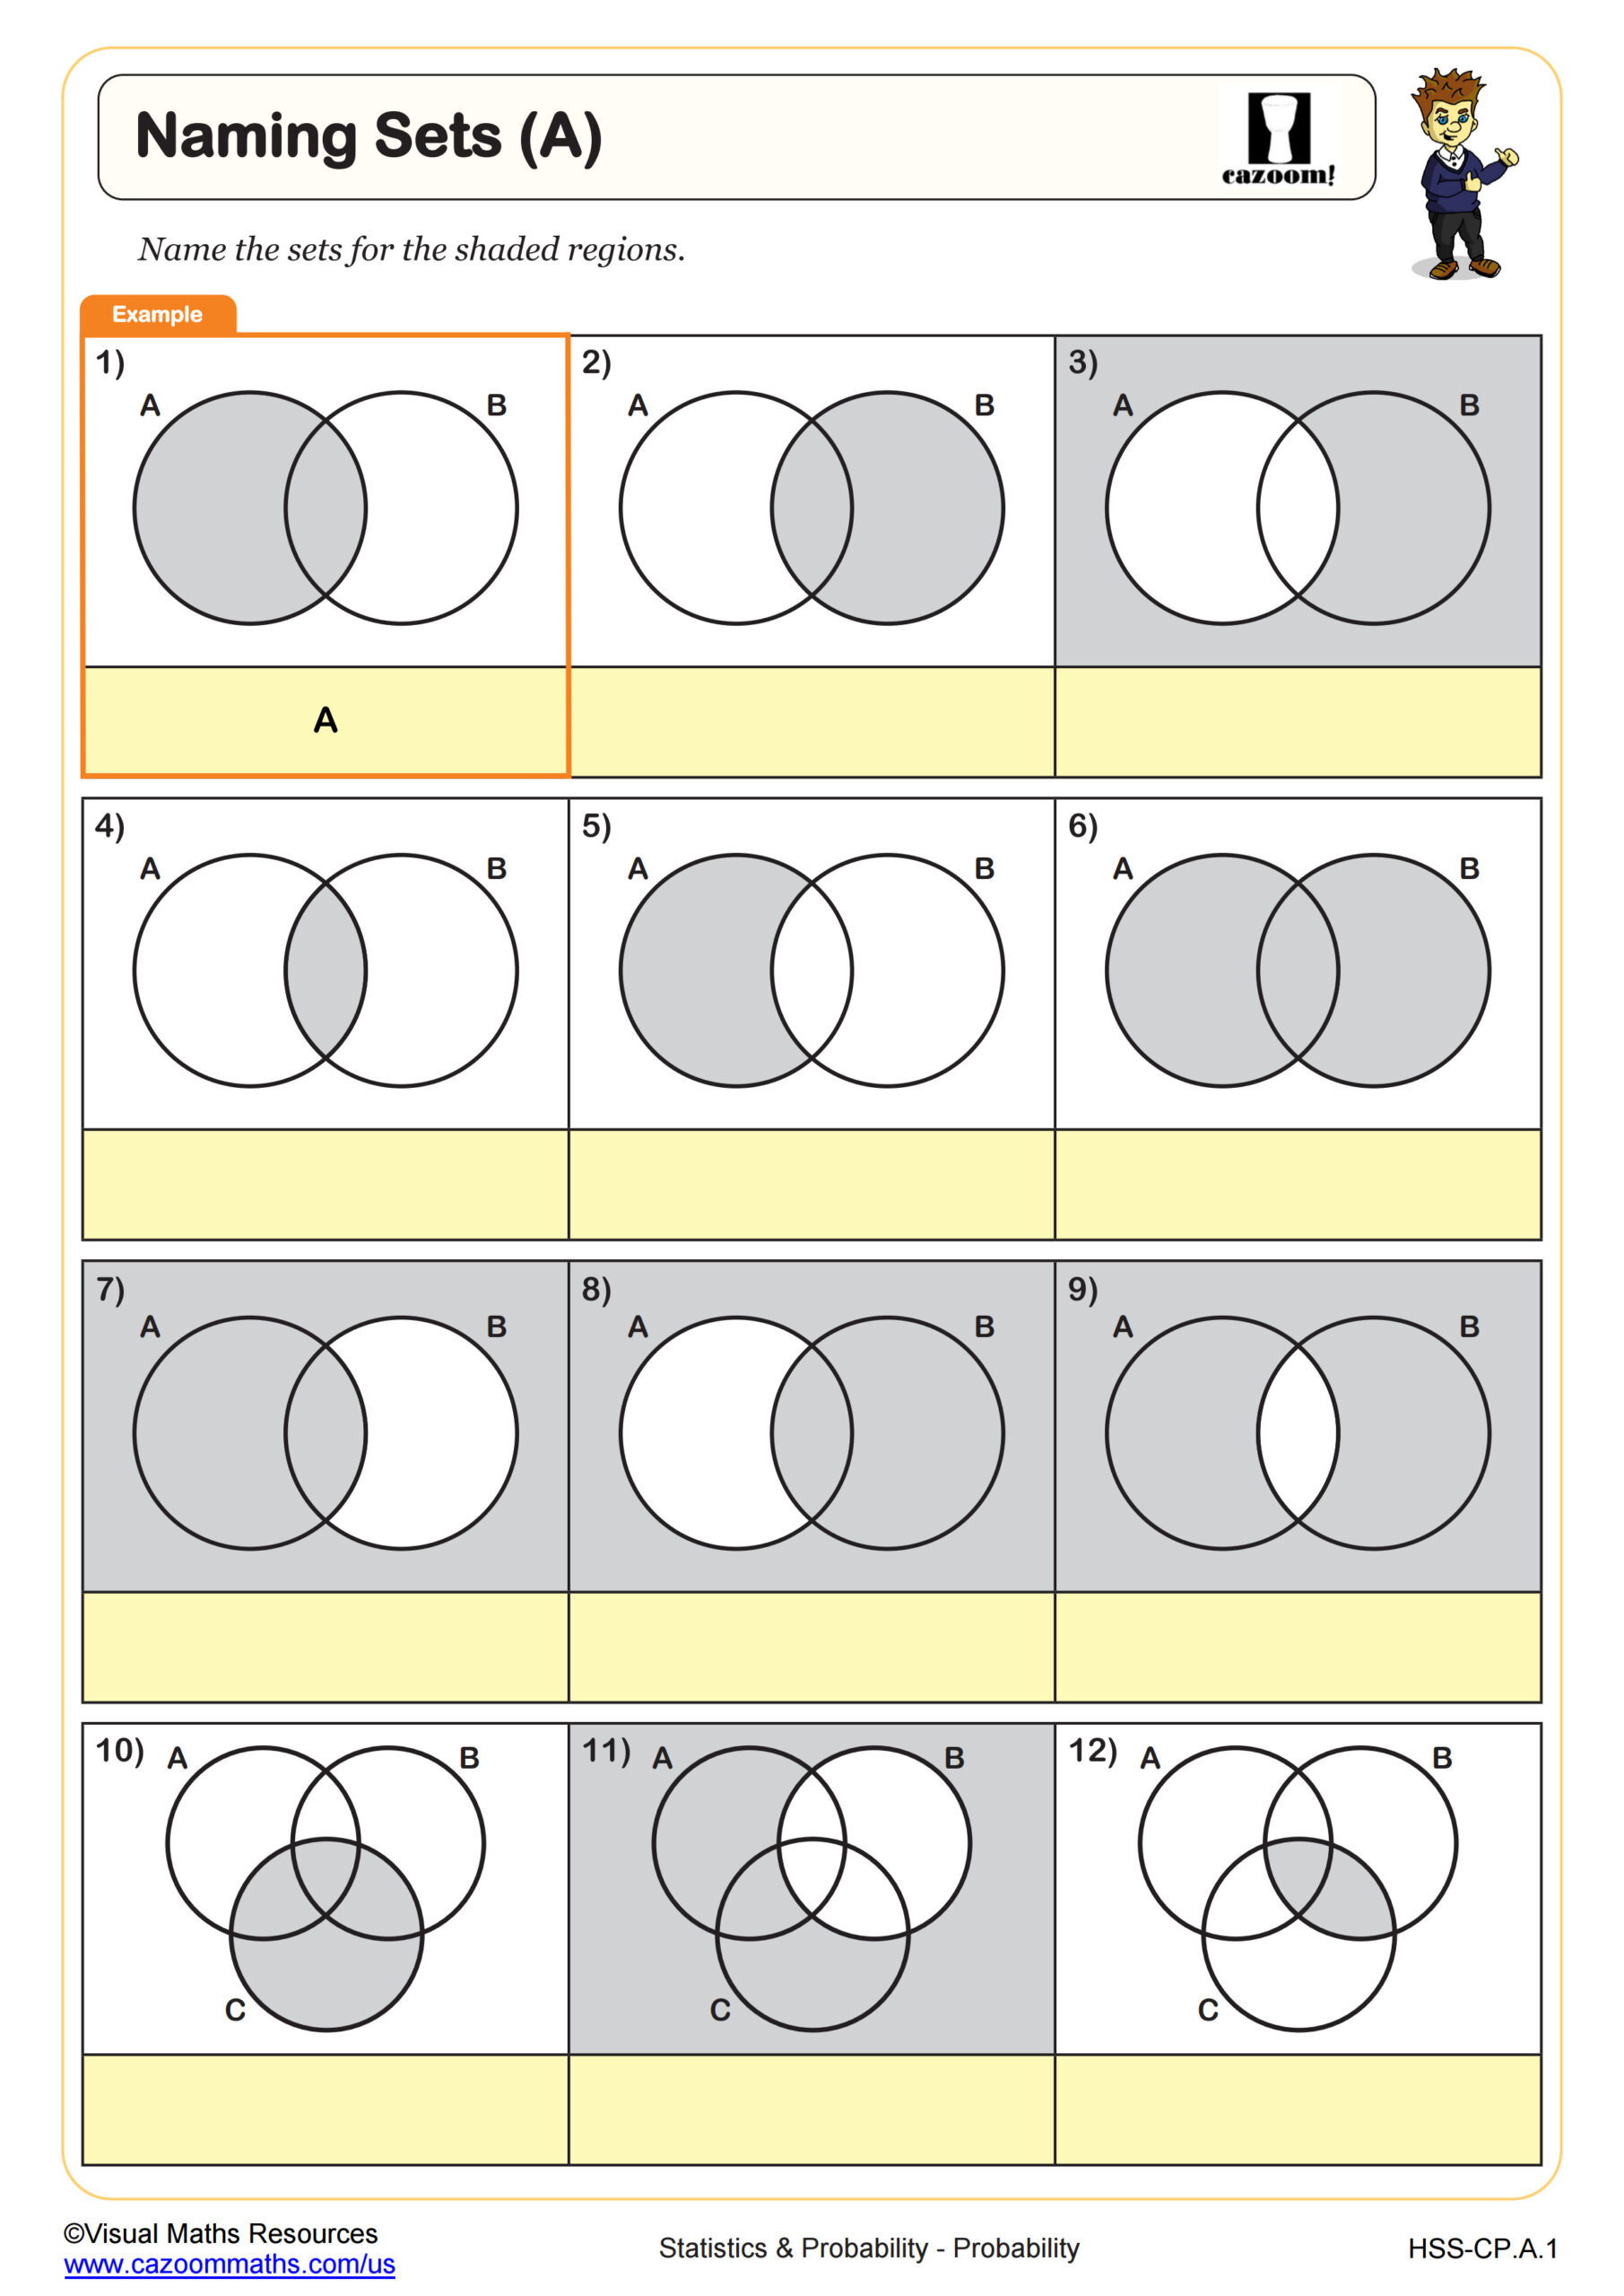
Describe events as subsets of a sample space (the set of outcomes) using characteristics (or categories) of the outcomes, or as unions, intersections, or complements of other events (“or,” “and,” “not”).
Using Venn Diagrams to Solve Problems WORKSHEET DESCRIPTION
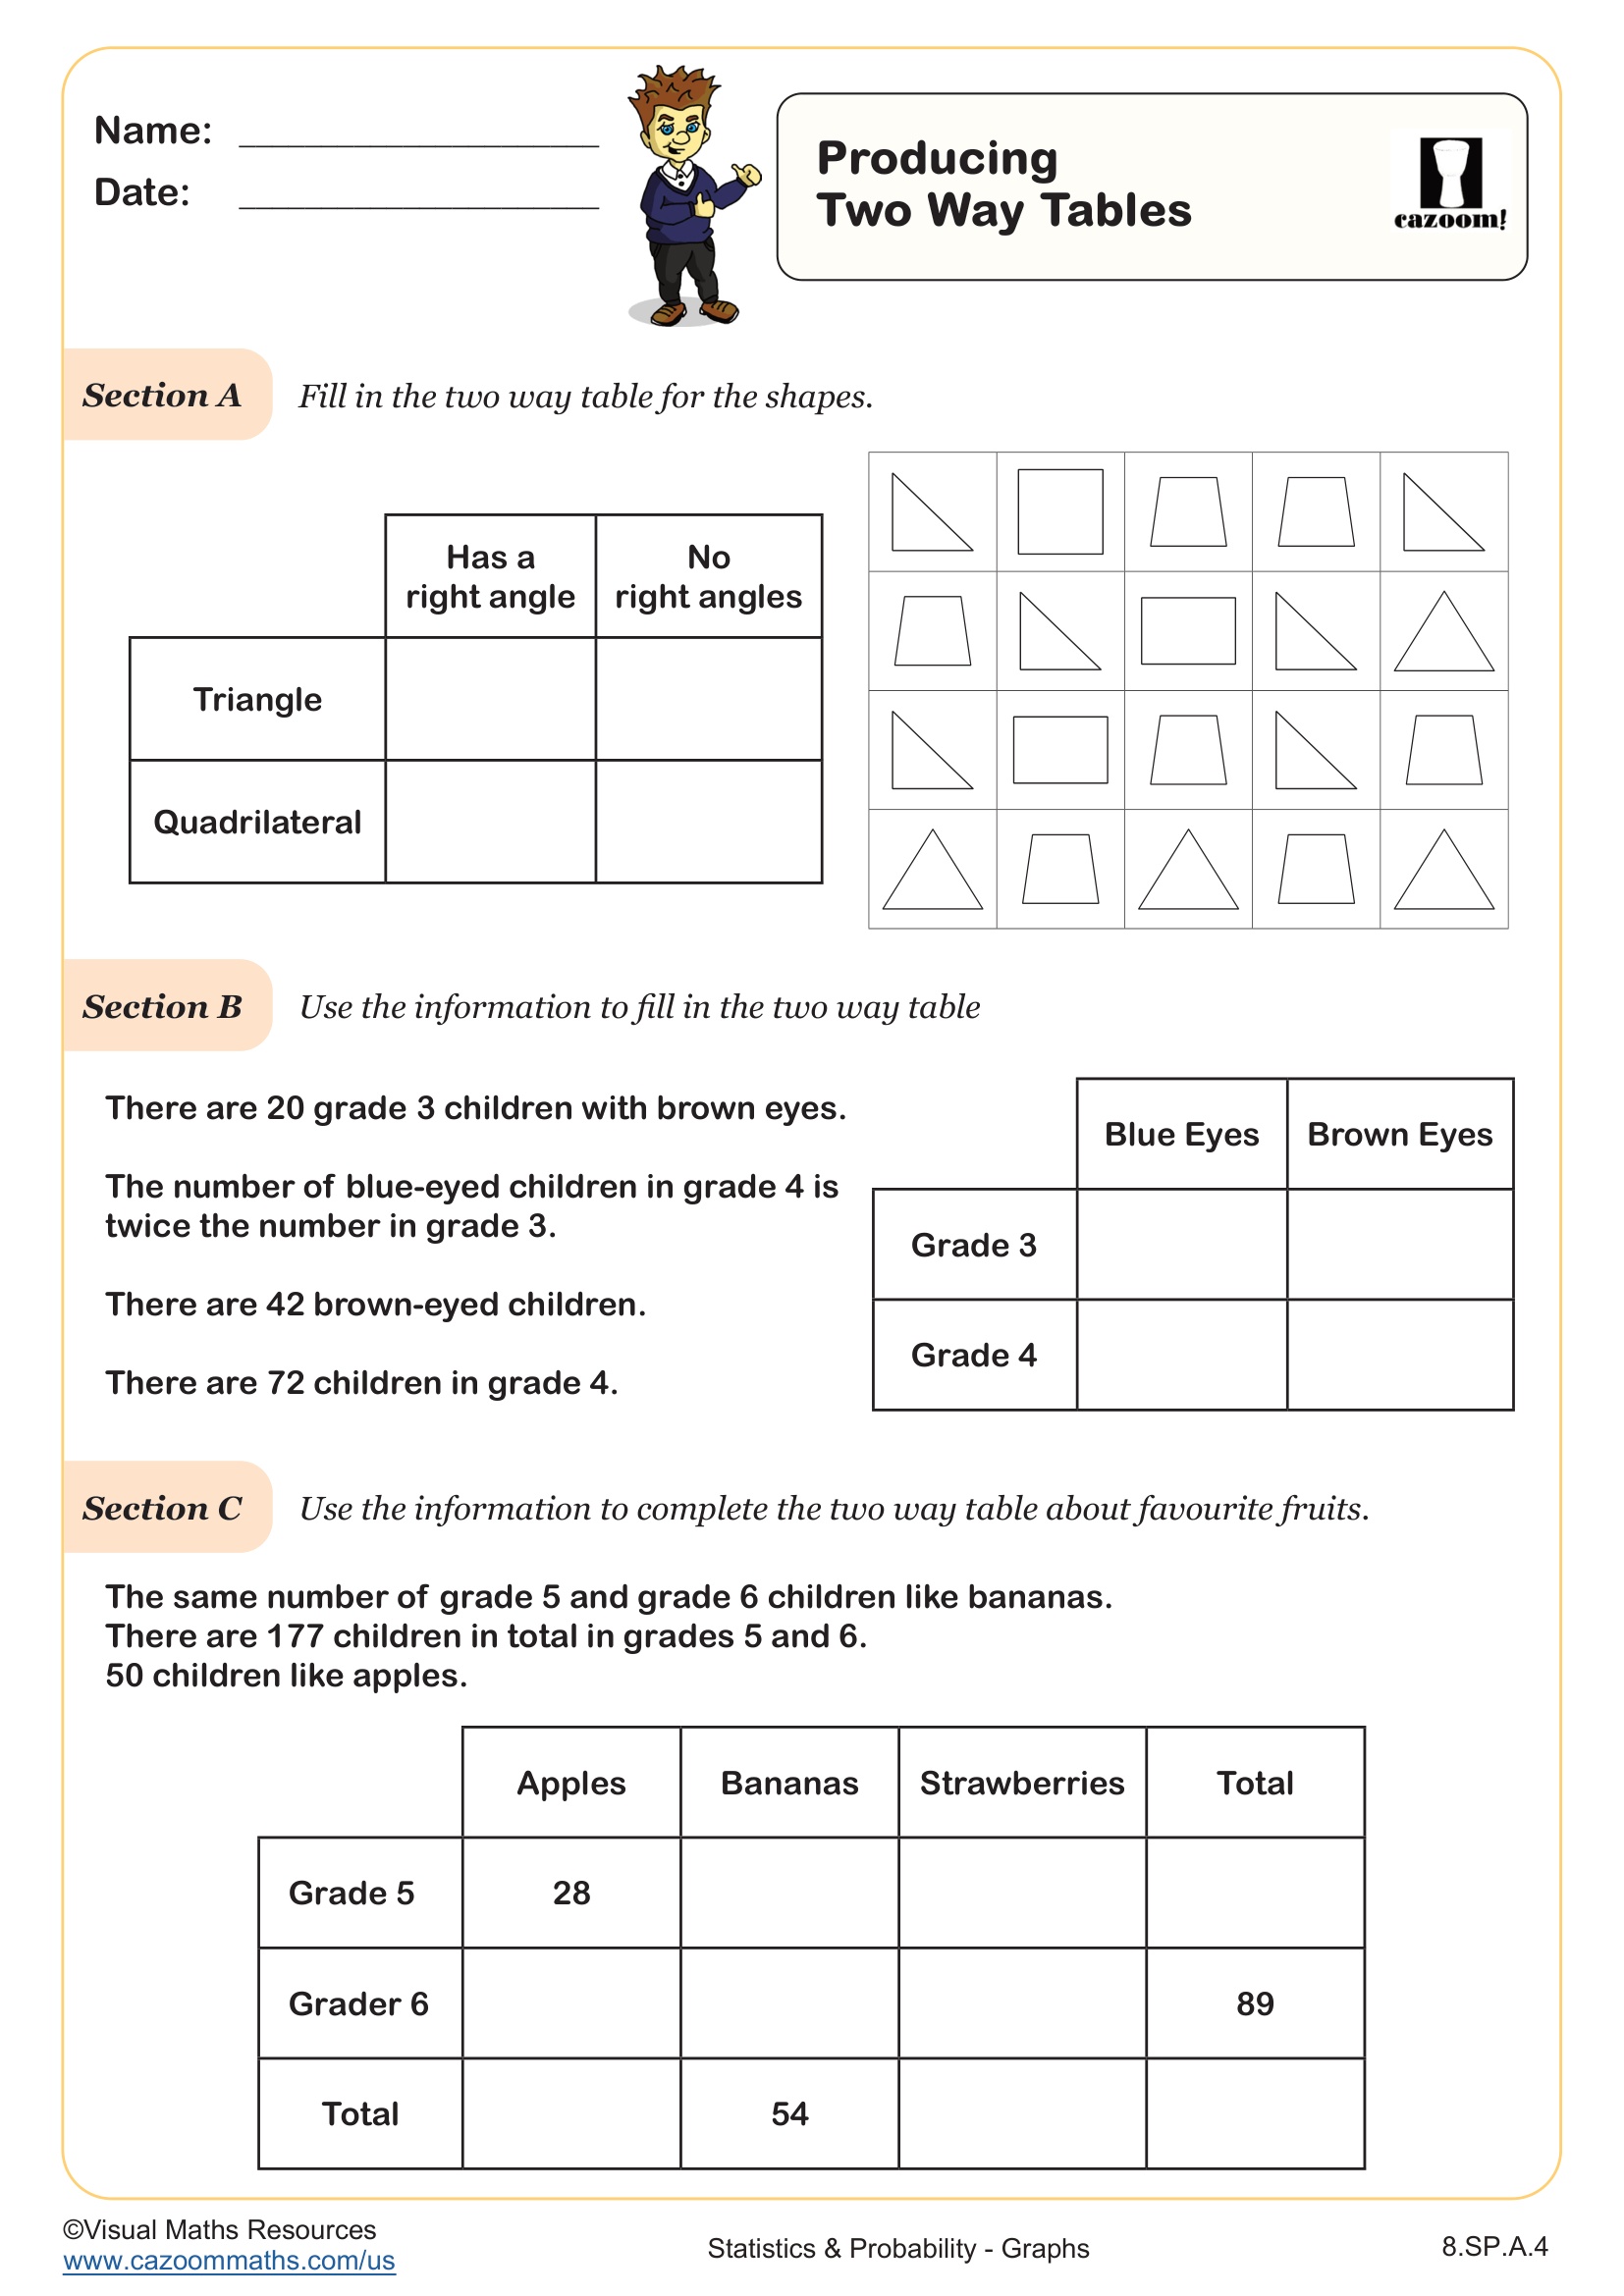
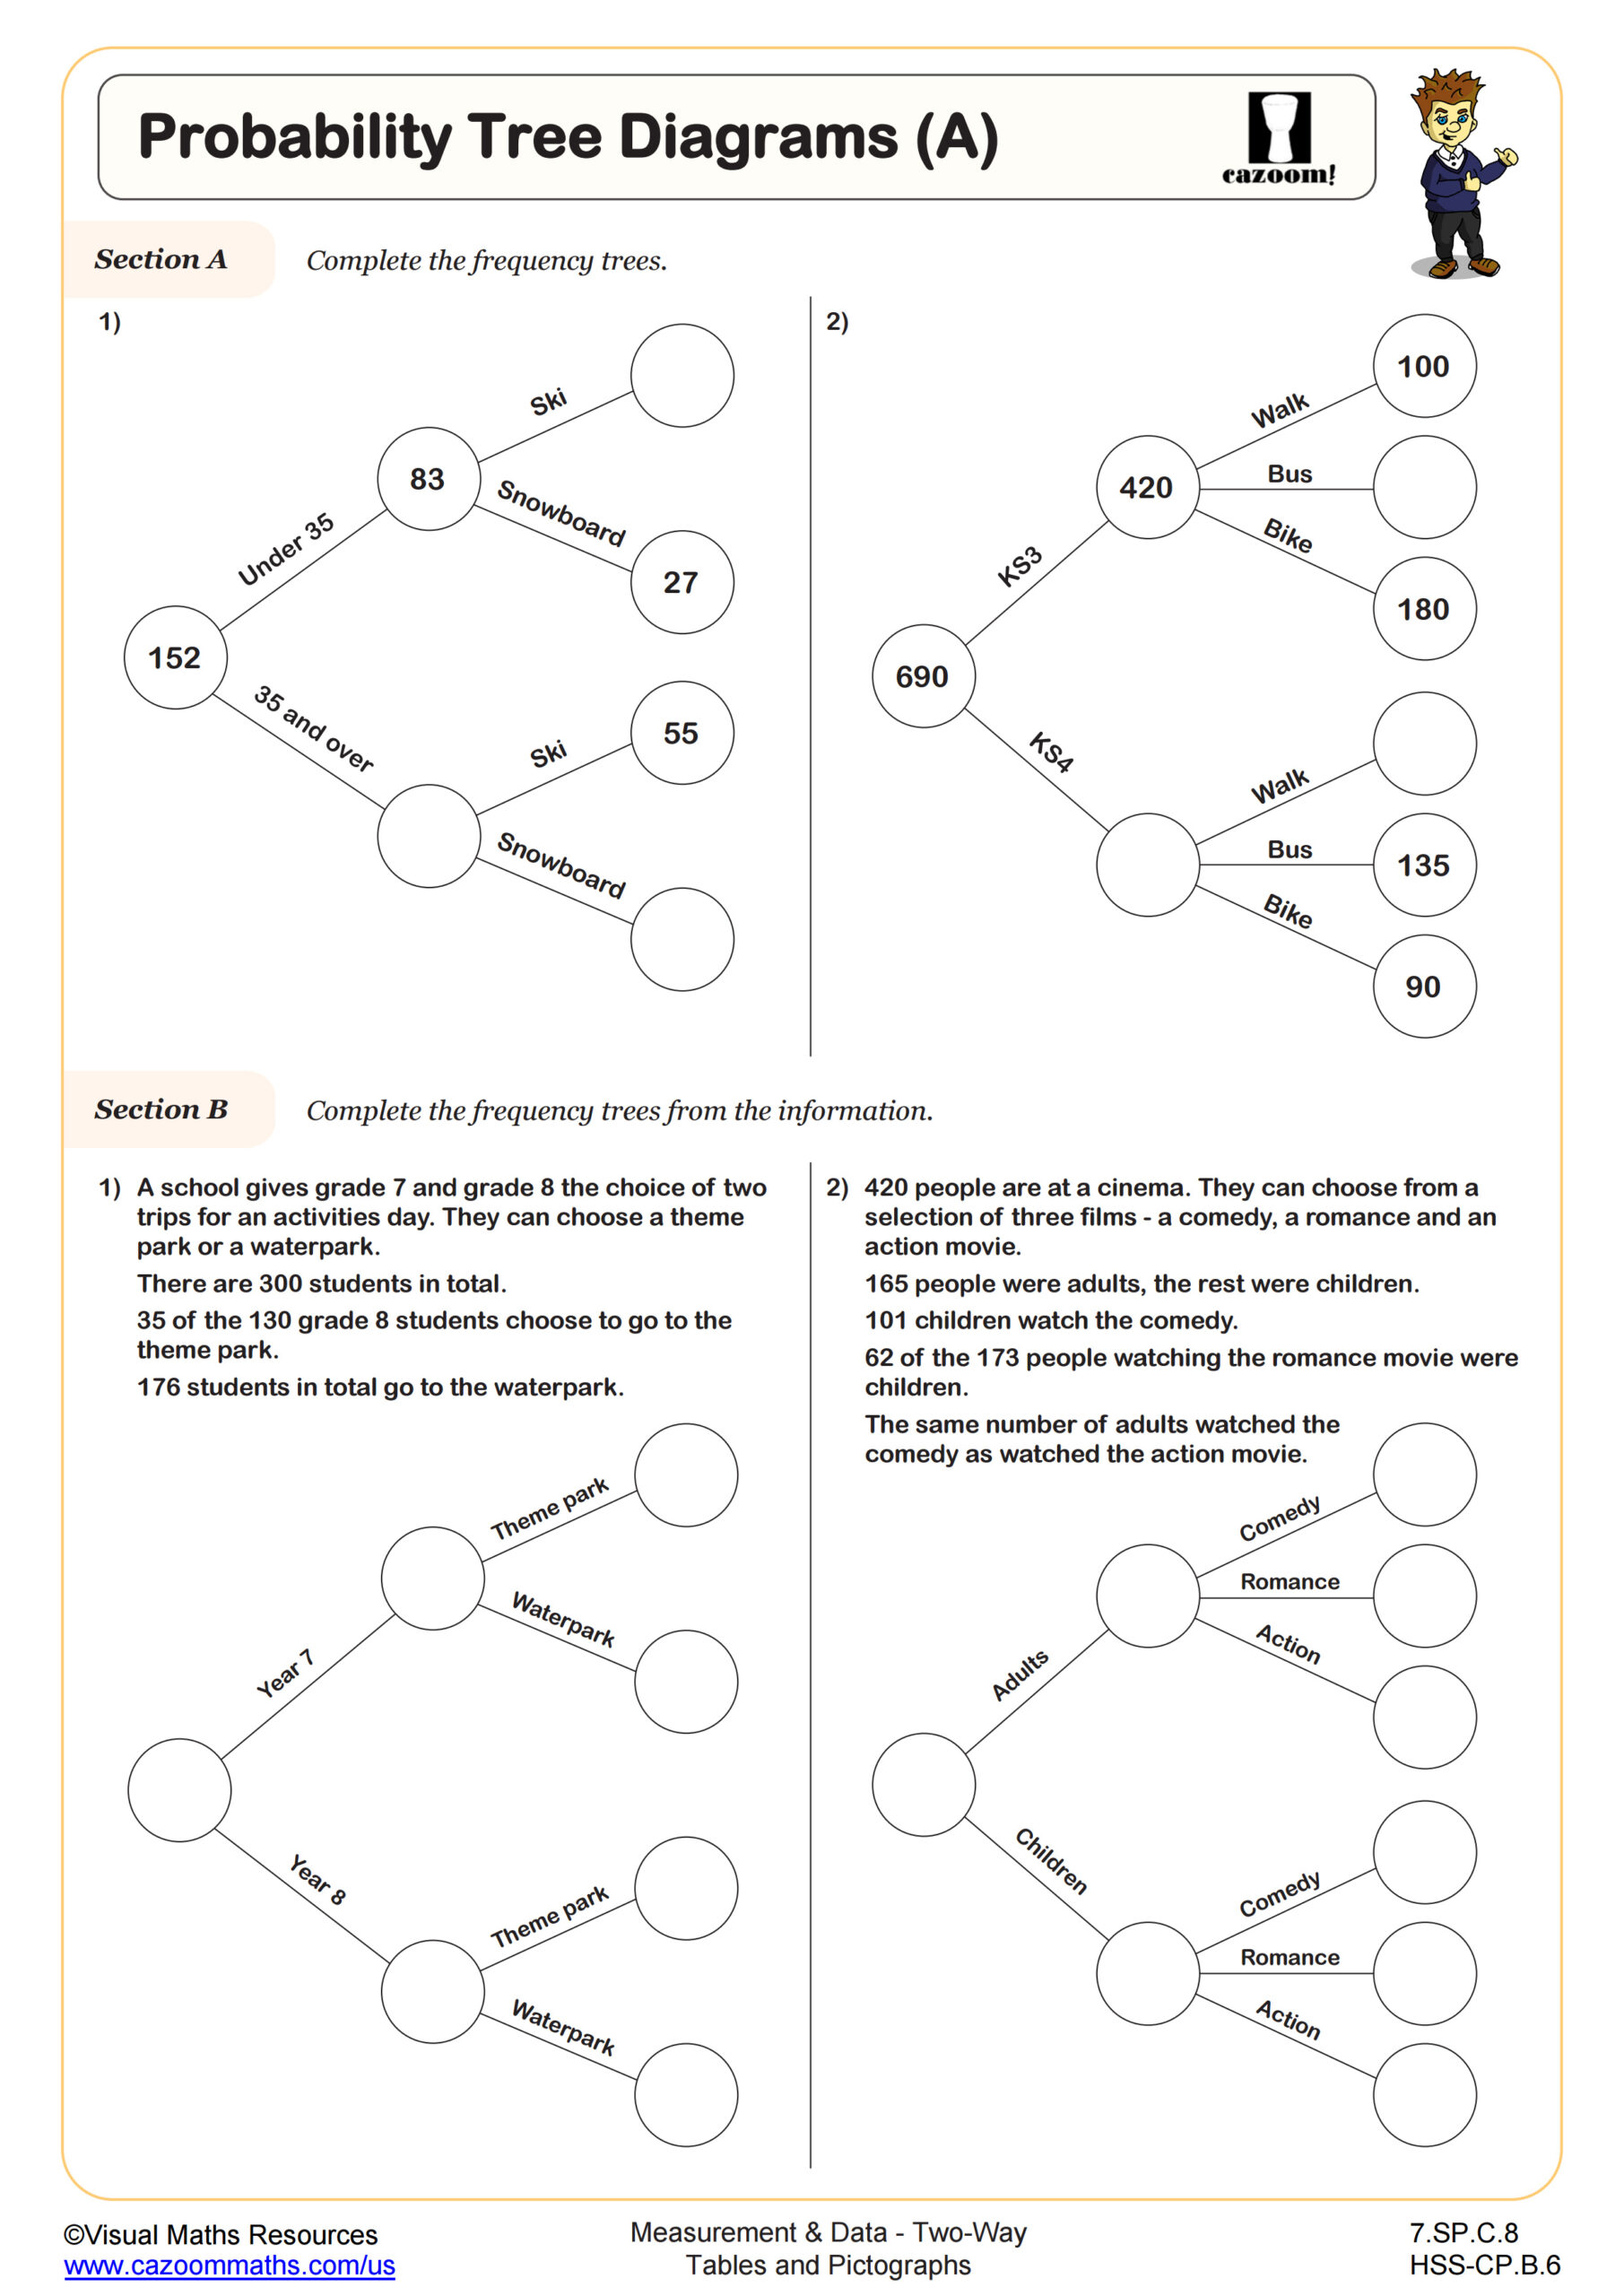
This worksheet helps students develop their ability to analyze and interpret data in probability and statistics. It progresses from simple sorting tasks to more challenging problem-solving that requires logical thinking.
Students start by completing Venn diagrams using given numerical information. As they advance, they work with percentages and overlapping data sets. Real-world contexts, such as library book checkouts, after-school activities, and restaurant dining choices, are used throughout. More advanced questions encourage critical thinking about overlapping groups.
Ideal for both conceptual understanding and exam readiness in probability-based questions.
All worksheets are created by the team of experienced teachers at Cazoom Math.

RELATED TO Using Venn Diagrams to Solve Problems WORKSHEET
Frequently Asked Questions
This statistics worksheet is designed for Algebra I, IM 1, and 8th Grade students. The progression from basic numerical sorting to more complex percentage-based problems makes it suitable for students at these levels who are building foundational skills in data analysis and logical reasoning.