1st Grade Pie Charts and Bar Charts Worksheets
All worksheets are created by the team of experienced teachers at Cazoom Math.
What Are Tally Charts and Why Do First Graders Learn Them?
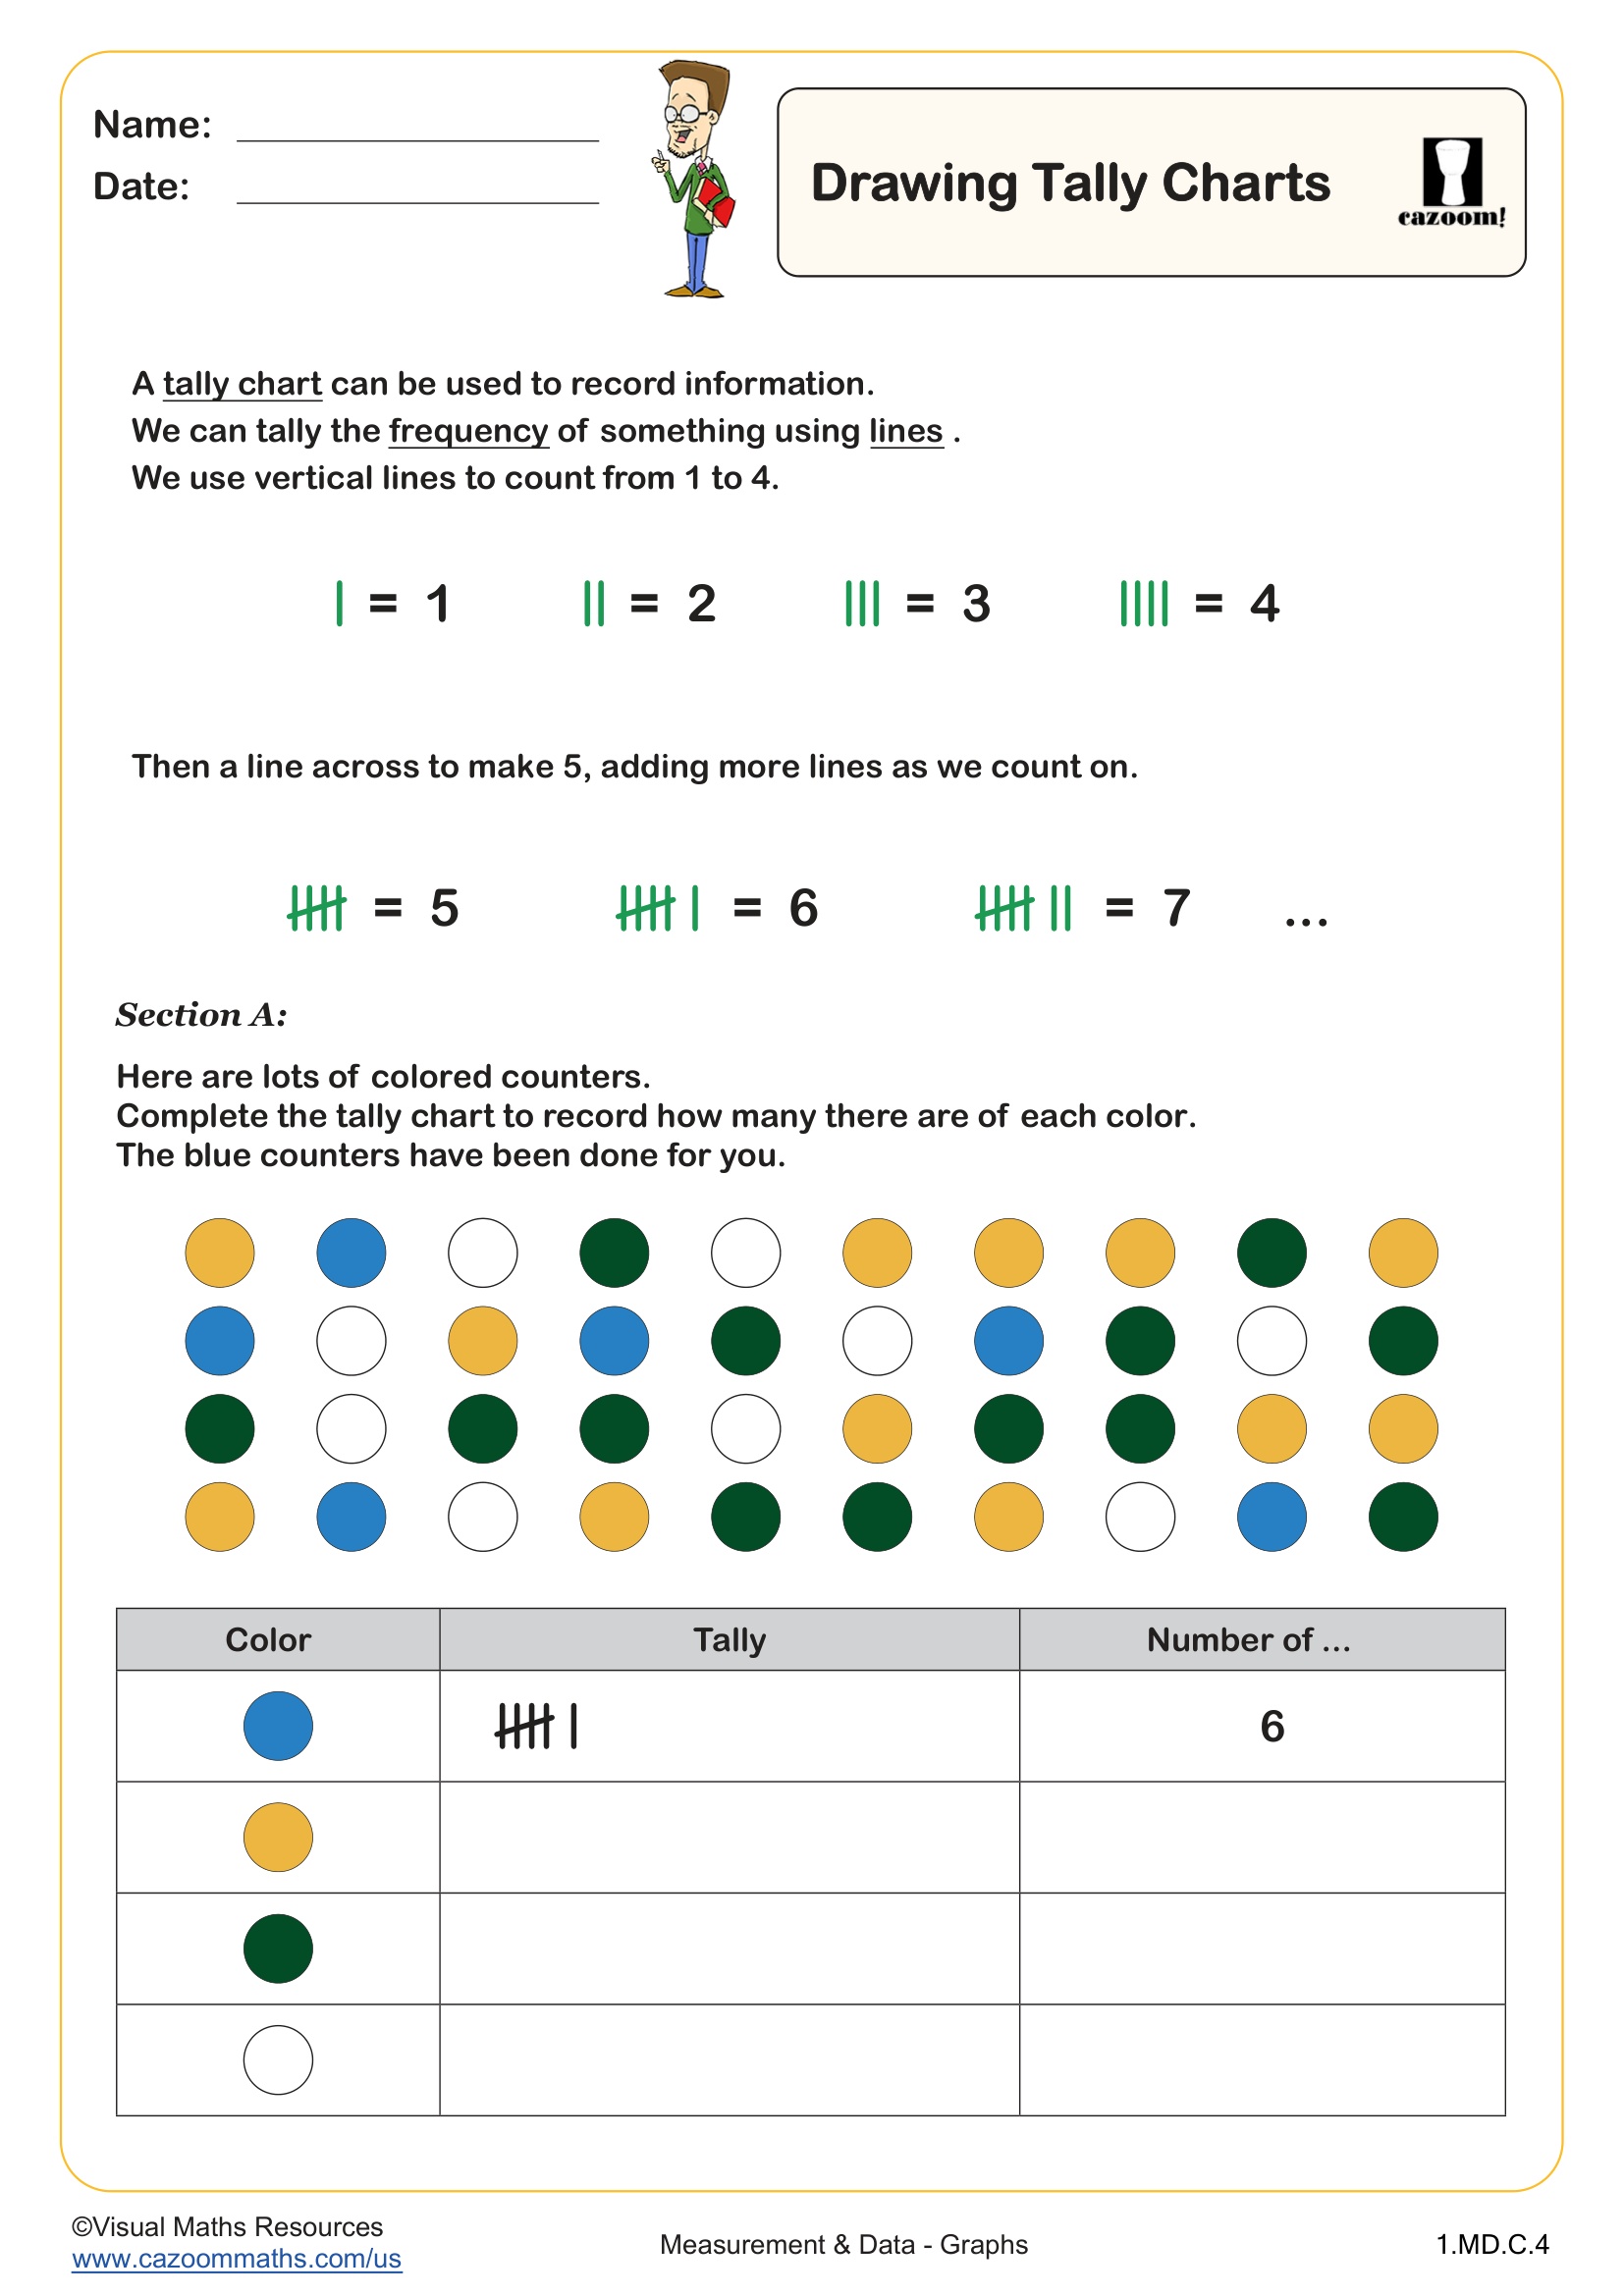
Tally charts are simple data organization tools that use vertical marks to represent counted items, with every fifth mark drawn diagonally across the previous four to create groups of five. First graders learn tally charts as their introduction to data handling because the visual nature of tally marks connects directly to counting objects, a skill they already possess. This topic appears in Common Core Standard 1.MD.C.4, which focuses on organizing and interpreting data.
Students often struggle initially with the grouping convention of crossing the fifth tally mark, sometimes continuing to draw vertical marks or forgetting to complete the group. Teachers find that using physical objects alongside tally practice helps students understand that each mark represents one item. The breakthrough typically happens when students realize that grouping by fives makes counting faster and more accurate, especially when dealing with larger data sets during classroom surveys or observations.
What Should First Graders Know About Data and Charts?
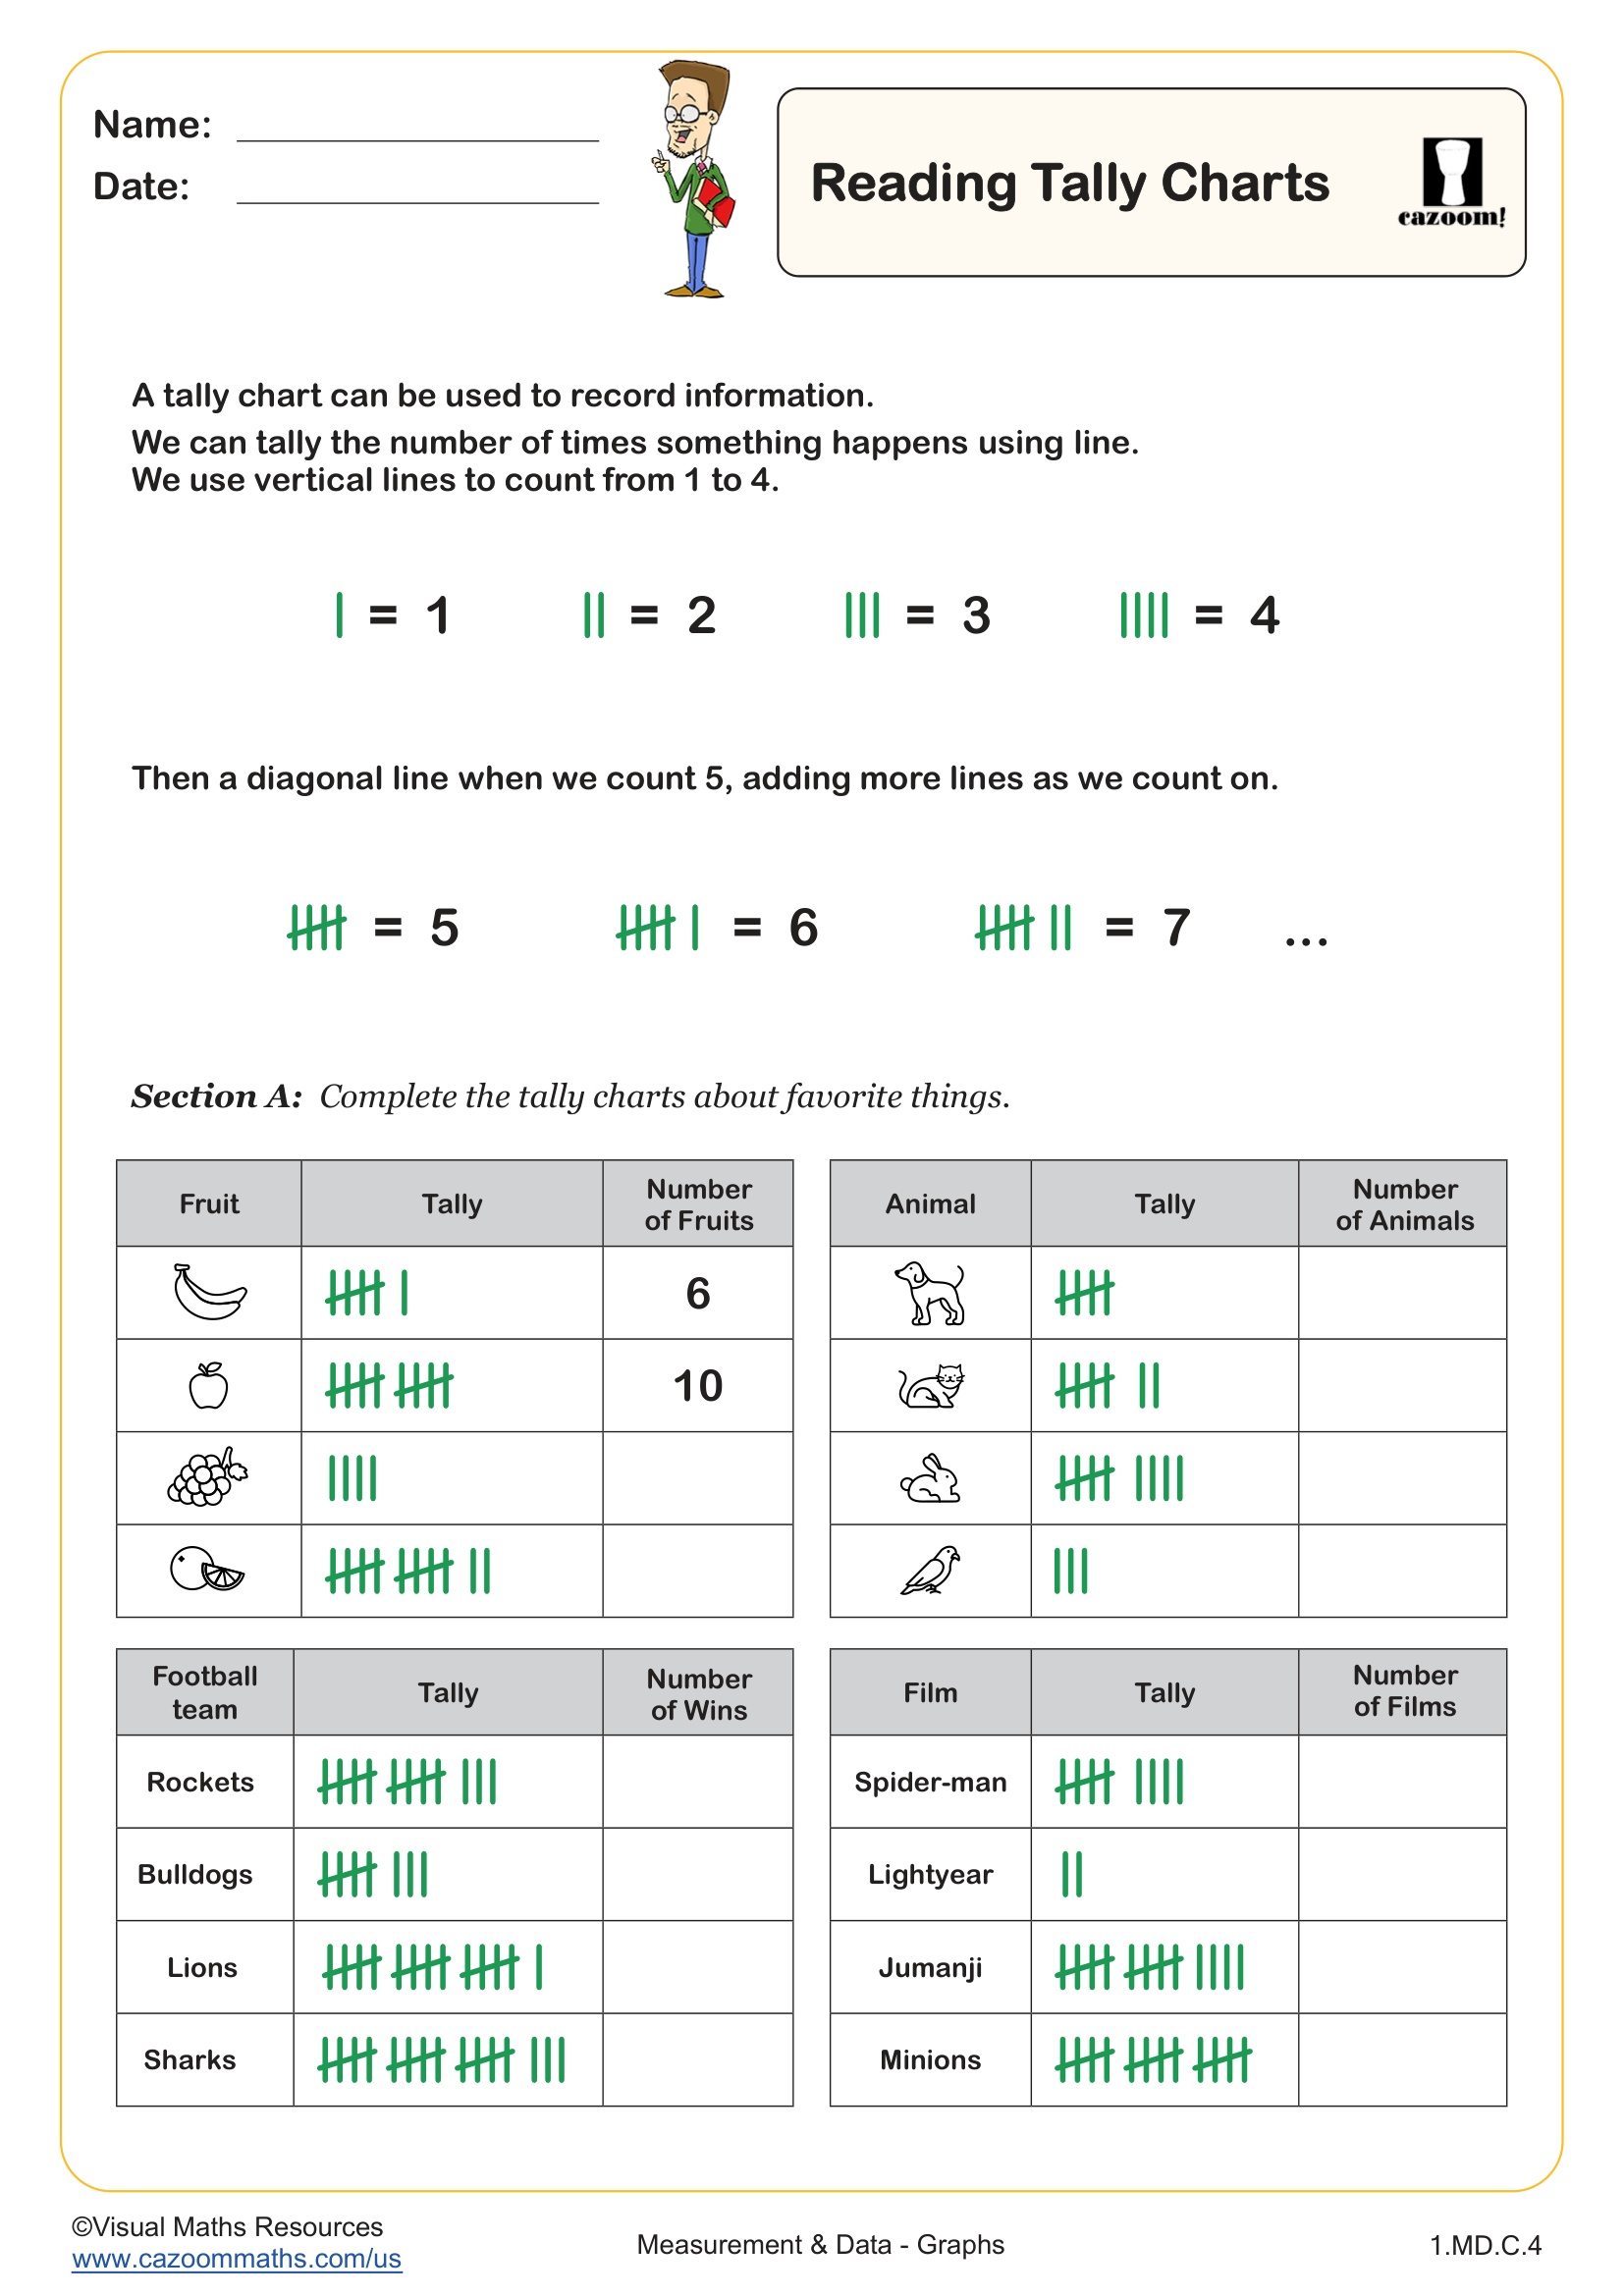
By the end of first grade, students should confidently create tally charts from collected data, count tally marks accurately (including grouped sets of five), and answer simple questions based on the information displayed. They should recognize that tally charts help organize information so it's easier to compare quantities and draw conclusions. At this level, data topics typically involve familiar contexts like favorite colors, pets, or snacks, keeping the focus on the mathematical skills rather than complex scenarios.
This work builds directly on kindergarten counting and comparison activities, where students sorted objects and compared groups using terms like more, fewer, and same. The tally chart skills developed in first grade prepare students for second grade, when they'll create picture graphs and bar graphs with scales. Teachers notice that students who develop strong tally chart skills transition more smoothly to these representations because they already understand how to organize counted information systematically.
How Do Students Learn to Draw Tally Charts?
Drawing tally charts involves several steps: identifying categories to count, making one tally mark for each item counted, grouping marks by fives with diagonal crosses, and labeling the chart clearly. Students begin with simple scenarios involving 10-15 total items, which keeps the counting manageable while they learn the recording system. Teachers often start by having students count physical objects and transfer that count to tally marks, creating a concrete connection between the quantity and its representation.
Tally charts appear frequently in real-world contexts, from inventory tracking in stores to scientific data collection. Scientists use tally systems to record animal sightings during field observations, and quality control specialists in manufacturing use them to track defects or counts on production lines. Even young students can practice authentic data collection by tallying classroom attendance patterns, weather observations over a week, or the types of vehicles passing by the school. These activities show students that organizing information helps people make decisions and notice patterns in the world around them.
How Can Teachers Use These Tally Chart Worksheets Effectively?
The worksheets provide structured practice with both interpreting existing tally charts and creating new ones from given scenarios. Reading tally chart activities build comprehension skills as students extract information and answer questions about the data, while drawing activities develop the technical skill of properly marking and grouping tallies. The answer keys allow students to self-check their work during independent practice, building confidence and immediate feedback that reinforces correct techniques.
Many teachers use these worksheets during math centers, pairing students so they can discuss their counting strategies and catch each other's errors with the grouping convention. The worksheets work well for quick formative assessments to identify which students need additional support with counting by fives or organizing information systematically. Some teachers assign these as homework after conducting a class survey, asking students to create their own tally chart based on family data, which extends the learning beyond the classroom and involves families in the mathematical process.