1st Grade Statistics Worksheets
All worksheets are created by the team of experienced teachers at Cazoom Math.
What Statistics Concepts Do First Graders Learn?
First grade statistics focuses on collecting, organizing, and representing data in simple formats that align with Common Core Standard 1.MD.C.4. Students learn to ask questions, gather information through surveys or observations, and display their findings using tally charts, picture graphs, and bar graphs with single-unit scales. They also practice interpreting these representations by answering questions about which category has more, less, or the same amount.
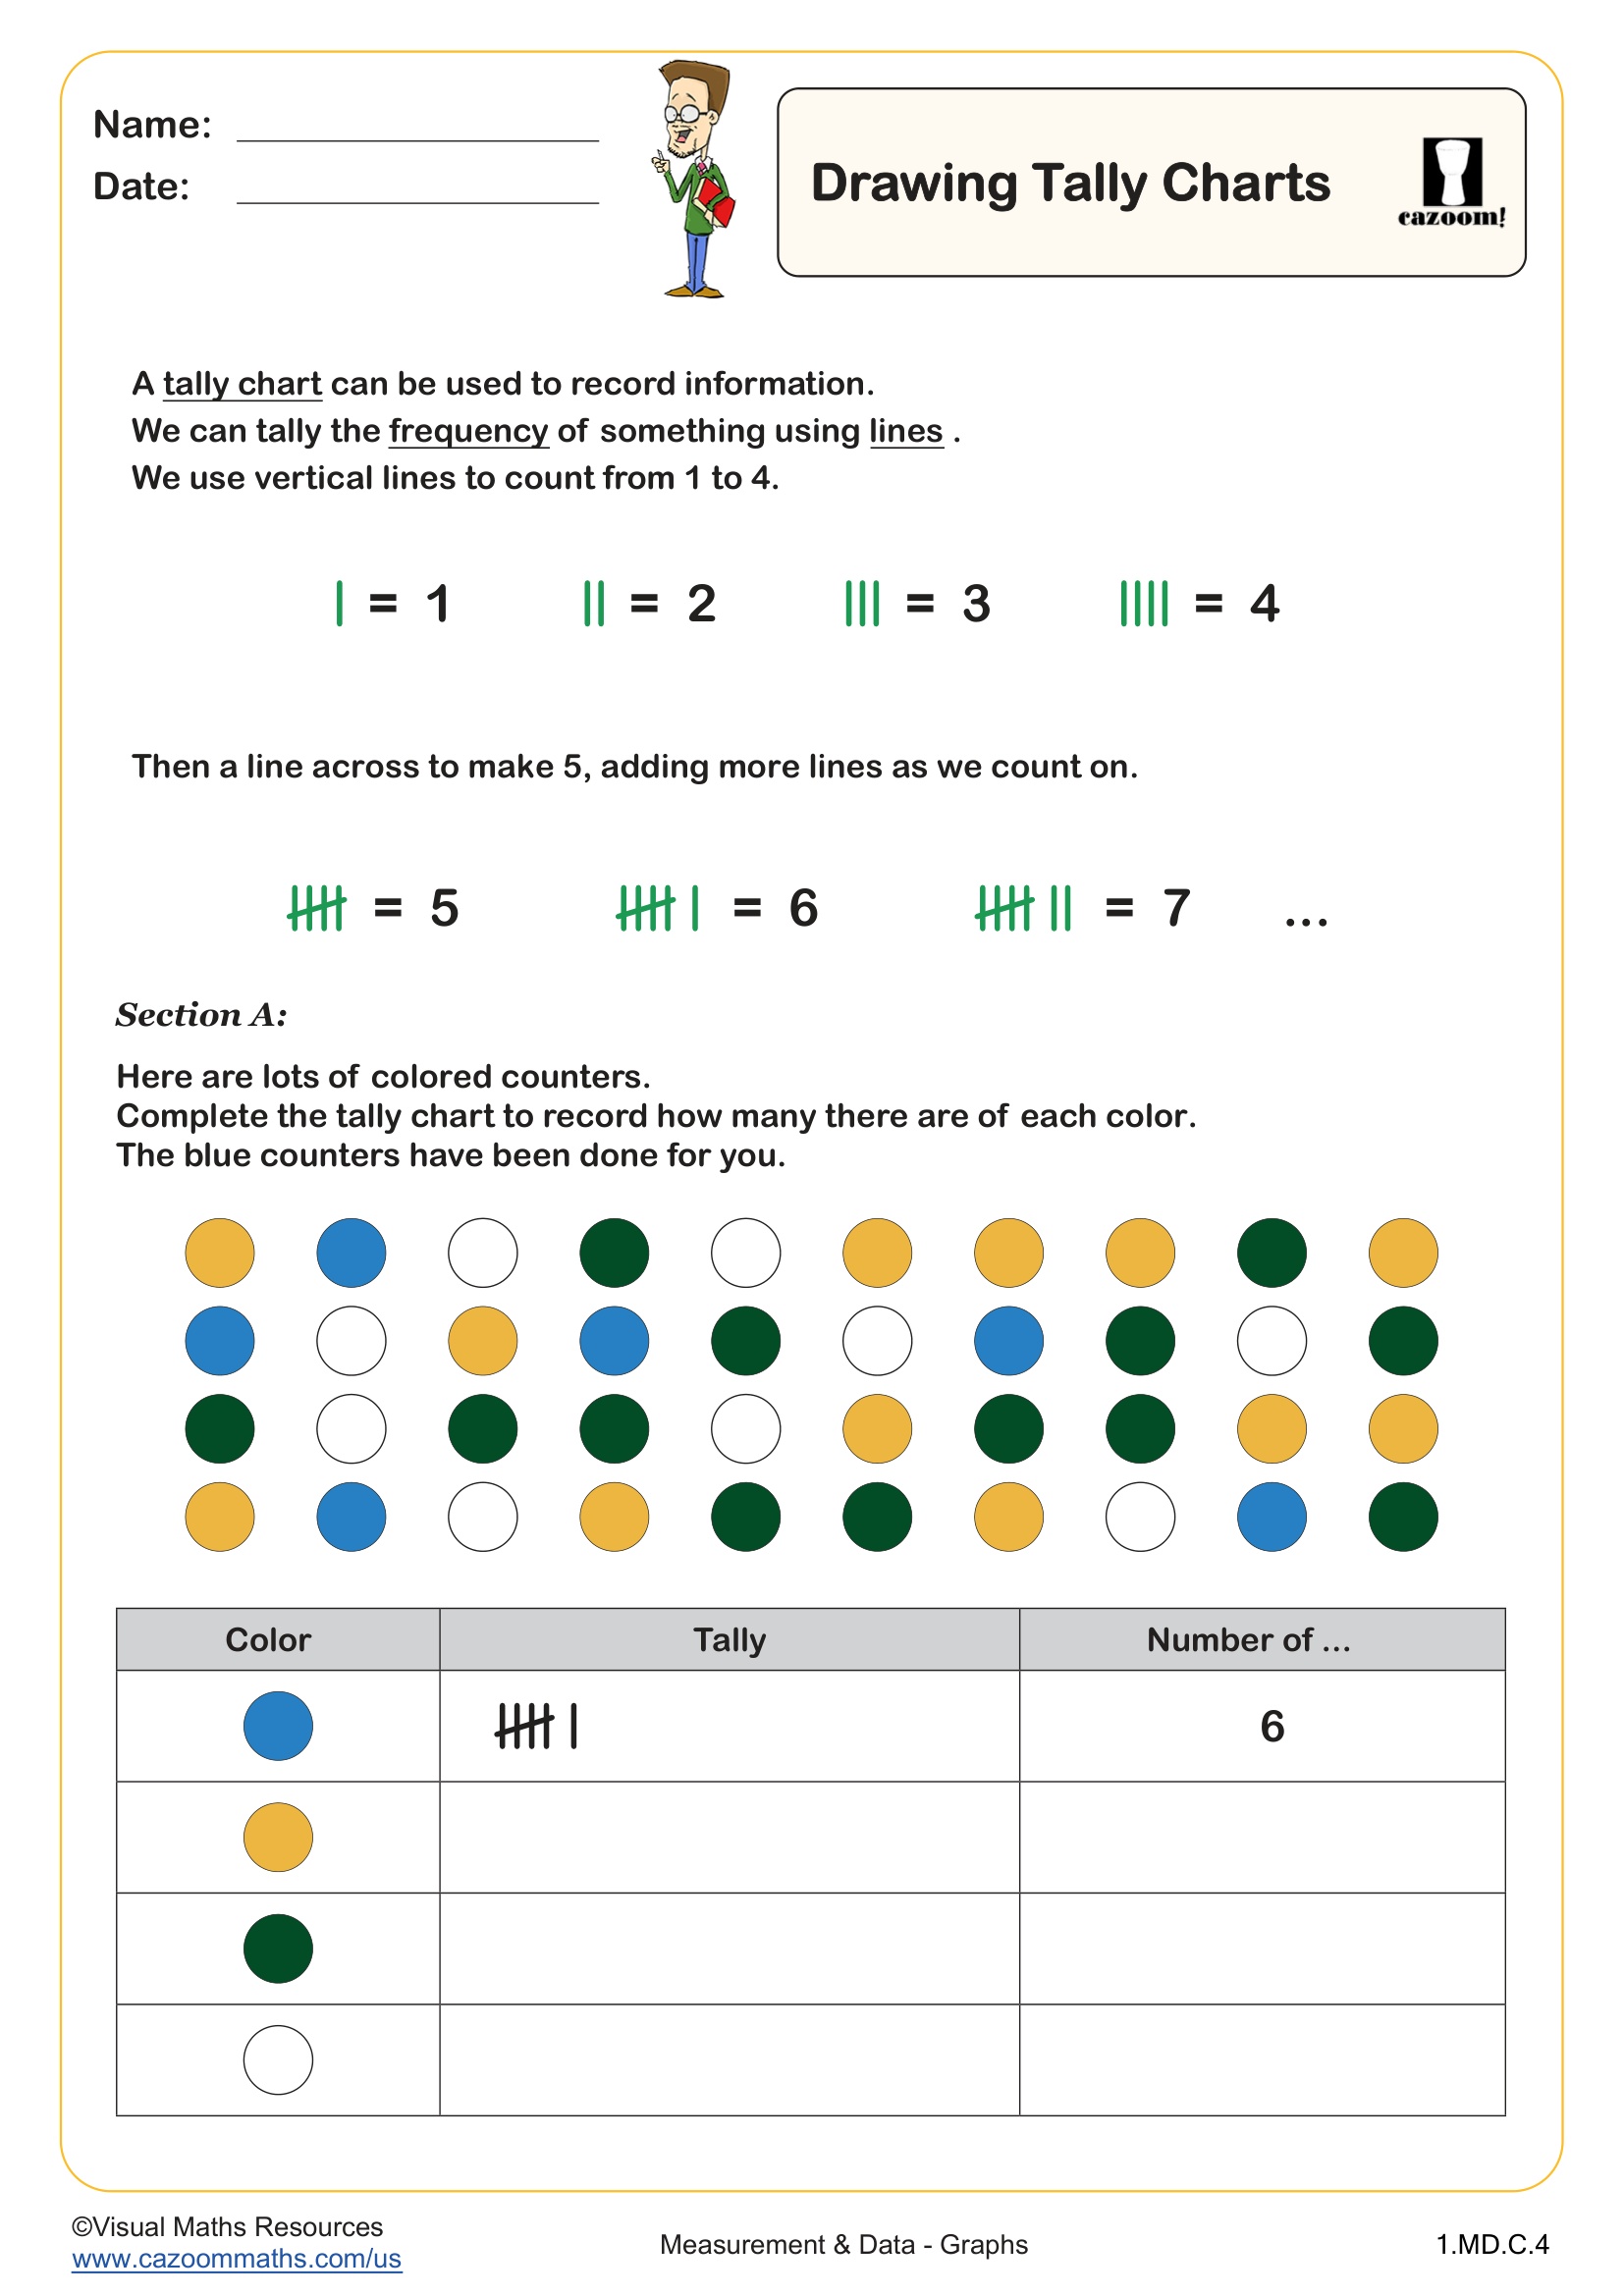
Many teachers observe that students grasp data collection quickly but struggle with consistent tally mark notation. Students often forget to cross through groups of four tallies or create bundles with more or fewer than five marks total. Providing reference cards showing the proper tally bundling method and allowing students to count actual objects before tallying helps reinforce the connection between counting and recording data accurately.
Are First Graders Ready for Statistics Work?
First graders are developmentally ready for introductory statistics when they have solid counting skills to 20 and can sort objects by attributes like color, size, or shape. At this stage, students should understand one-to-one correspondence and basic comparison vocabulary such as more, fewer, and equal. These prerequisite skills create the foundation for organizing data into categories and making simple comparisons between groups.
This early statistics work builds directly on the sorting and classification activities from kindergarten while preparing students for the more sophisticated graphing and data analysis expected in second grade. Students who master tally charts and simple picture graphs in first grade transition more confidently to scaled bar graphs and line plots in later elementary years, as they've already developed the habit of organizing information visually before analyzing it.
How Do Tally Charts Help Students Organize Information?
Tally charts provide a systematic method for recording data as it's collected, using vertical marks grouped in bundles of five for easier counting. This format teaches students to track information in real time during surveys or observations while creating a visual record that's simple to total. The bundling system reinforces skip counting by fives, connecting data collection directly to multiplication readiness and mental math strategies that students will use throughout elementary school.
Tally charts appear frequently in real-world contexts that first graders encounter, from classroom attendance tracking to voting on favorite snacks or books. Teachers notice that students make authentic connections when they use tally charts to count birds at a feeder, track weather patterns over a week, or record classmates' shoe colors. These practical applications help young learners understand that mathematics serves as a tool for organizing and making sense of the world around them, building early foundations for data literacy in science and social studies.
How Can Teachers Use These Statistics Worksheets Effectively?
These worksheets provide structured practice that moves students from guided examples to independent application of tally chart skills. The scaffolded approach helps students understand when and how to use tallies for data collection, with visual models showing proper mark formation and bundling techniques. Complete answer keys allow teachers to quickly assess understanding and identify students who need additional support with counting bundles or organizing data into categories.
Teachers find these worksheets particularly useful during math centers or small group instruction, where students can work at their own pace while the teacher circulates to observe and correct tally mark formation. The worksheets also work well as follow-up practice after whole-class data collection activities, helping students transfer hands-on survey experience to paper-based recording. Many teachers assign these as homework to reinforce classroom lessons, asking families to conduct simple surveys at home about favorite foods or activities, extending the learning beyond school hours.