3.MD.B.3 Worksheets
Common Core State Standards 3.MD.B.3 Worksheets
Strand: Measurement and Data
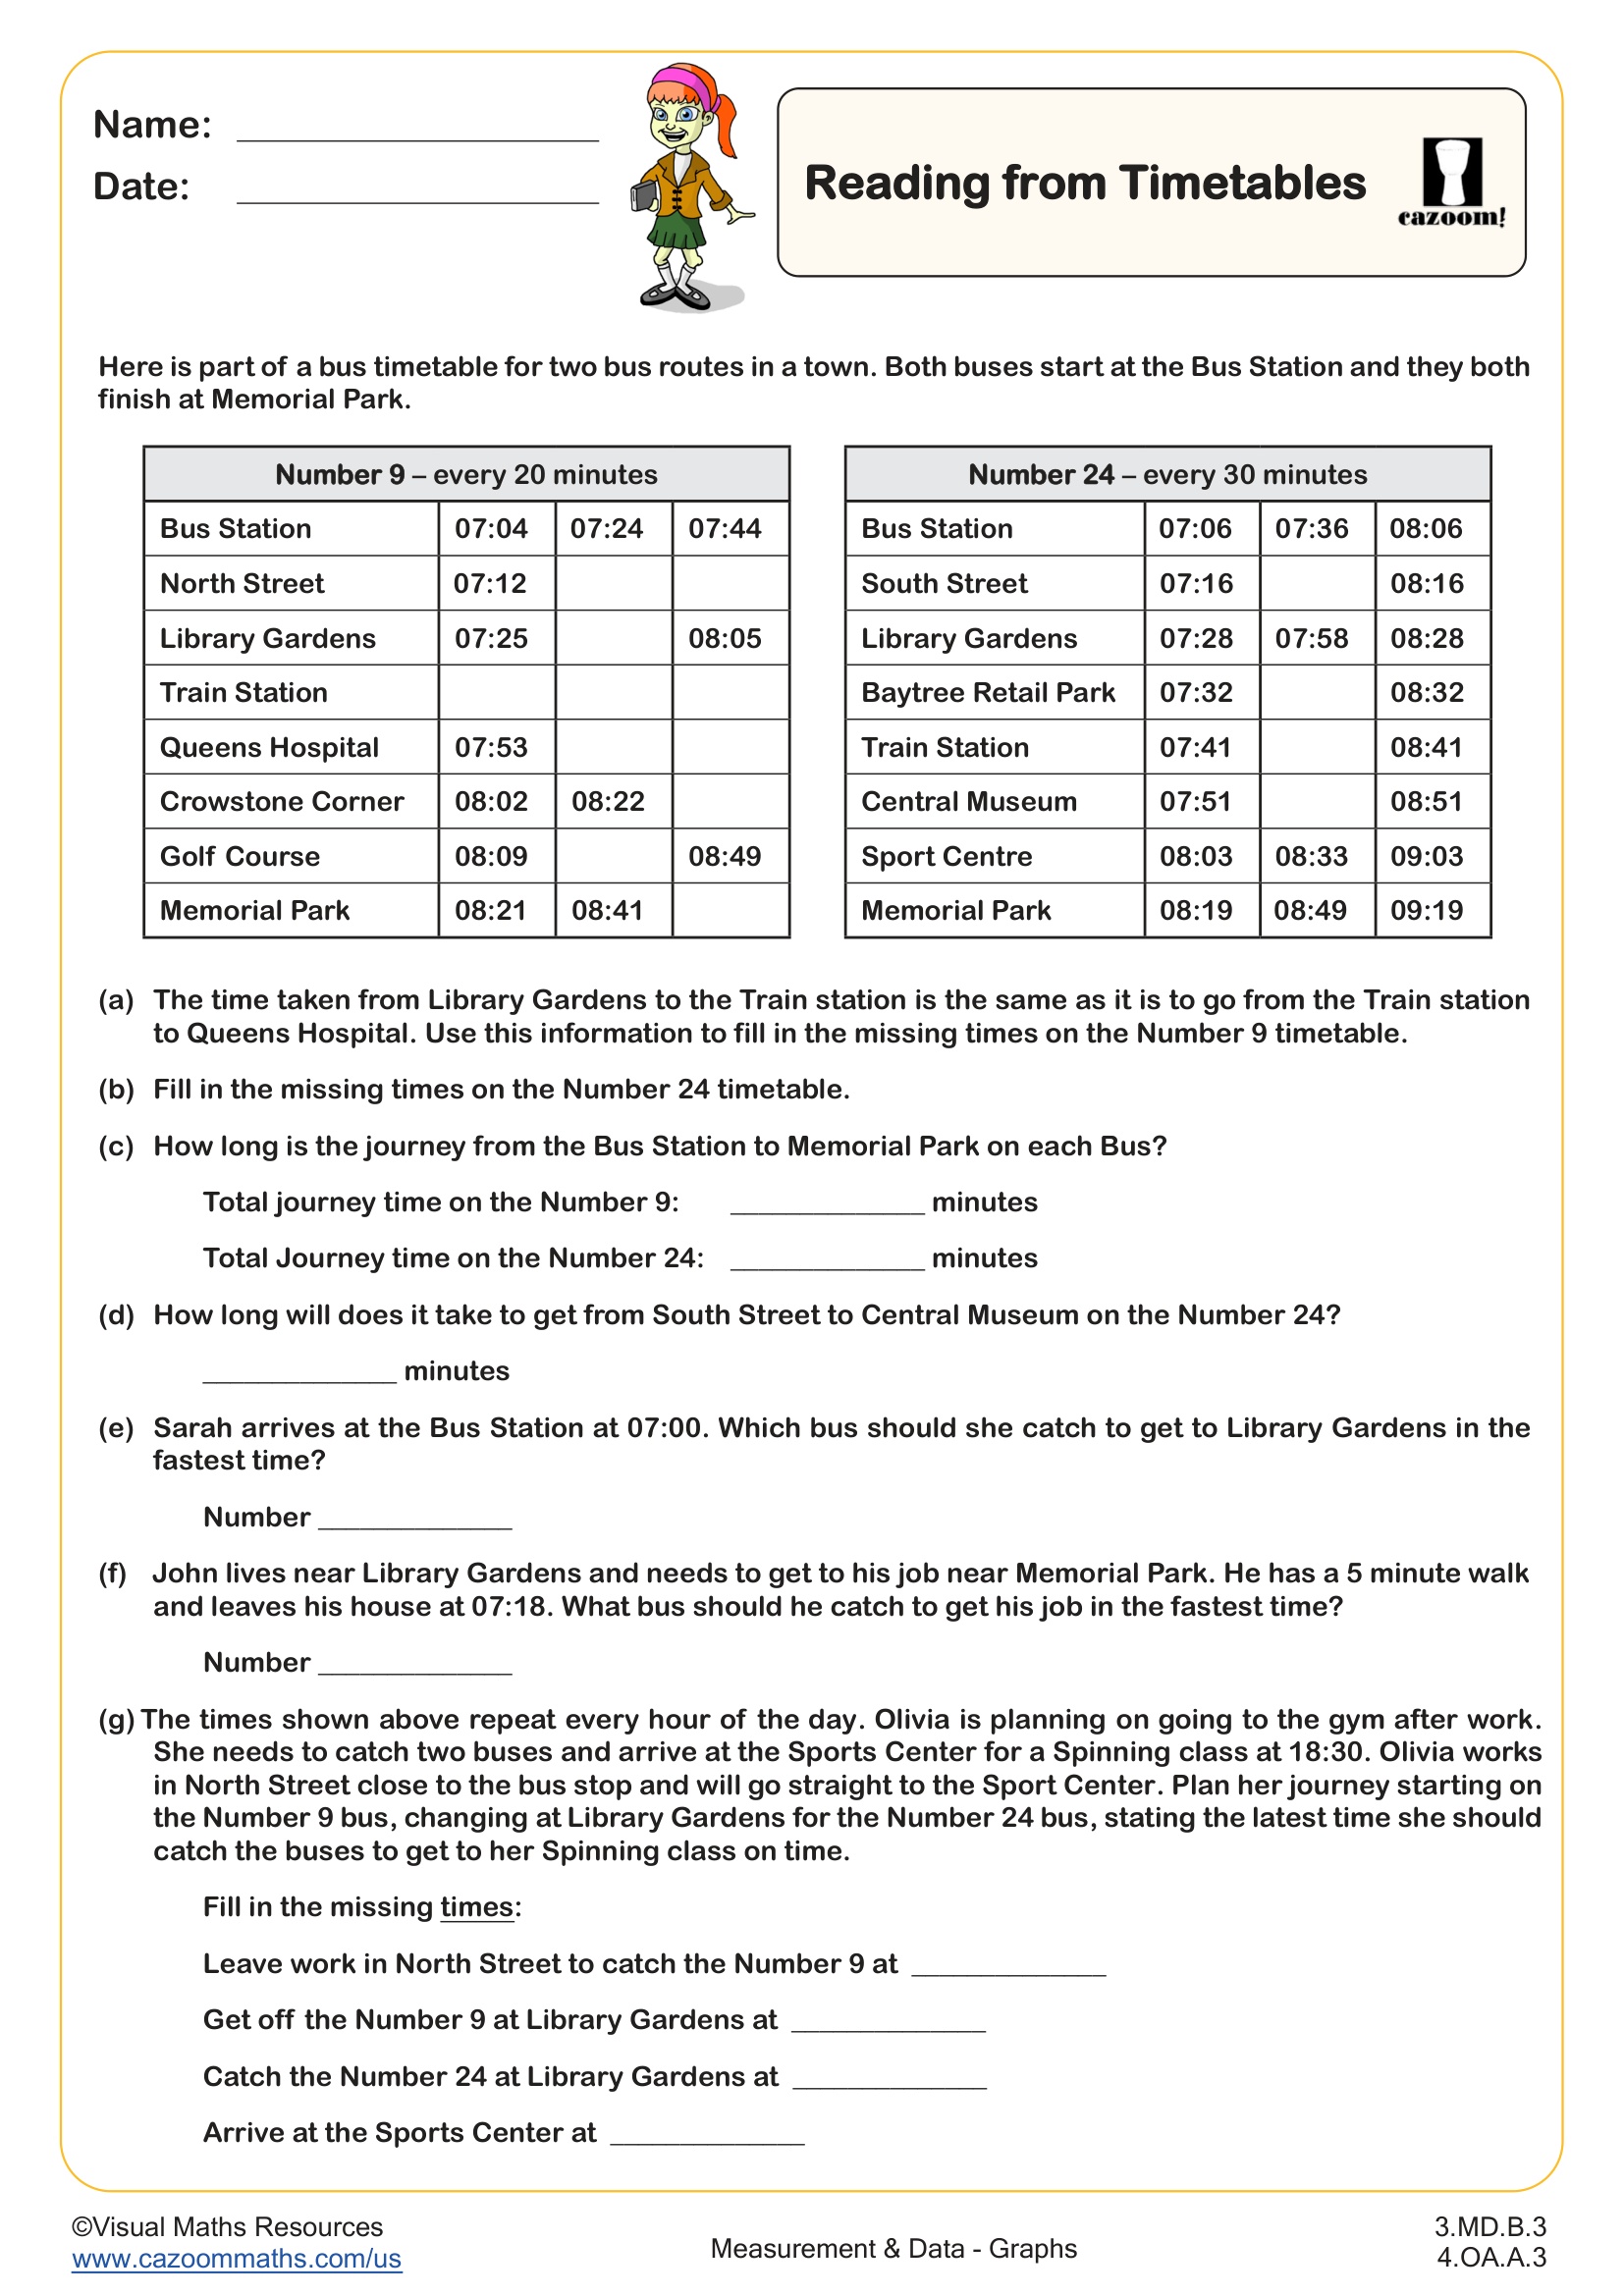
Objective: Represent and interpret data
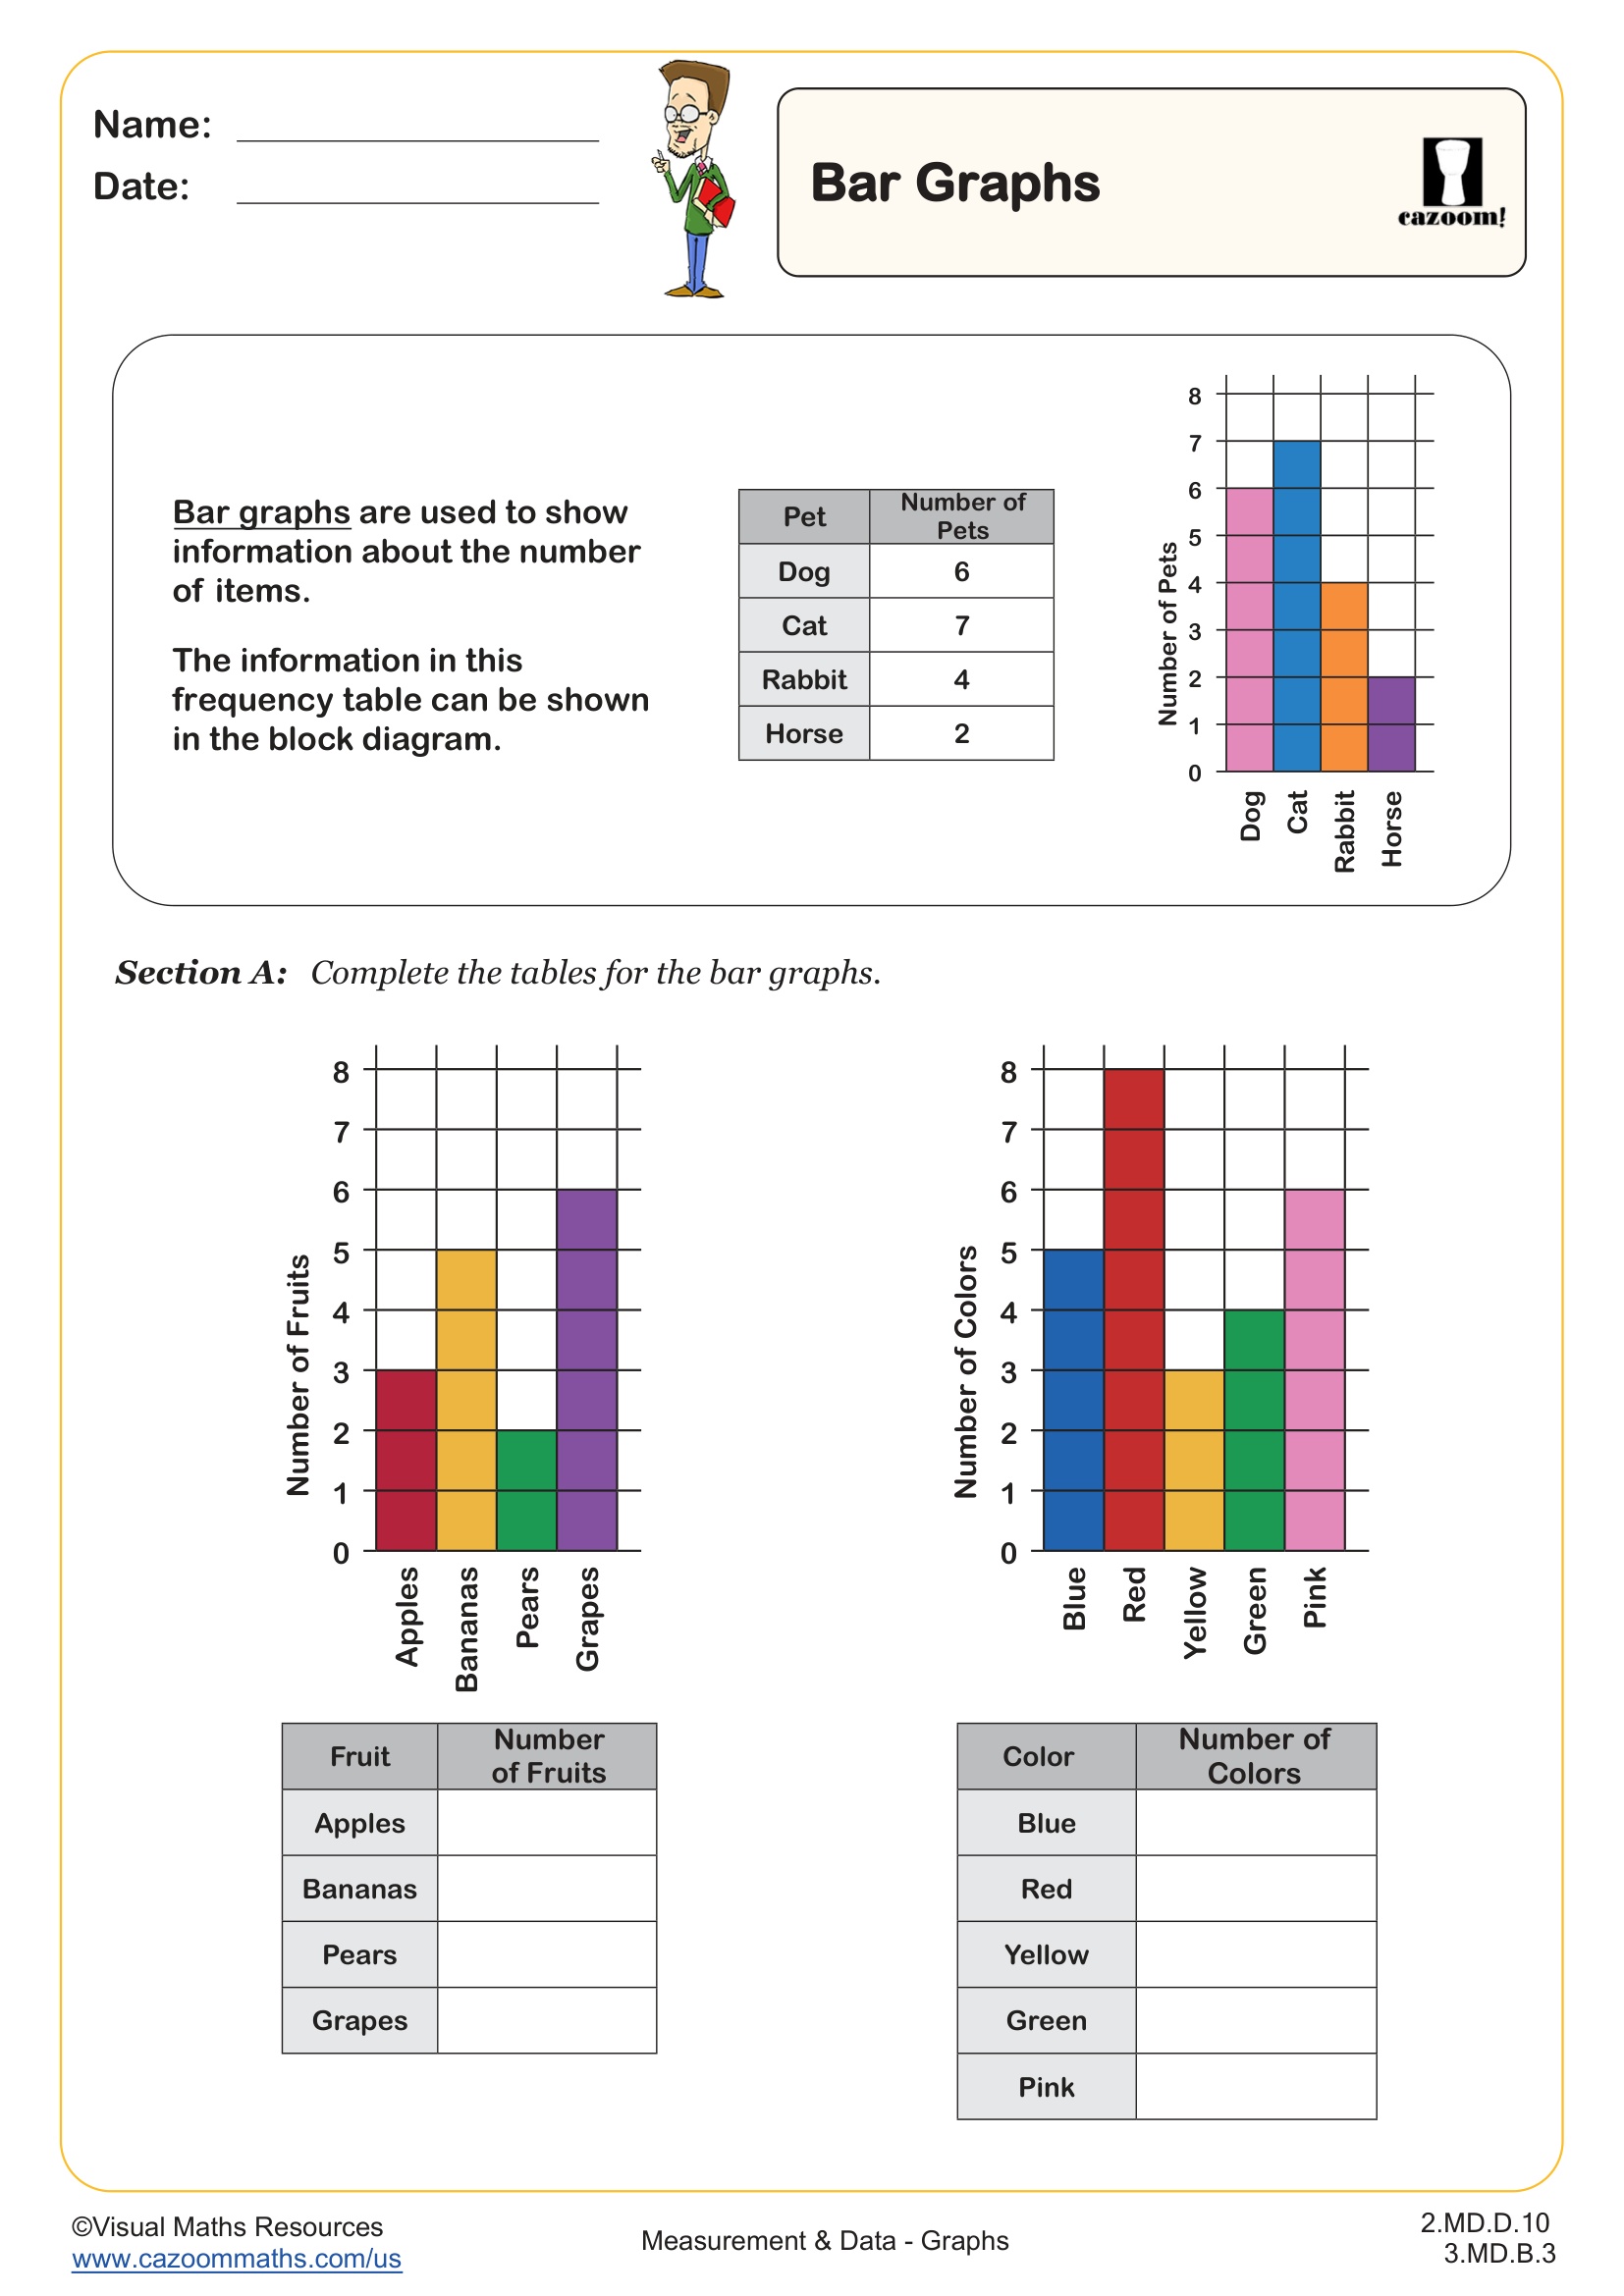
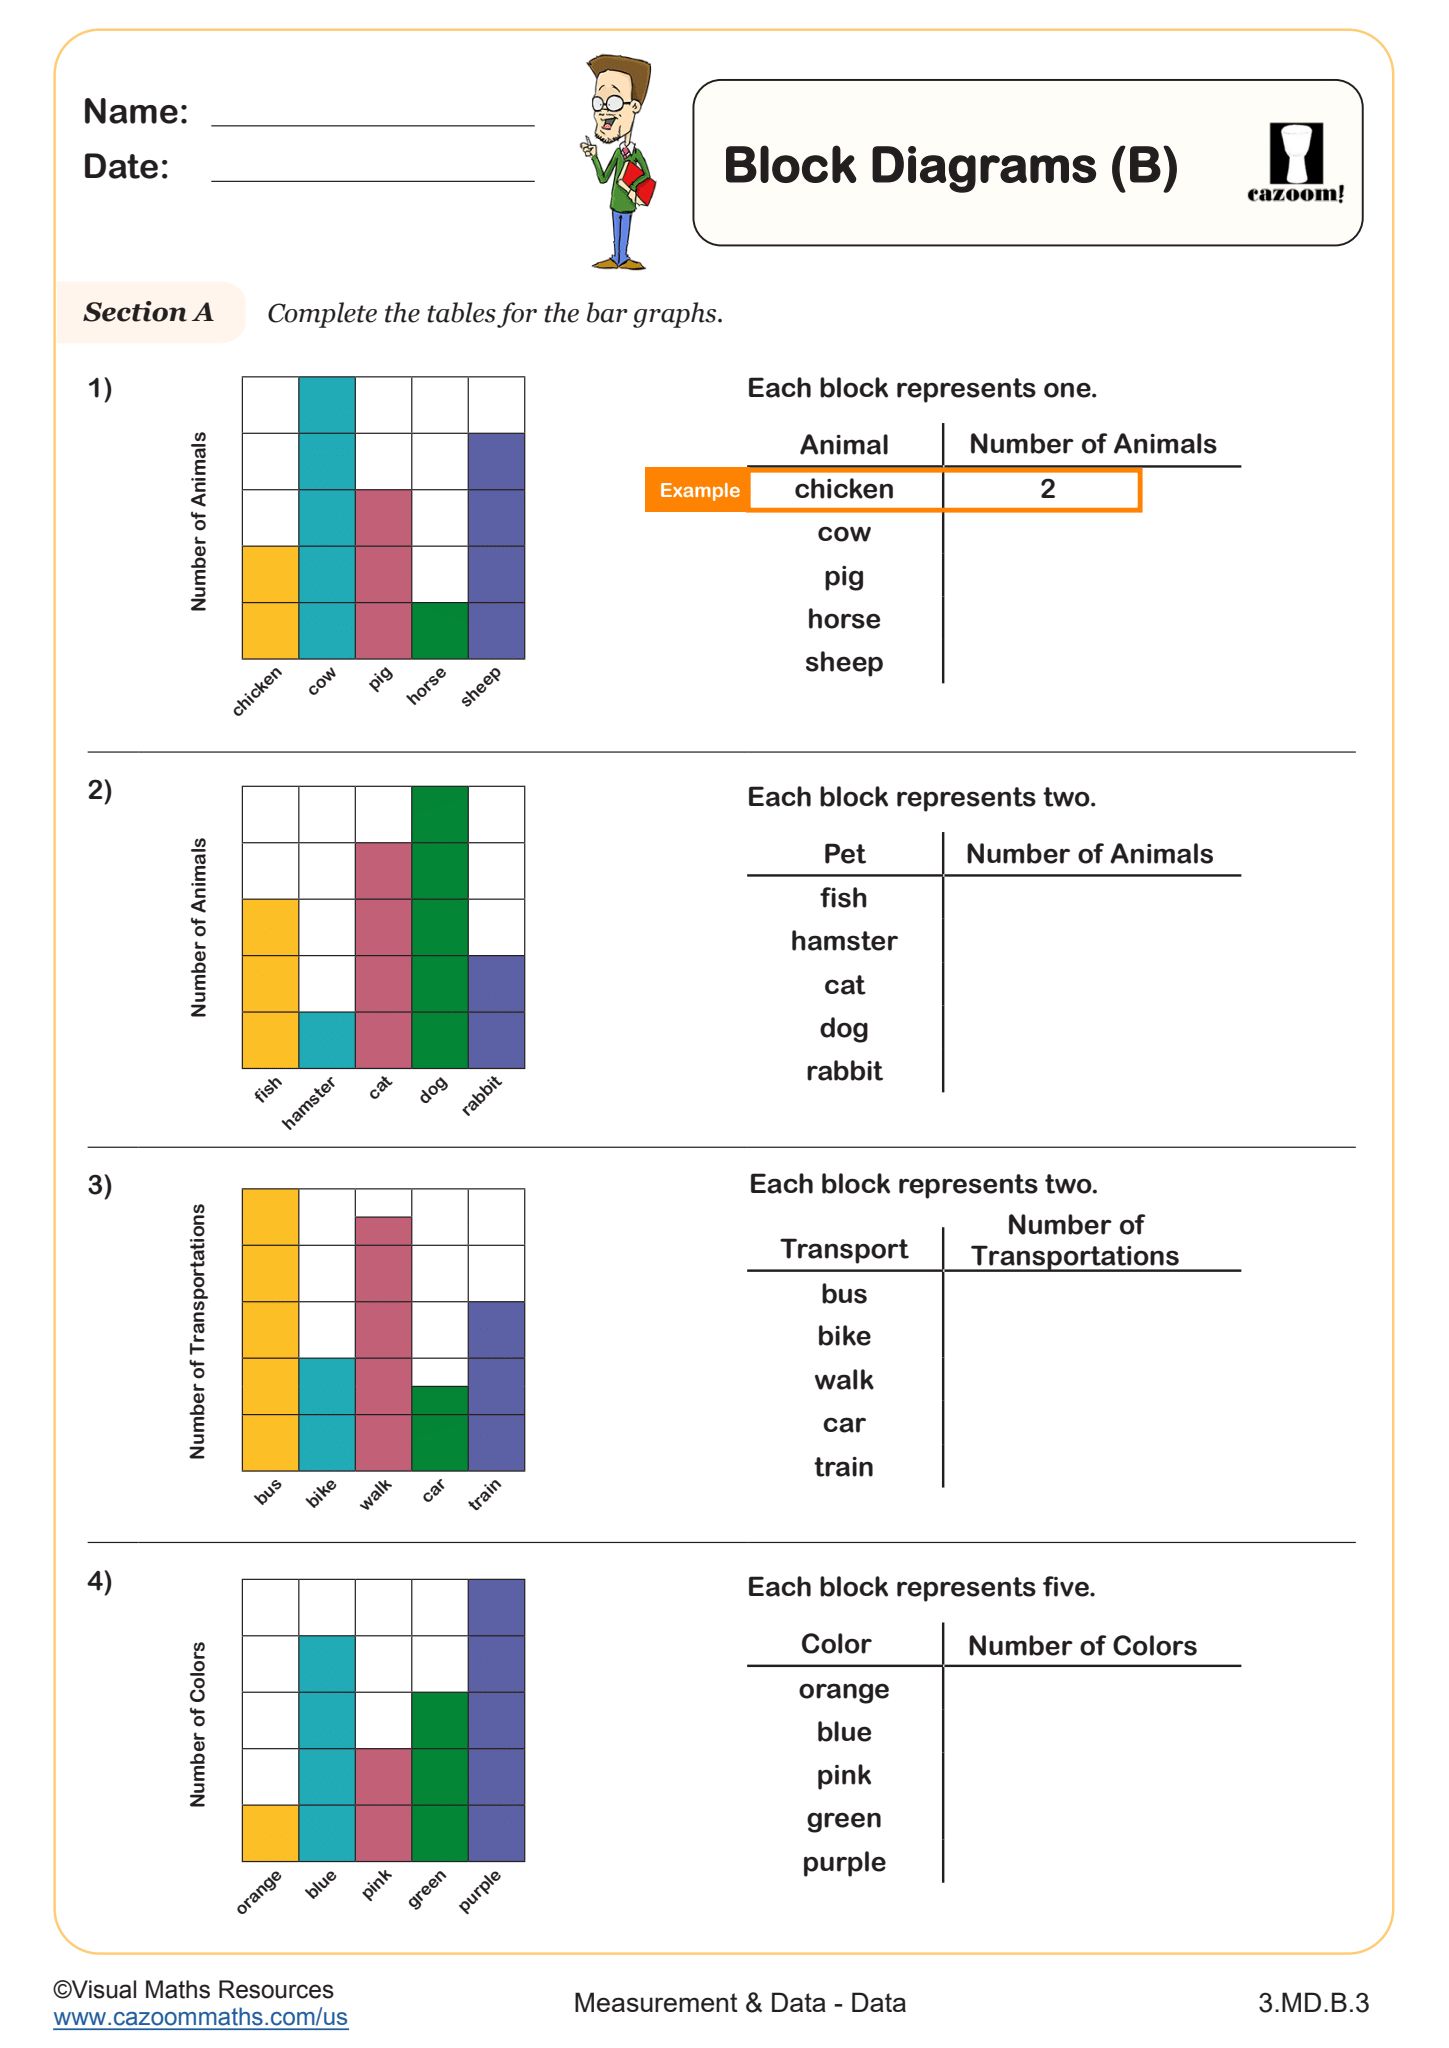
CCSS Description: Draw a scaled picture graph and a scaled bar graph to represent a data set with several categories. Solve one- nd two-step “how many more” and “how many less” problems using information presented in scaled bar graphs. For example, draw a bar graph in which each square in the bar graph might represent 5 pets.
Cazoom Math is a leading provider of Math Worksheets and used by over 50,000 teachers and parents around the world. Here you can find a set of math worksheets aligned to the common core standard 3.MD.B.3. These worksheets are perfect for learners to develop critical math skills.
You can click on the images below to find out more about each math worksheet, and download and print the resource.
We have a great range of resources for students in 3rd Grade. Check out our 3rd Grade Math Worksheets page for more details.
All worksheets are created by the team of experienced teachers at Cazoom Math.