3rd Grade Bar Charts and Line Graphs Worksheets
All worksheets are created by the team of experienced teachers at Cazoom Math.
What's the Difference Between Bar Charts and Line Graphs for Third Graders?
Bar charts display categorical data using separate bars to show different groups or items, such as favorite ice cream flavors or books read by different students. Line graphs connect points to show how data changes over time or along a continuous scale, like temperature throughout the day or plant growth over several weeks. Third graders typically work more with bar charts at this level, as they're easier to construct and interpret.
Students often try to use line graphs when bar charts are more appropriate, connecting points between categories that don't have a continuous relationship. Teachers frequently need to emphasize that line graphs work best when the horizontal axis represents something that flows continuously, like time or temperature, rather than distinct categories. Understanding this distinction helps students choose the right representation for their data.
What Should 3rd Graders Know About Data Representation?
Third grade students should read and interpret scaled bar charts and pictographs, understanding how to find information from the graph and compare quantities. They should identify the largest and smallest values, calculate differences between categories, and answer questions about the data shown. According to Common Core standard 3.MD.B.3, students represent and interpret data using bar graphs with scales in intervals greater than one.
This builds directly on second grade work with simple picture graphs and bar graphs using single-unit scales. The progression prepares students for fourth grade line plots and more complex data analysis. Many teachers find that hands-on data collection activities, like surveying classmates about their preferences, help students understand why different graph types matter and how to select appropriate scales for their data.
How Do Students Learn to Choose the Right Scale for a Bar Chart?
Choosing an appropriate scale means selecting intervals that fit all the data on the page while making differences between values easy to see. Students learn to look at their largest number and determine whether counting by ones, twos, fives, or tens makes sense. If the data ranges from 2 to 45, counting by ones creates too many lines, while counting by fives or tens keeps the chart readable and manageable.
This skill connects directly to real-world applications in fields like marketing, where professionals create charts showing sales data, and environmental science, where researchers display temperature or rainfall measurements. Scientists collecting data about animal populations or plant growth must choose scales that clearly communicate their findings. Understanding scale intervals helps students become better consumers of information when they encounter graphs in news articles, advertisements, and scientific reports.
How Can Teachers Use These Bar Chart and Line Graph Worksheets?
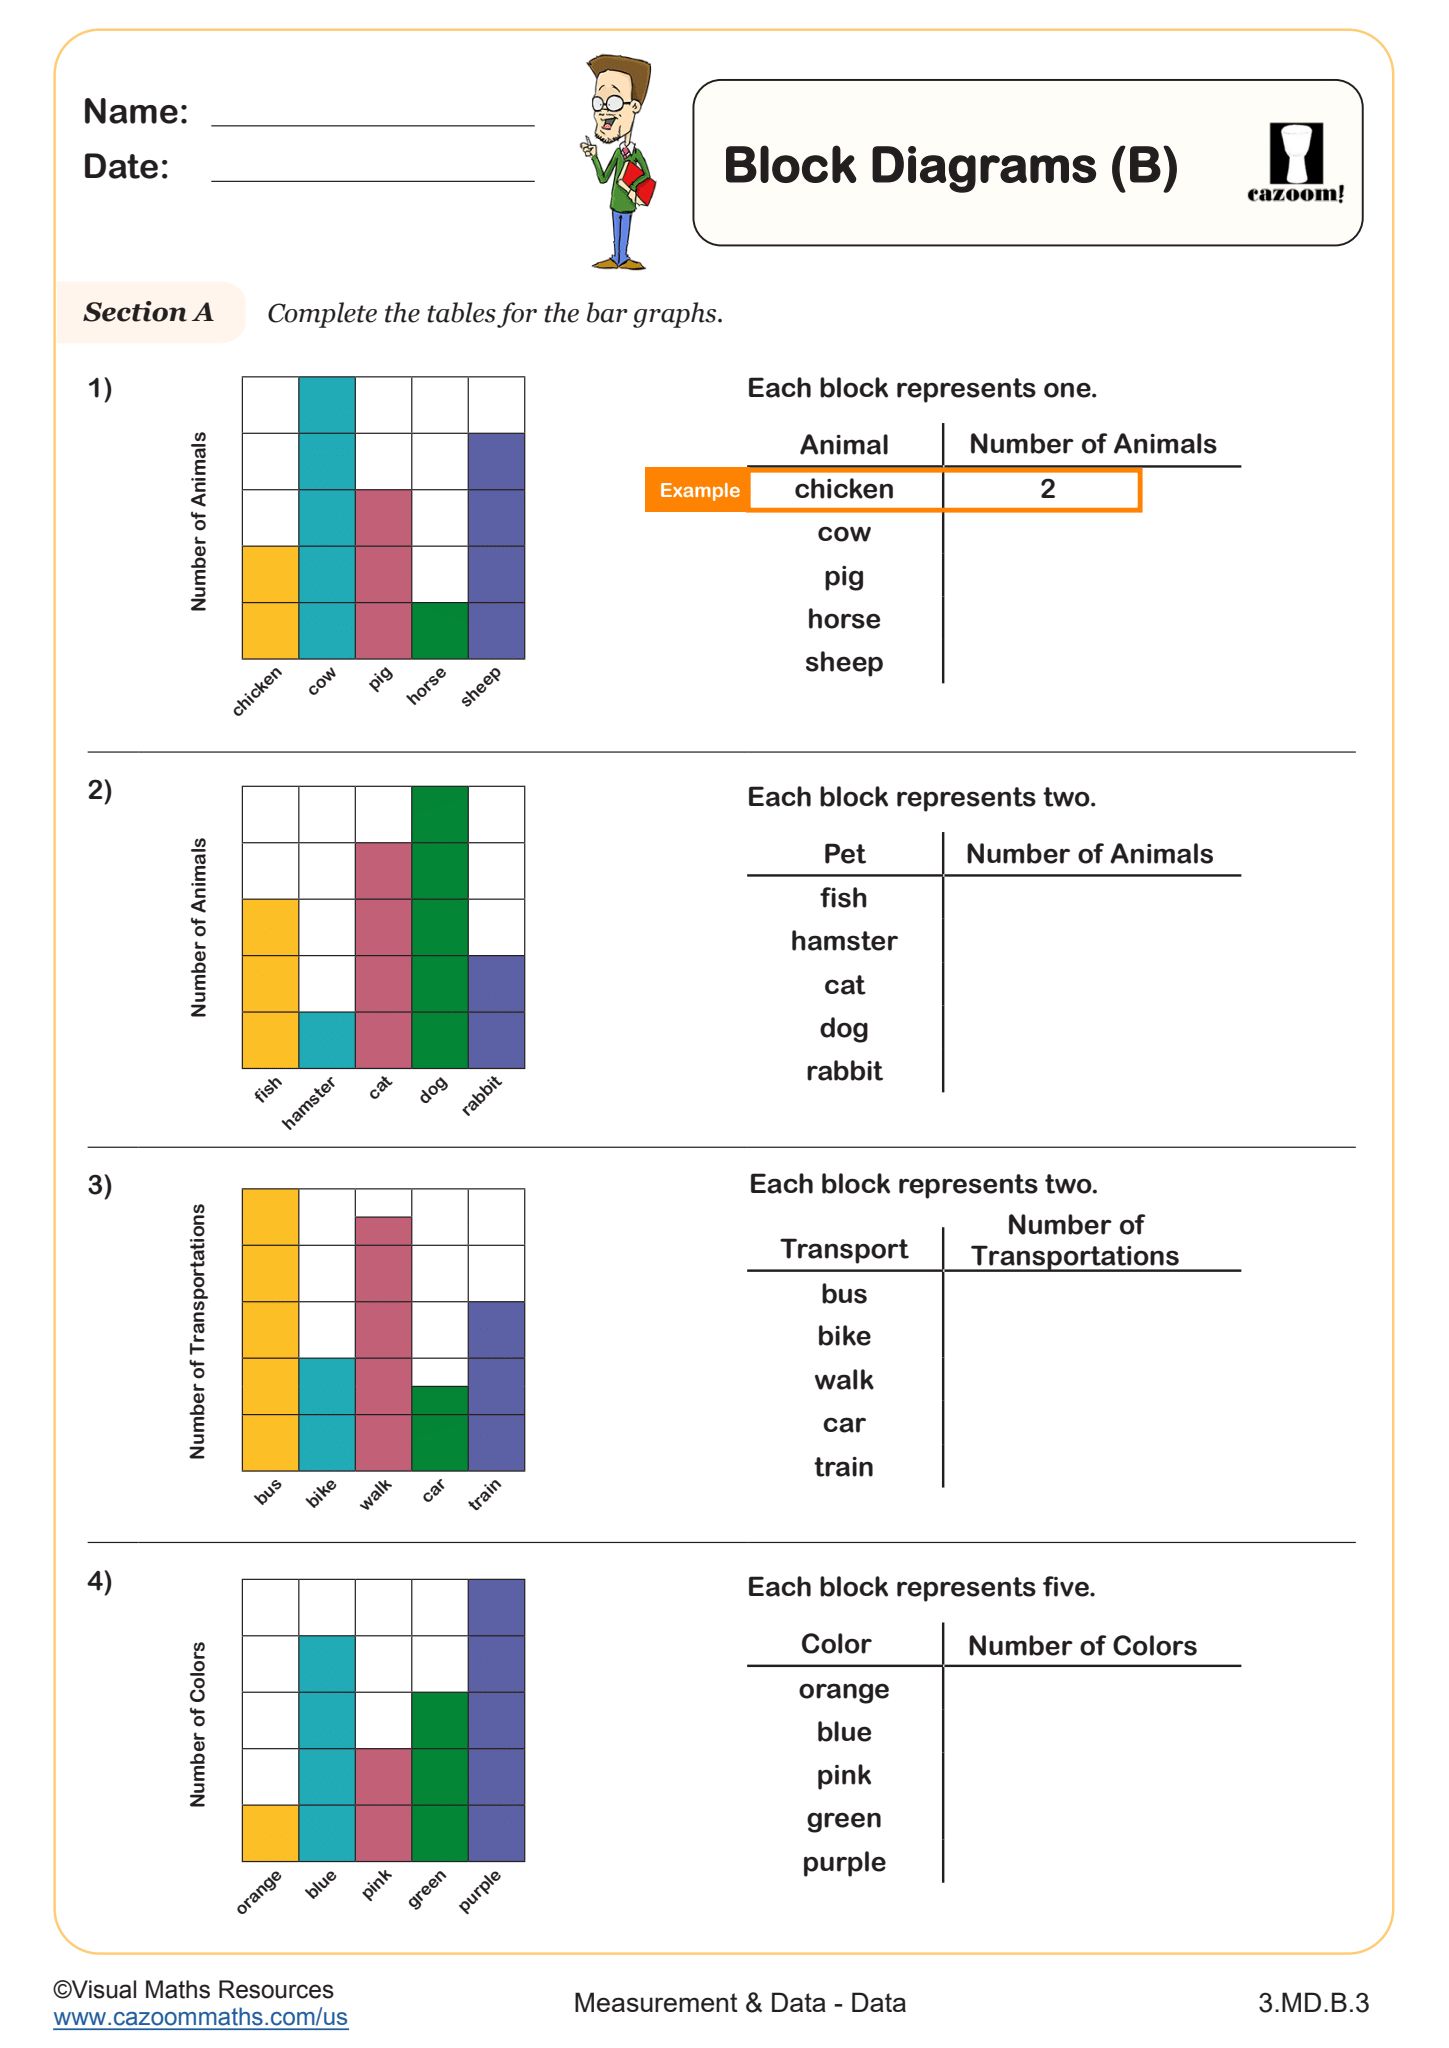
The worksheets provide structured practice in reading graphs, extracting information, and answering questions about displayed data. Block diagrams offer visual representations that bridge concrete manipulatives and abstract graphs, helping students see how individual units combine to form larger data sets. The answer keys allow teachers to quickly identify which aspects of graph interpretation students grasp and which require additional instruction.
These worksheets work well as independent practice after direct instruction on data representation, as homework to reinforce classroom learning, or as intervention materials for students who need extra support with reading scales. Teachers often use them during math centers or small group instruction, pairing students to discuss their reasoning about what the graphs show. The consistent format helps struggling learners build confidence with data interpretation while allowing advanced students to work through problems independently.