6.SP.B.4 Worksheets
Common Core State Standards 6.SP.B.4 Worksheets
Strand: Statistics and Probability
Objective: Summarize and describe distributions.
CCSS Description: Display numerical data in plots on a number line, including dot plots, histograms, and box plots.
Cazoom Math is a leading provider of Math Worksheets and used by over 50,000 teachers and parents around the world. Here you can find a set of math worksheets aligned to the common core standard 6.SP.B.4. These worksheets are perfect for learners to develop critical math skills.
You can click on the images below to find out more about each math worksheet, and download and print the resource.
We have a great range of resources for students in 6th Grade. Check out our 6th Grade Math Worksheets page for more details.
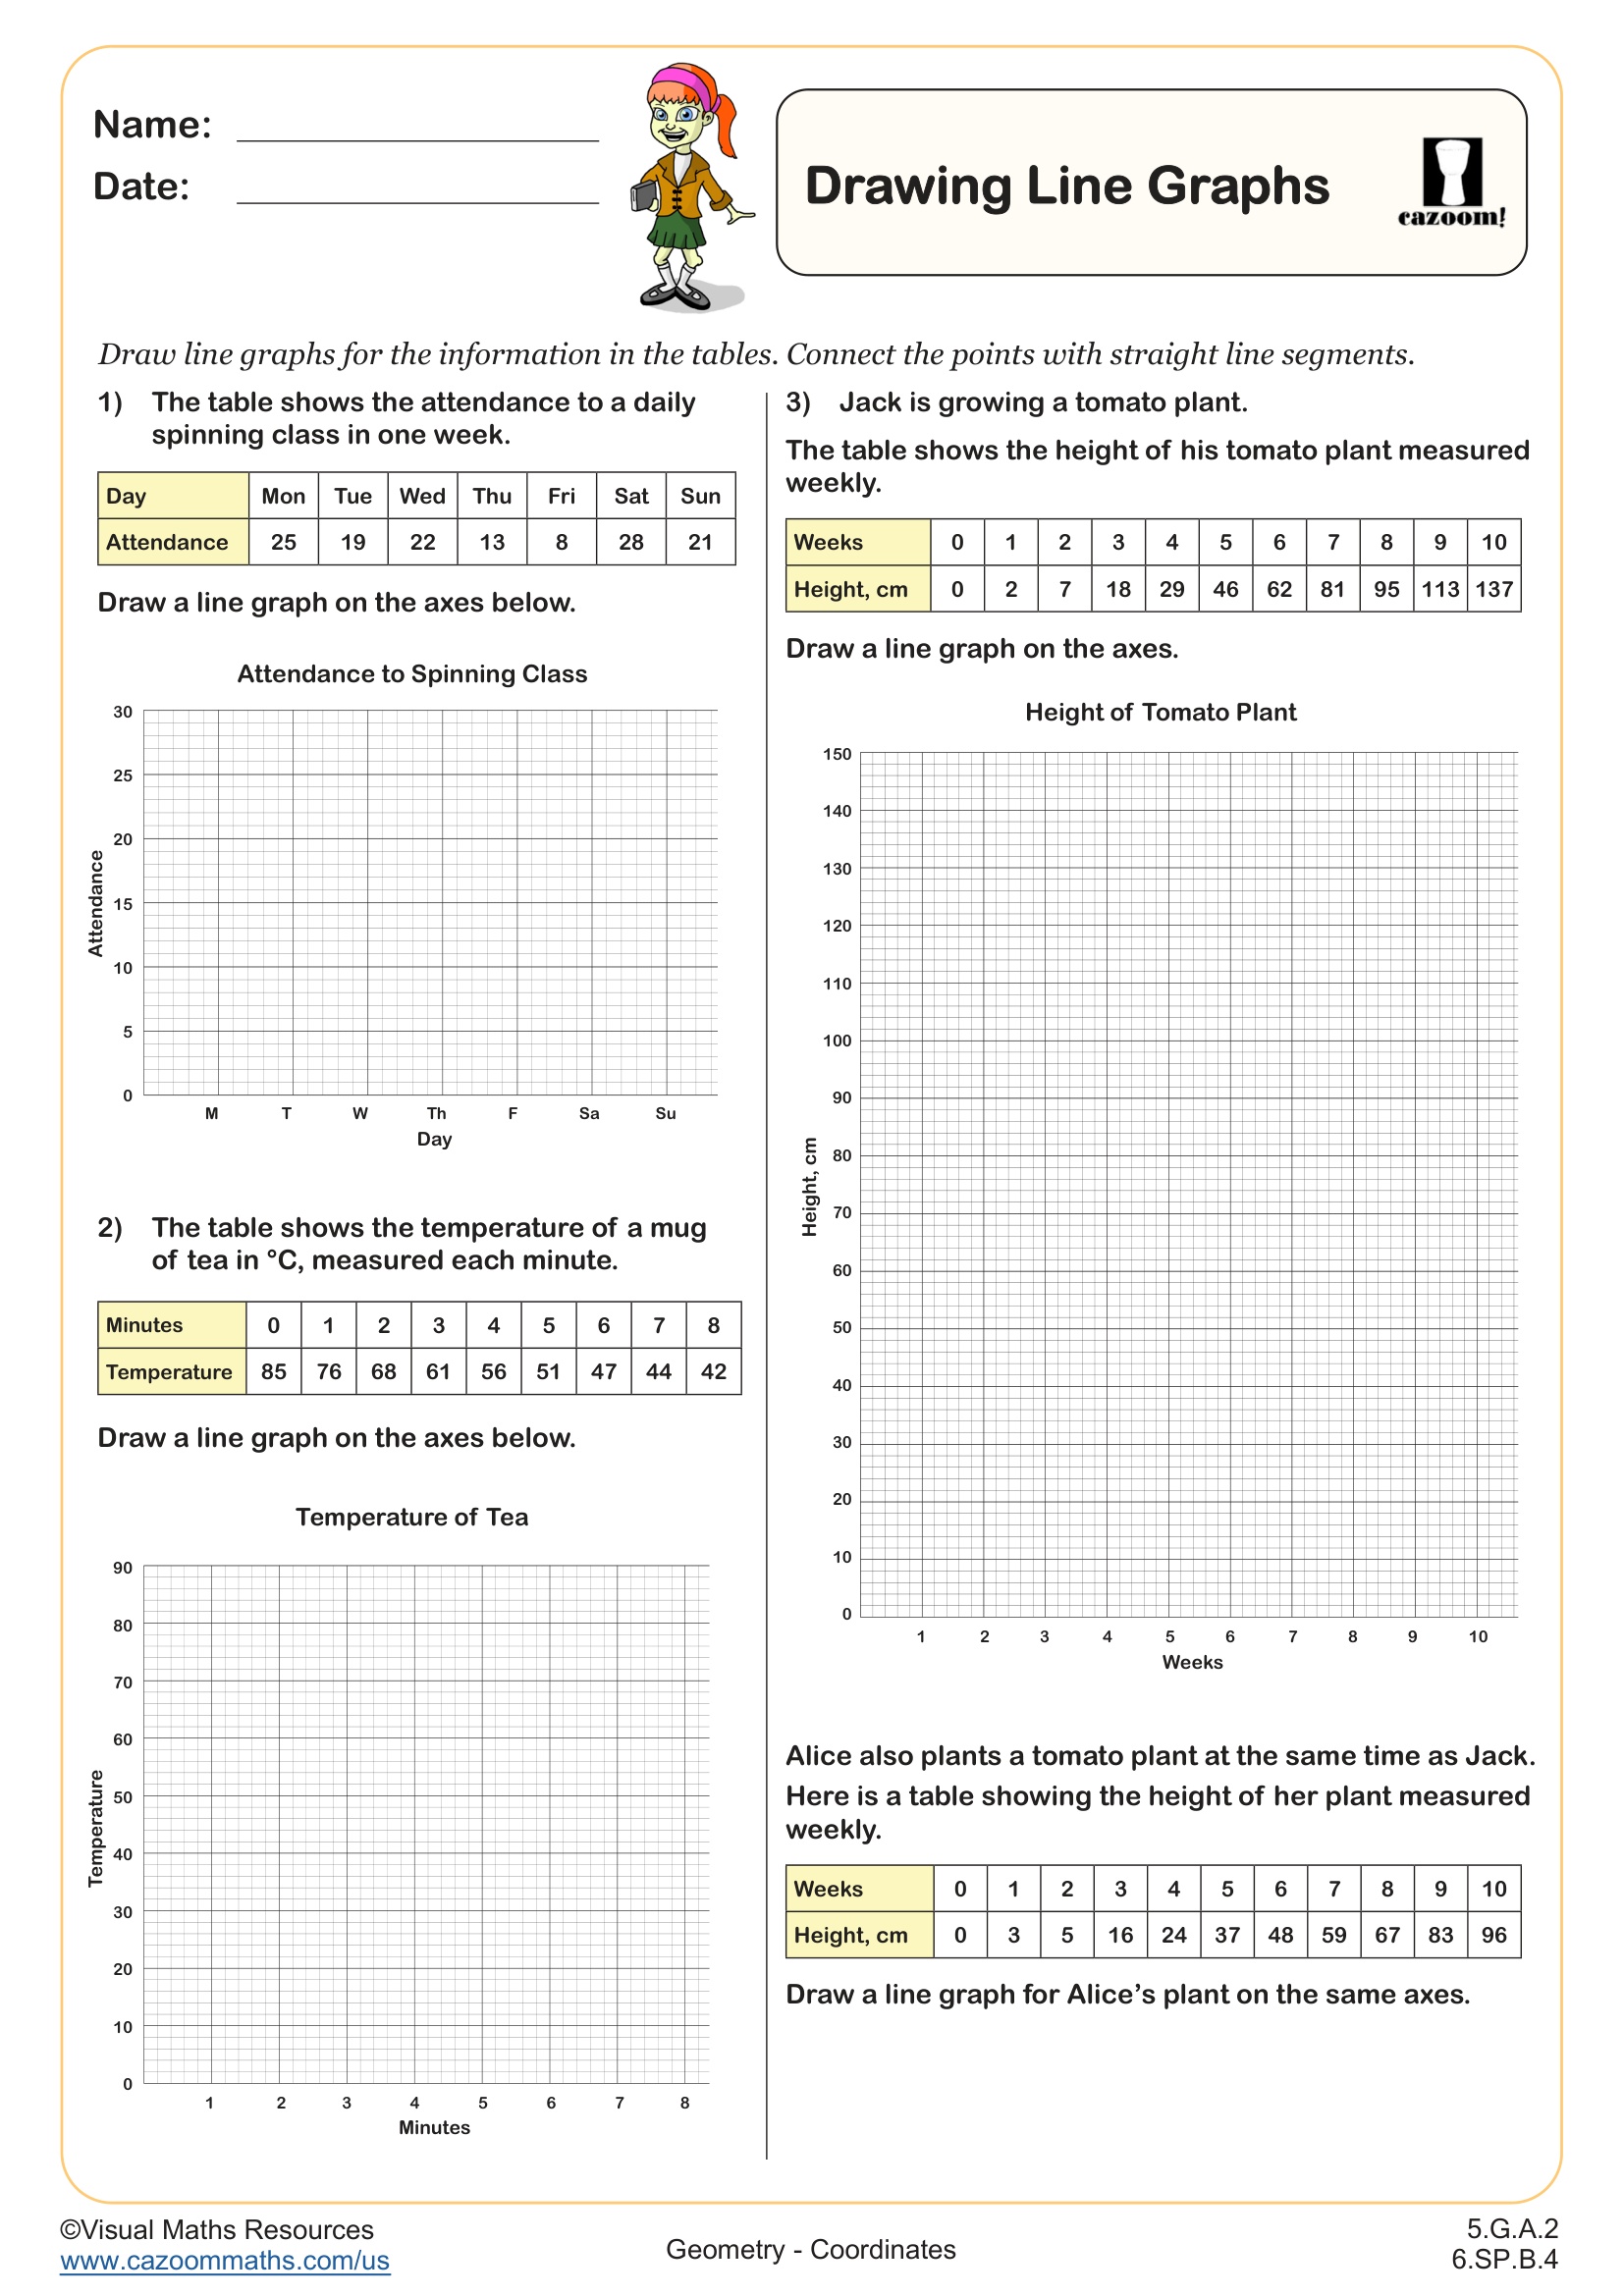
Drawing Line Graphs
Grades: 5th Grade, 6th Grade
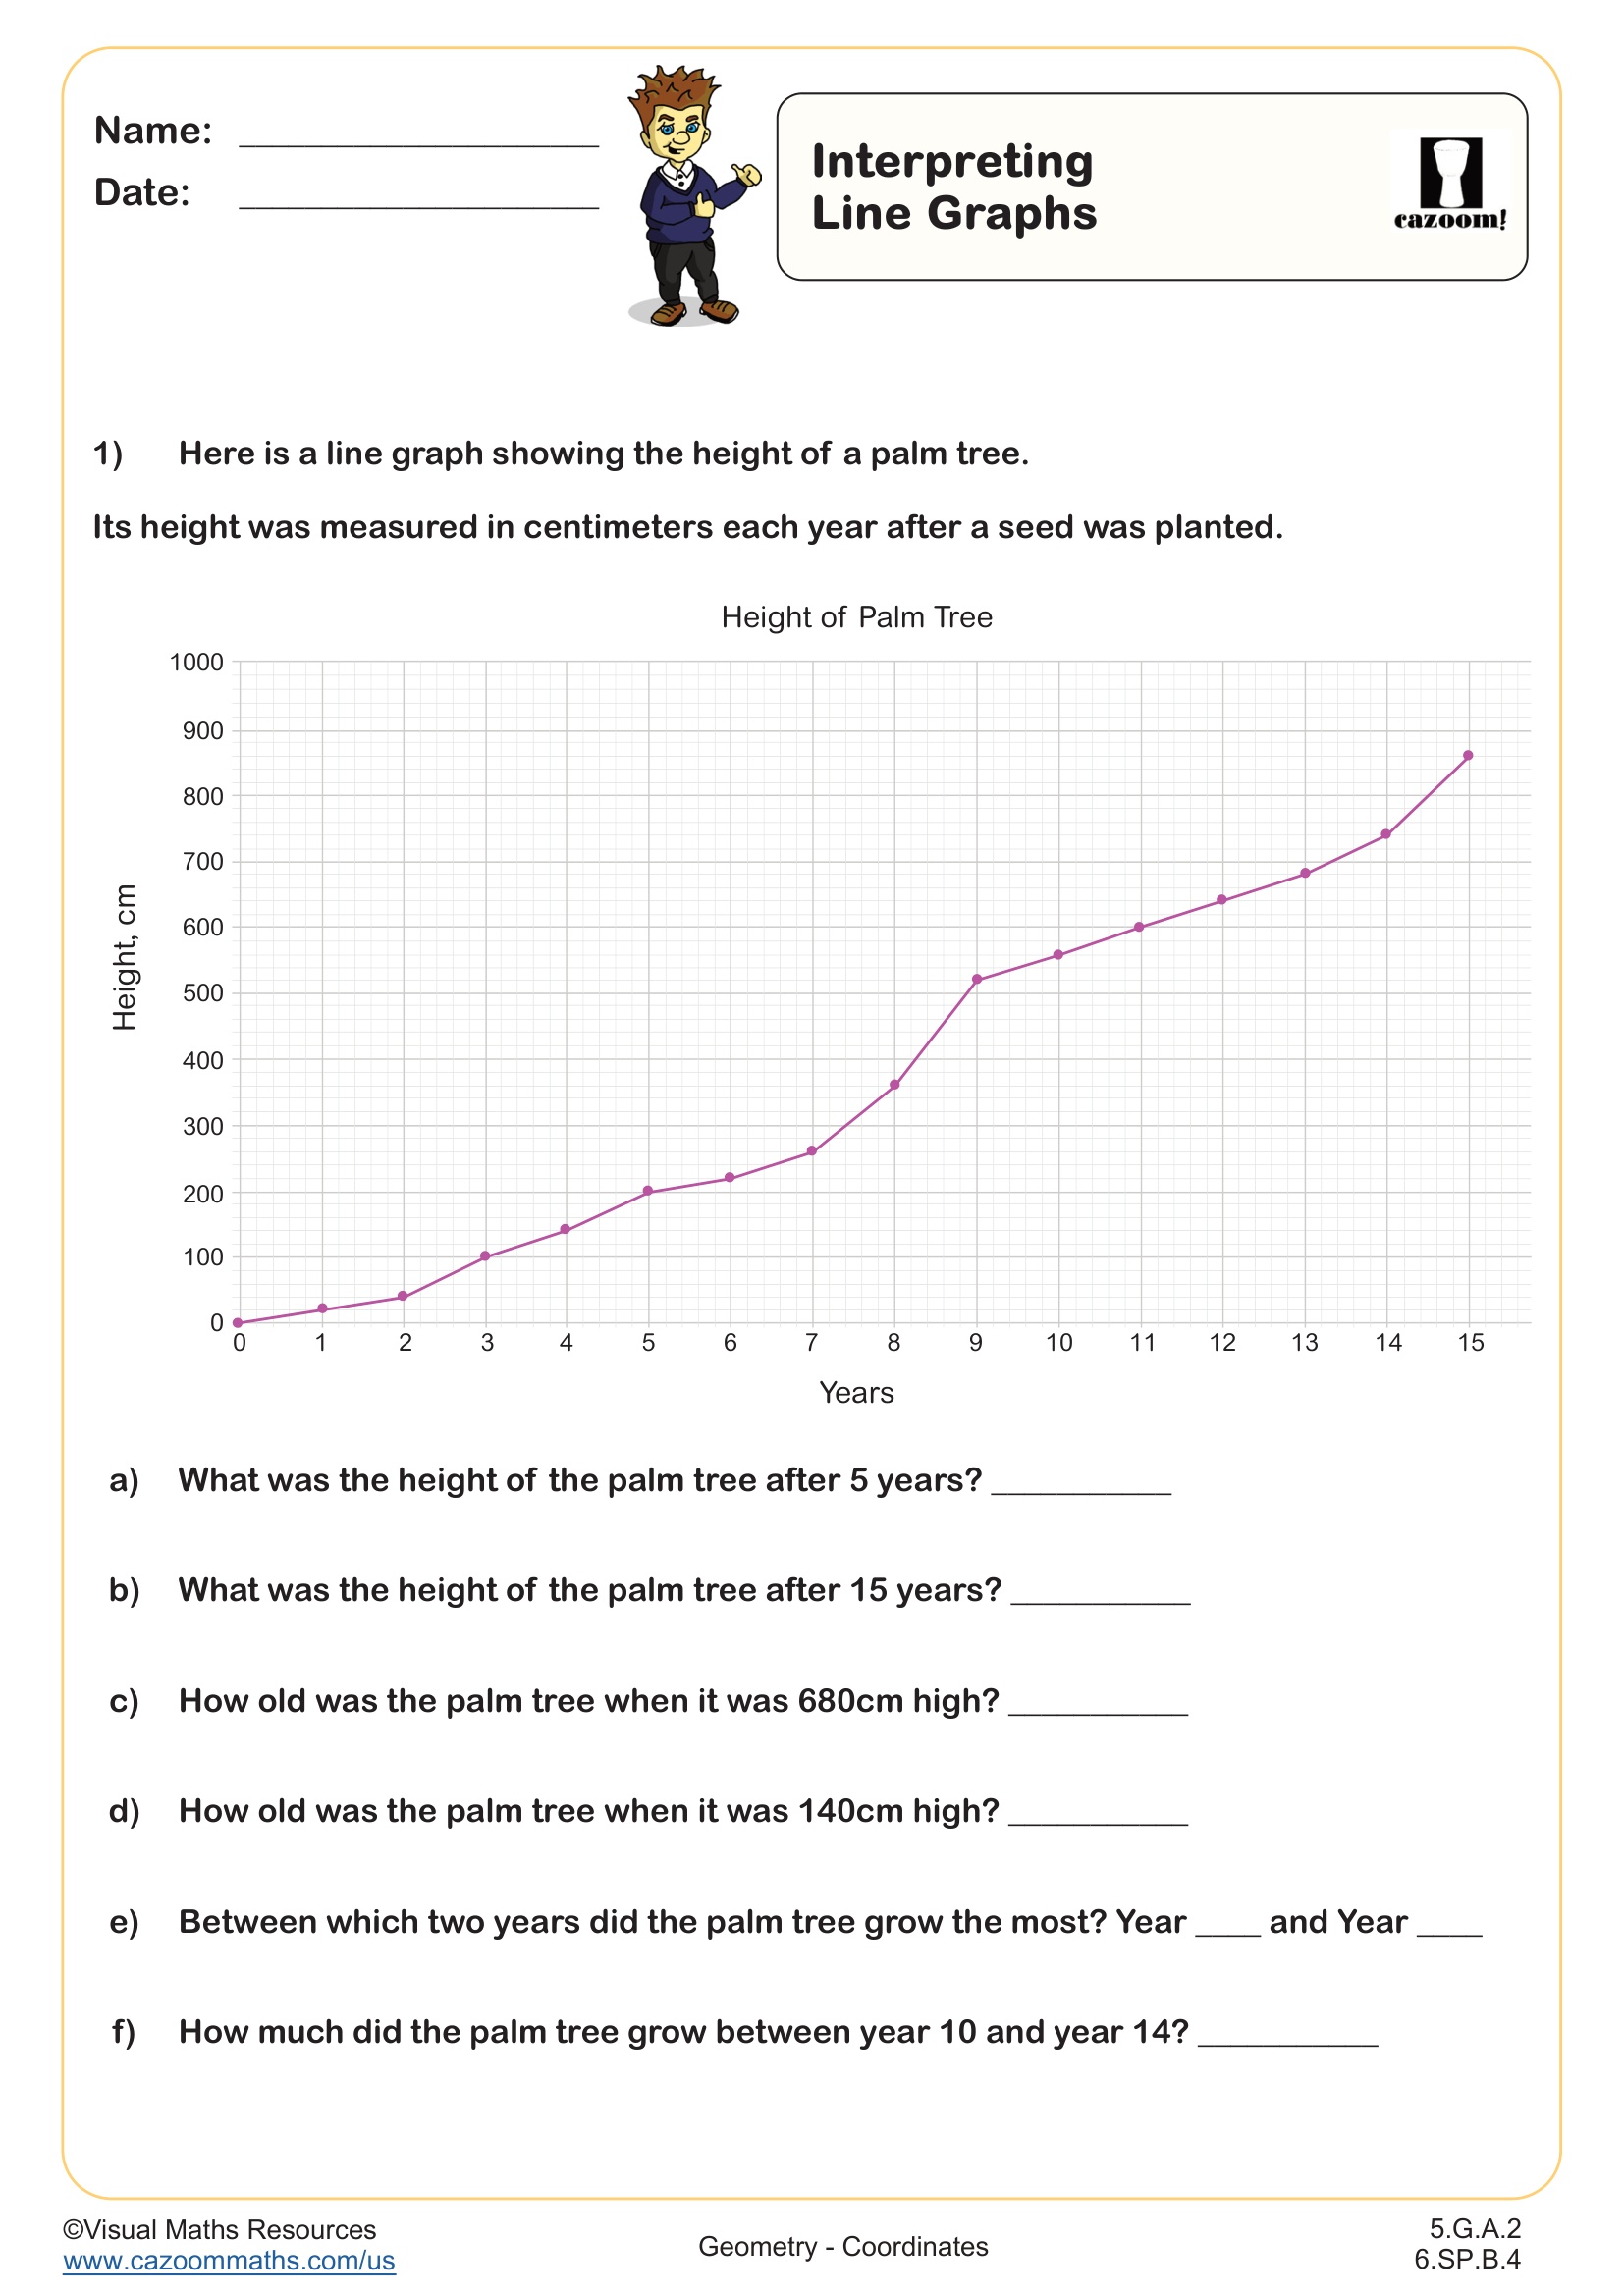
Interpreting Line Graphs
Grades: 5th Grade, 6th Grade
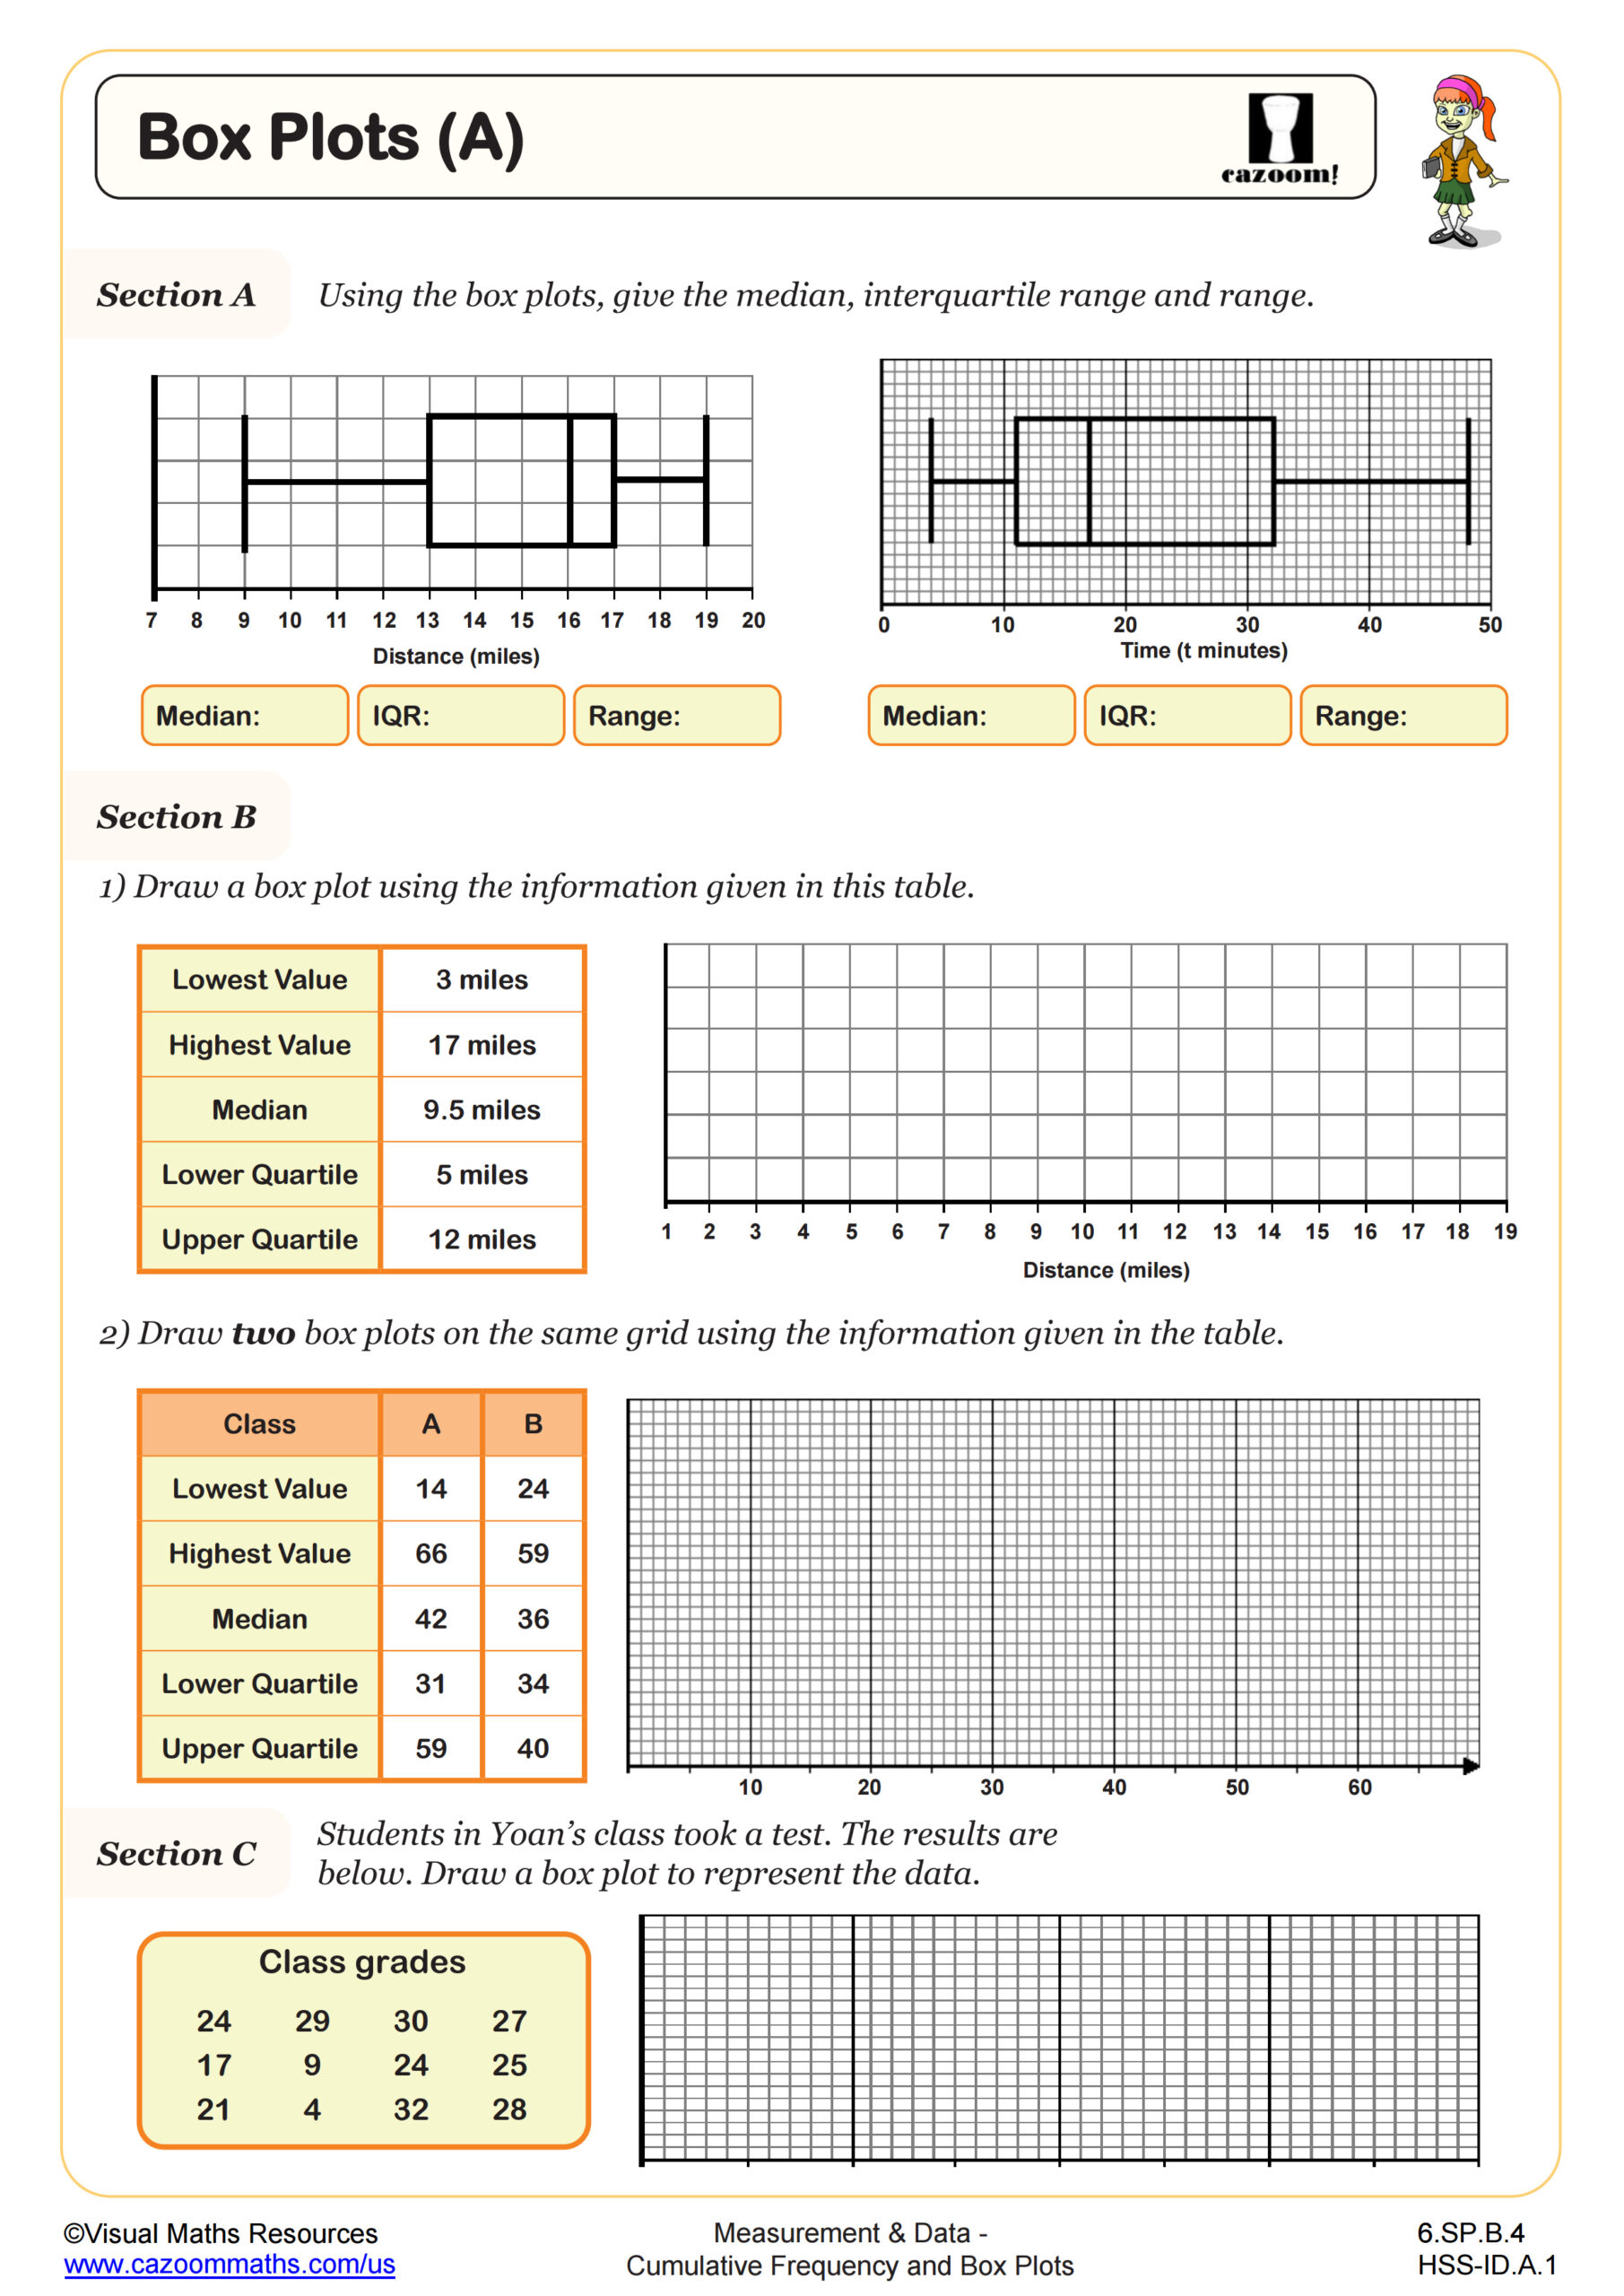
Box Plots (A)
Grades: 6th Grade, Algebra I
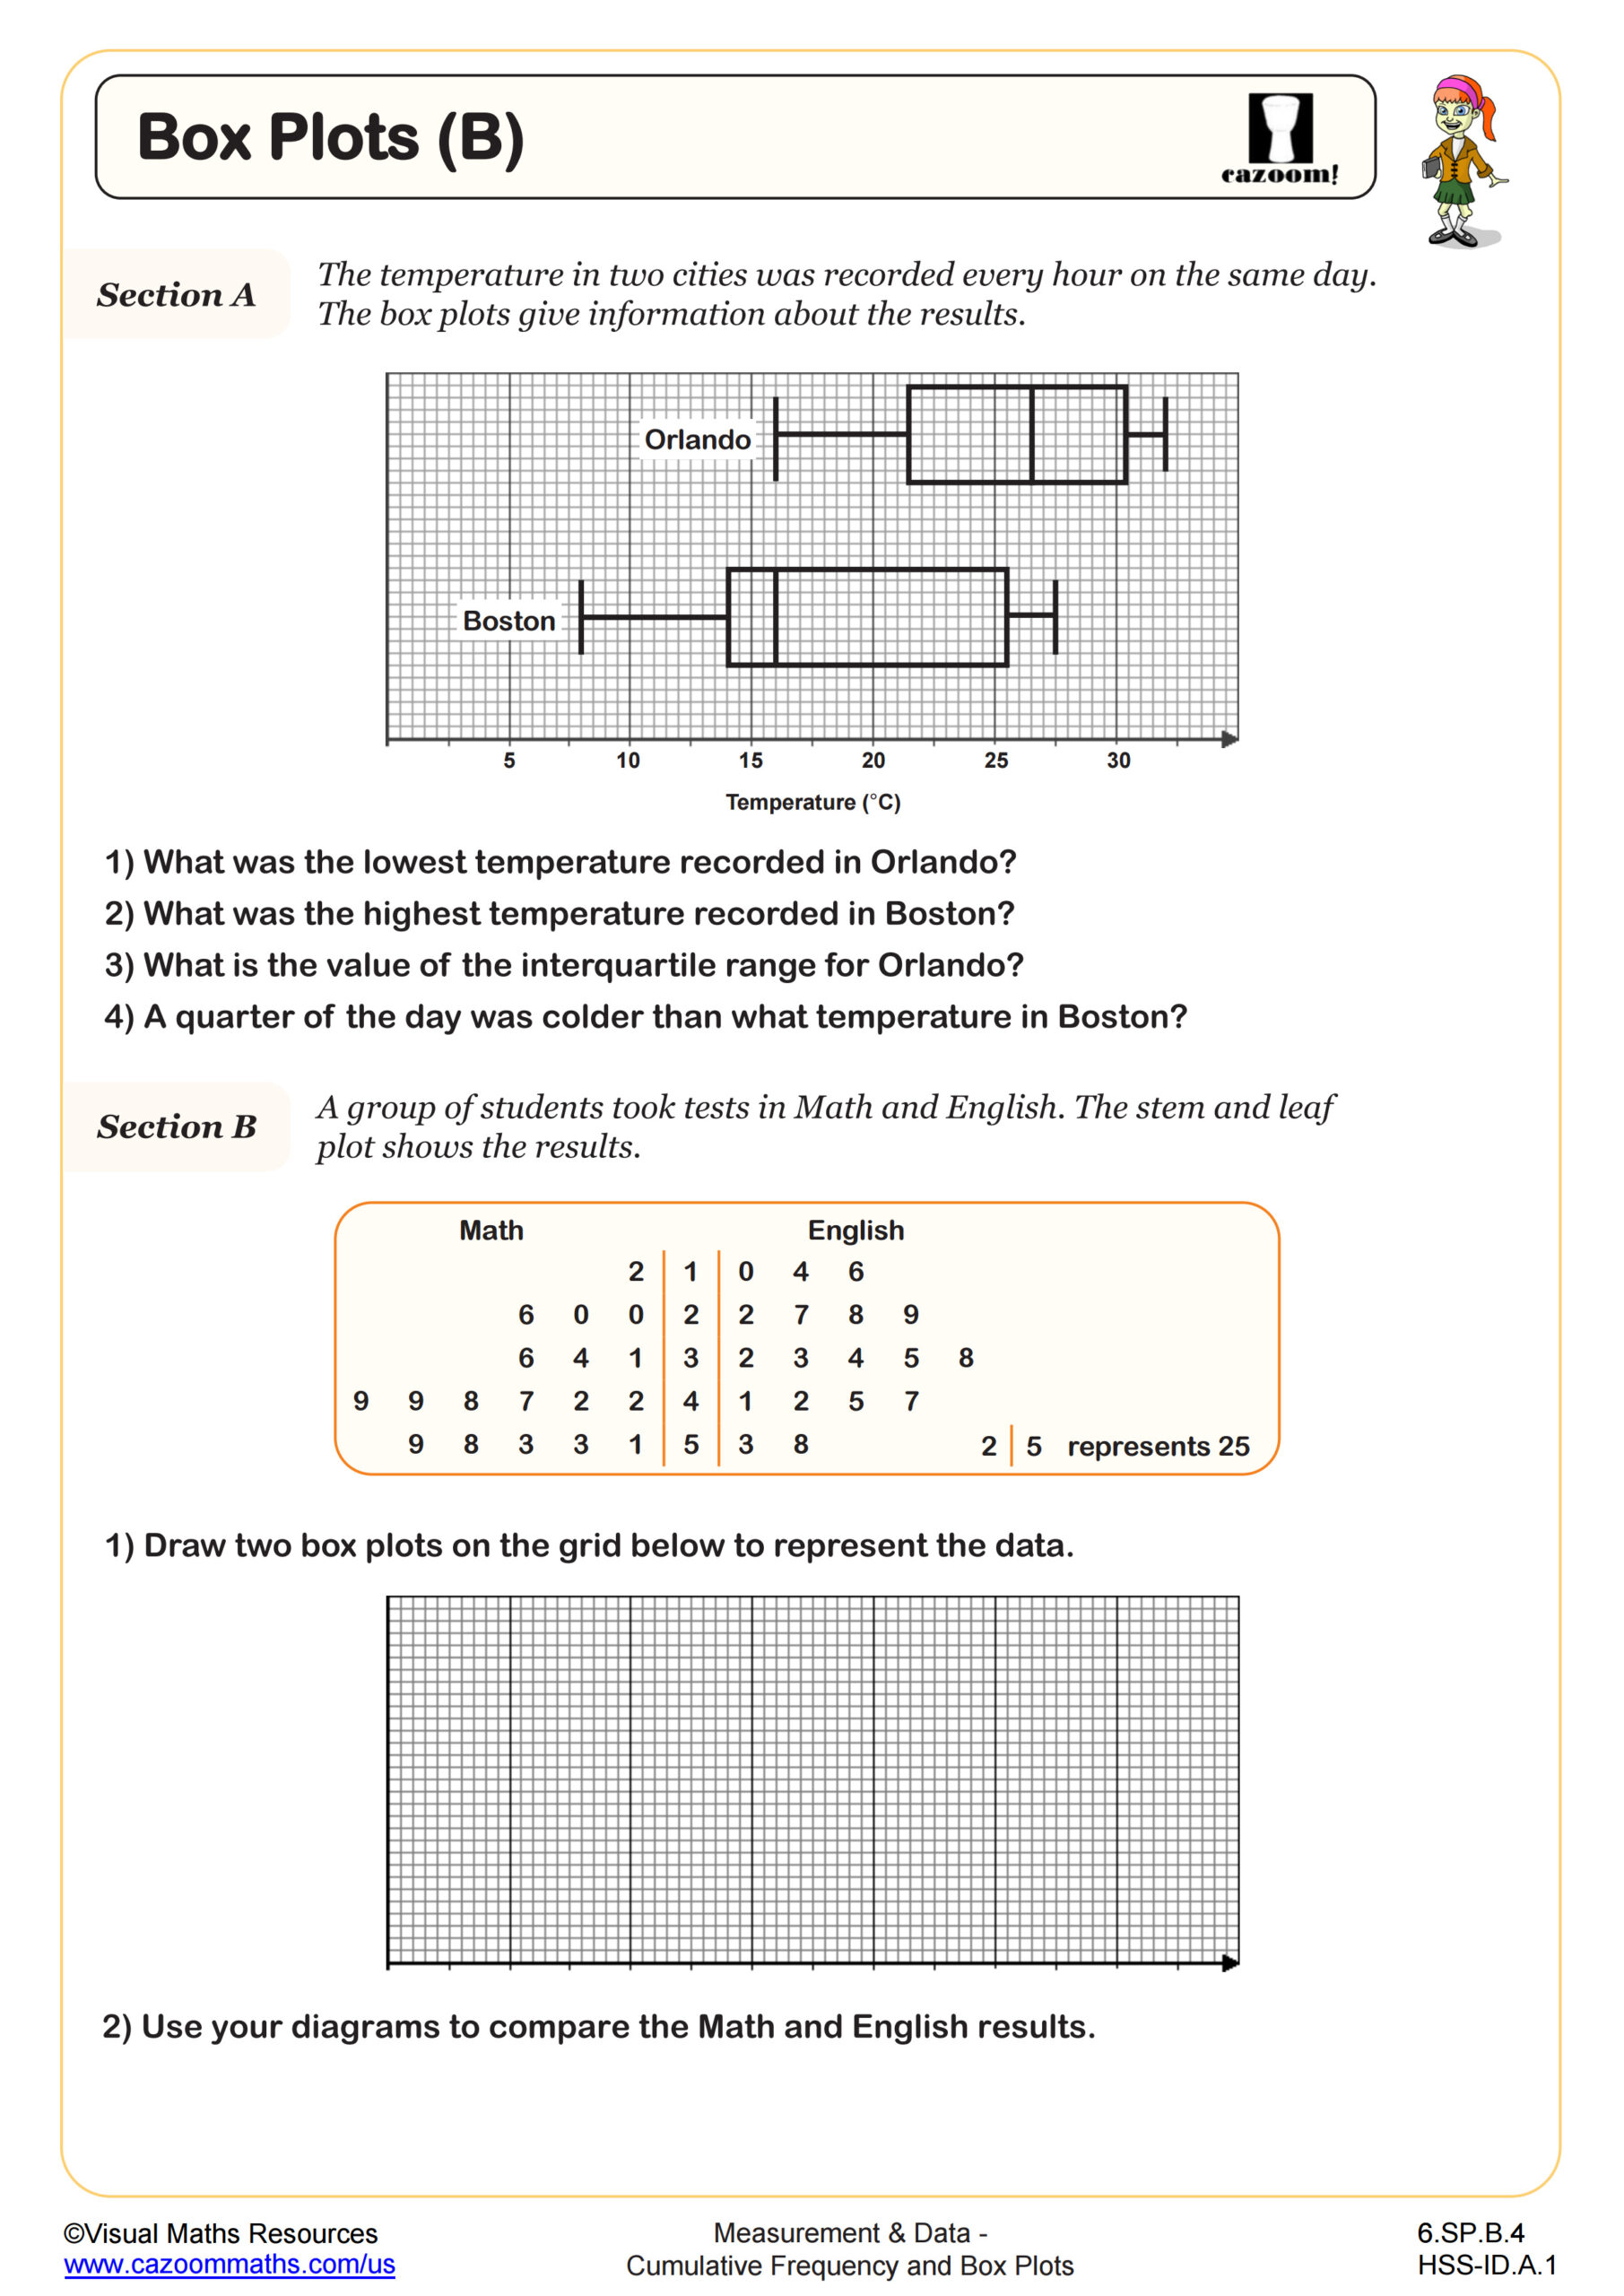
Box Plots (B)
Grades: 6th Grade, Algebra I
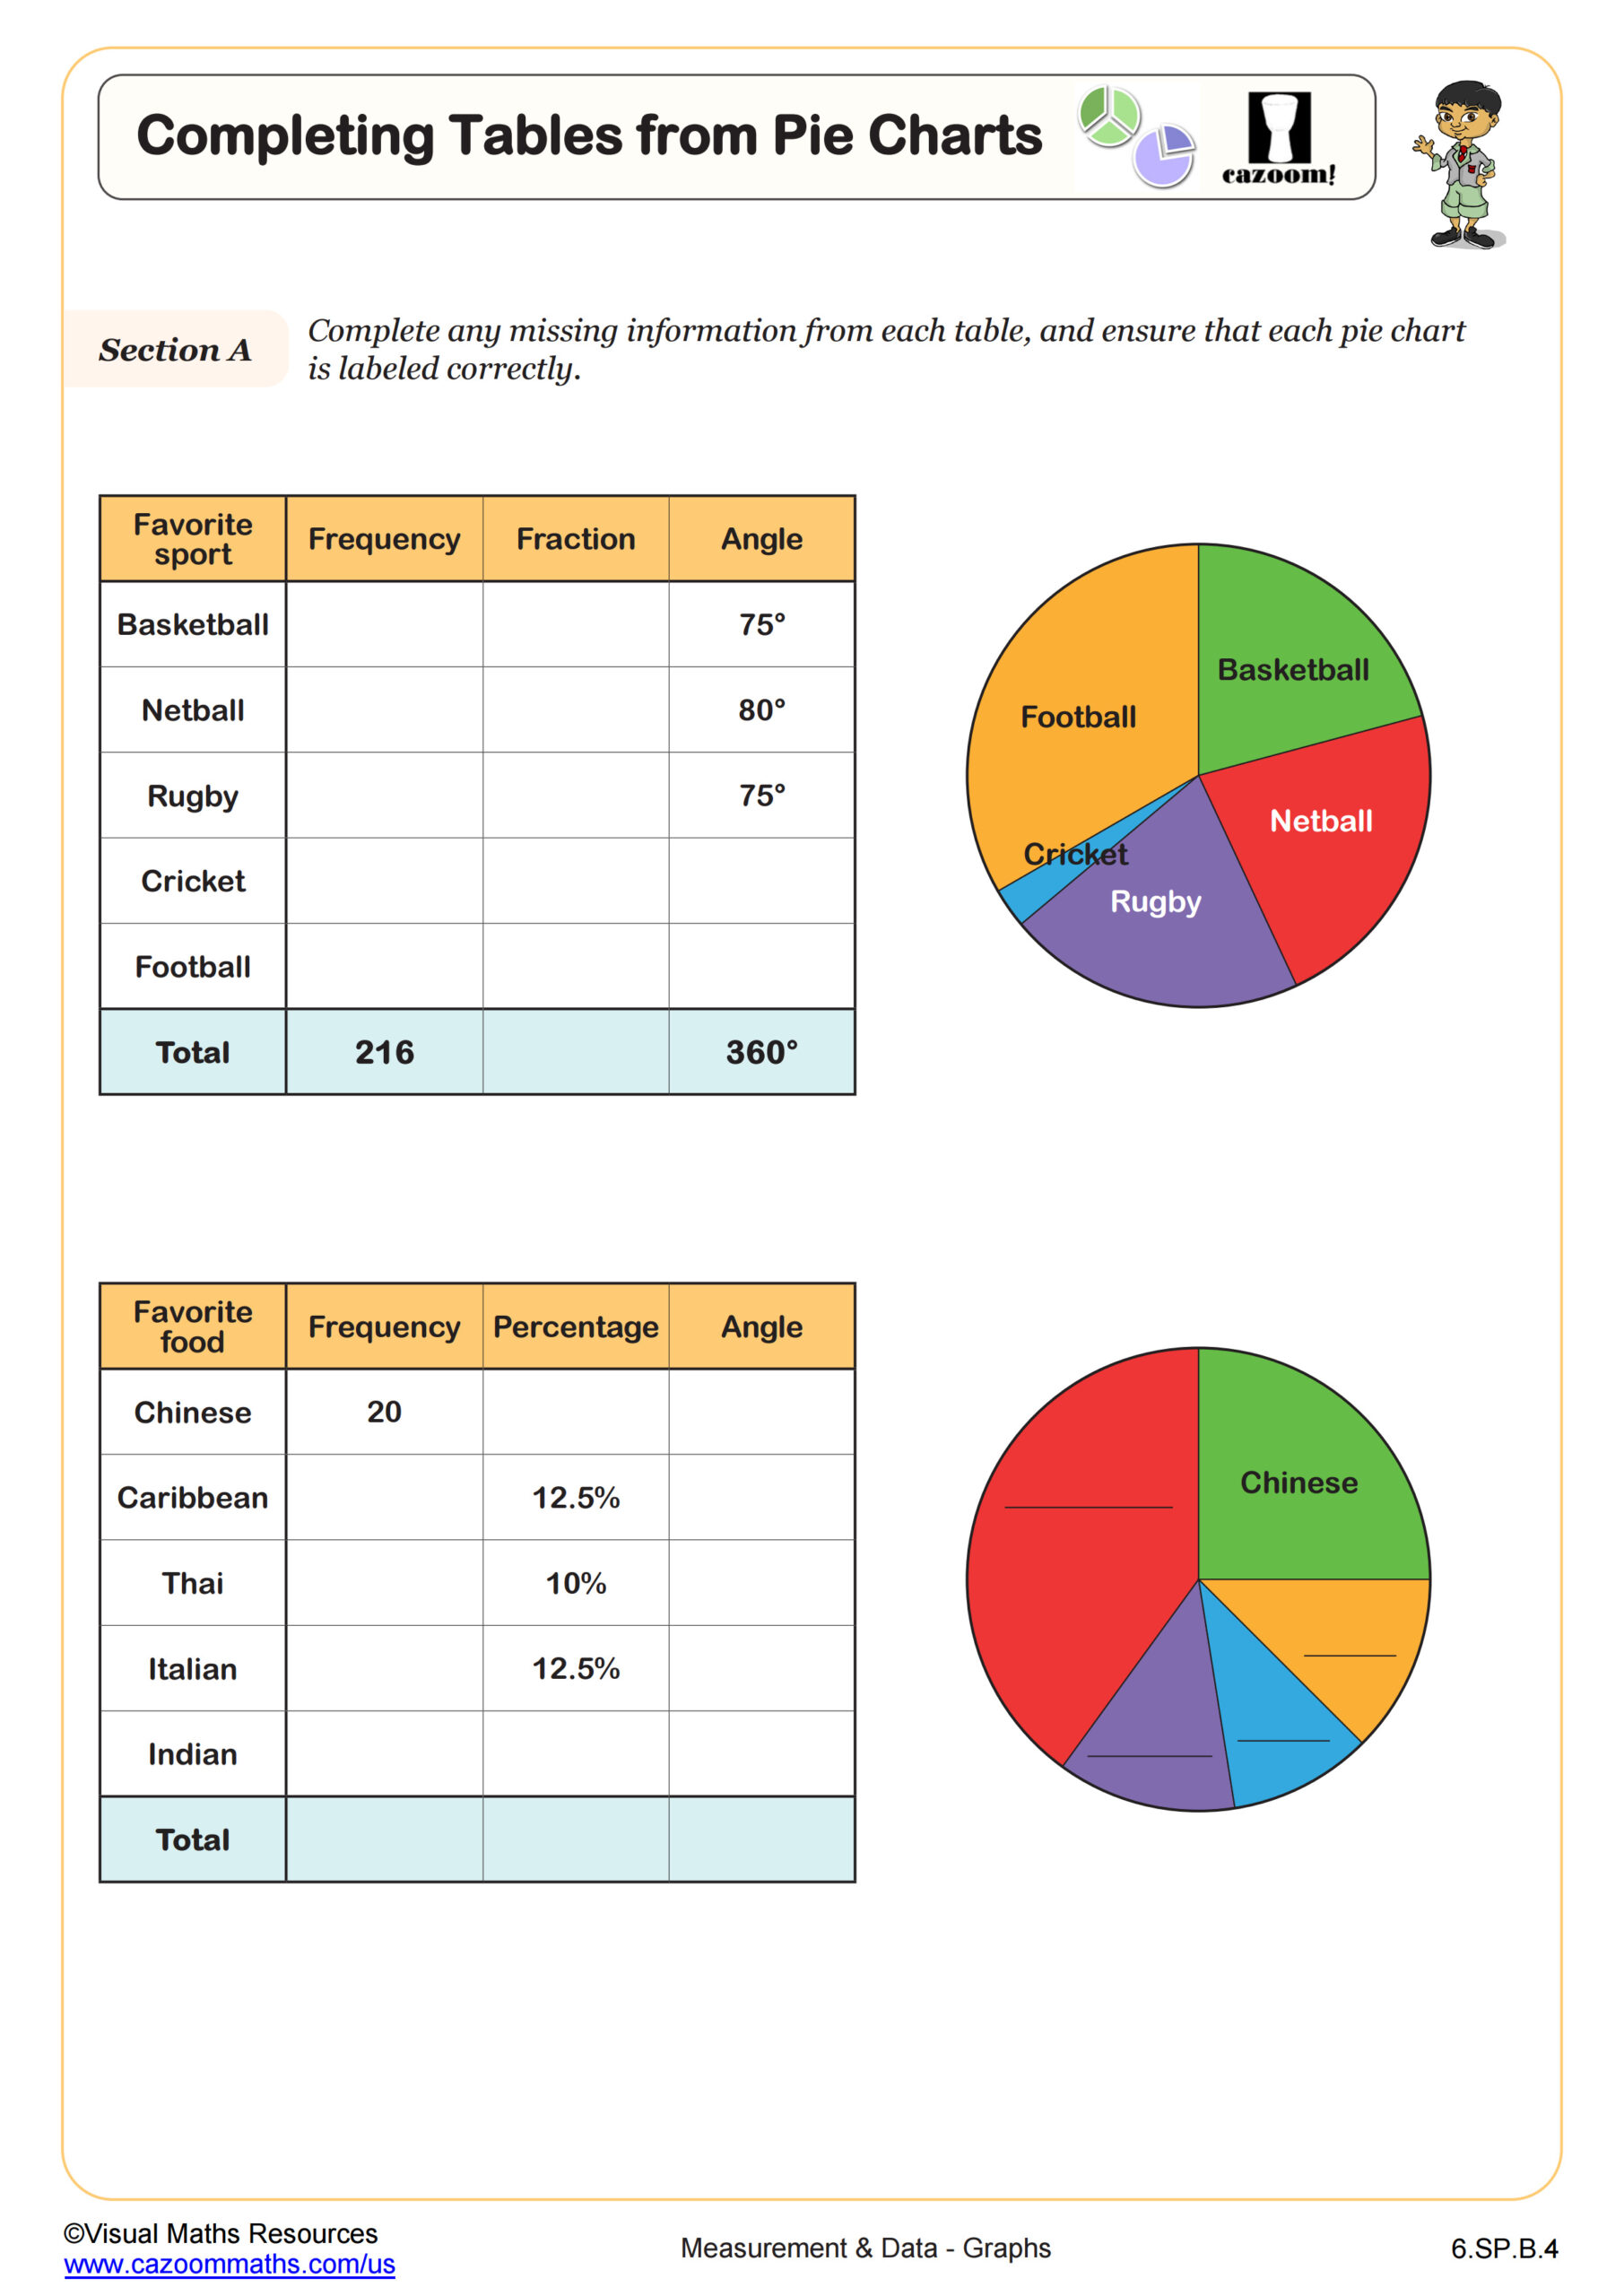
Completing Tables from Pie Charts
Grades: 6th Grade
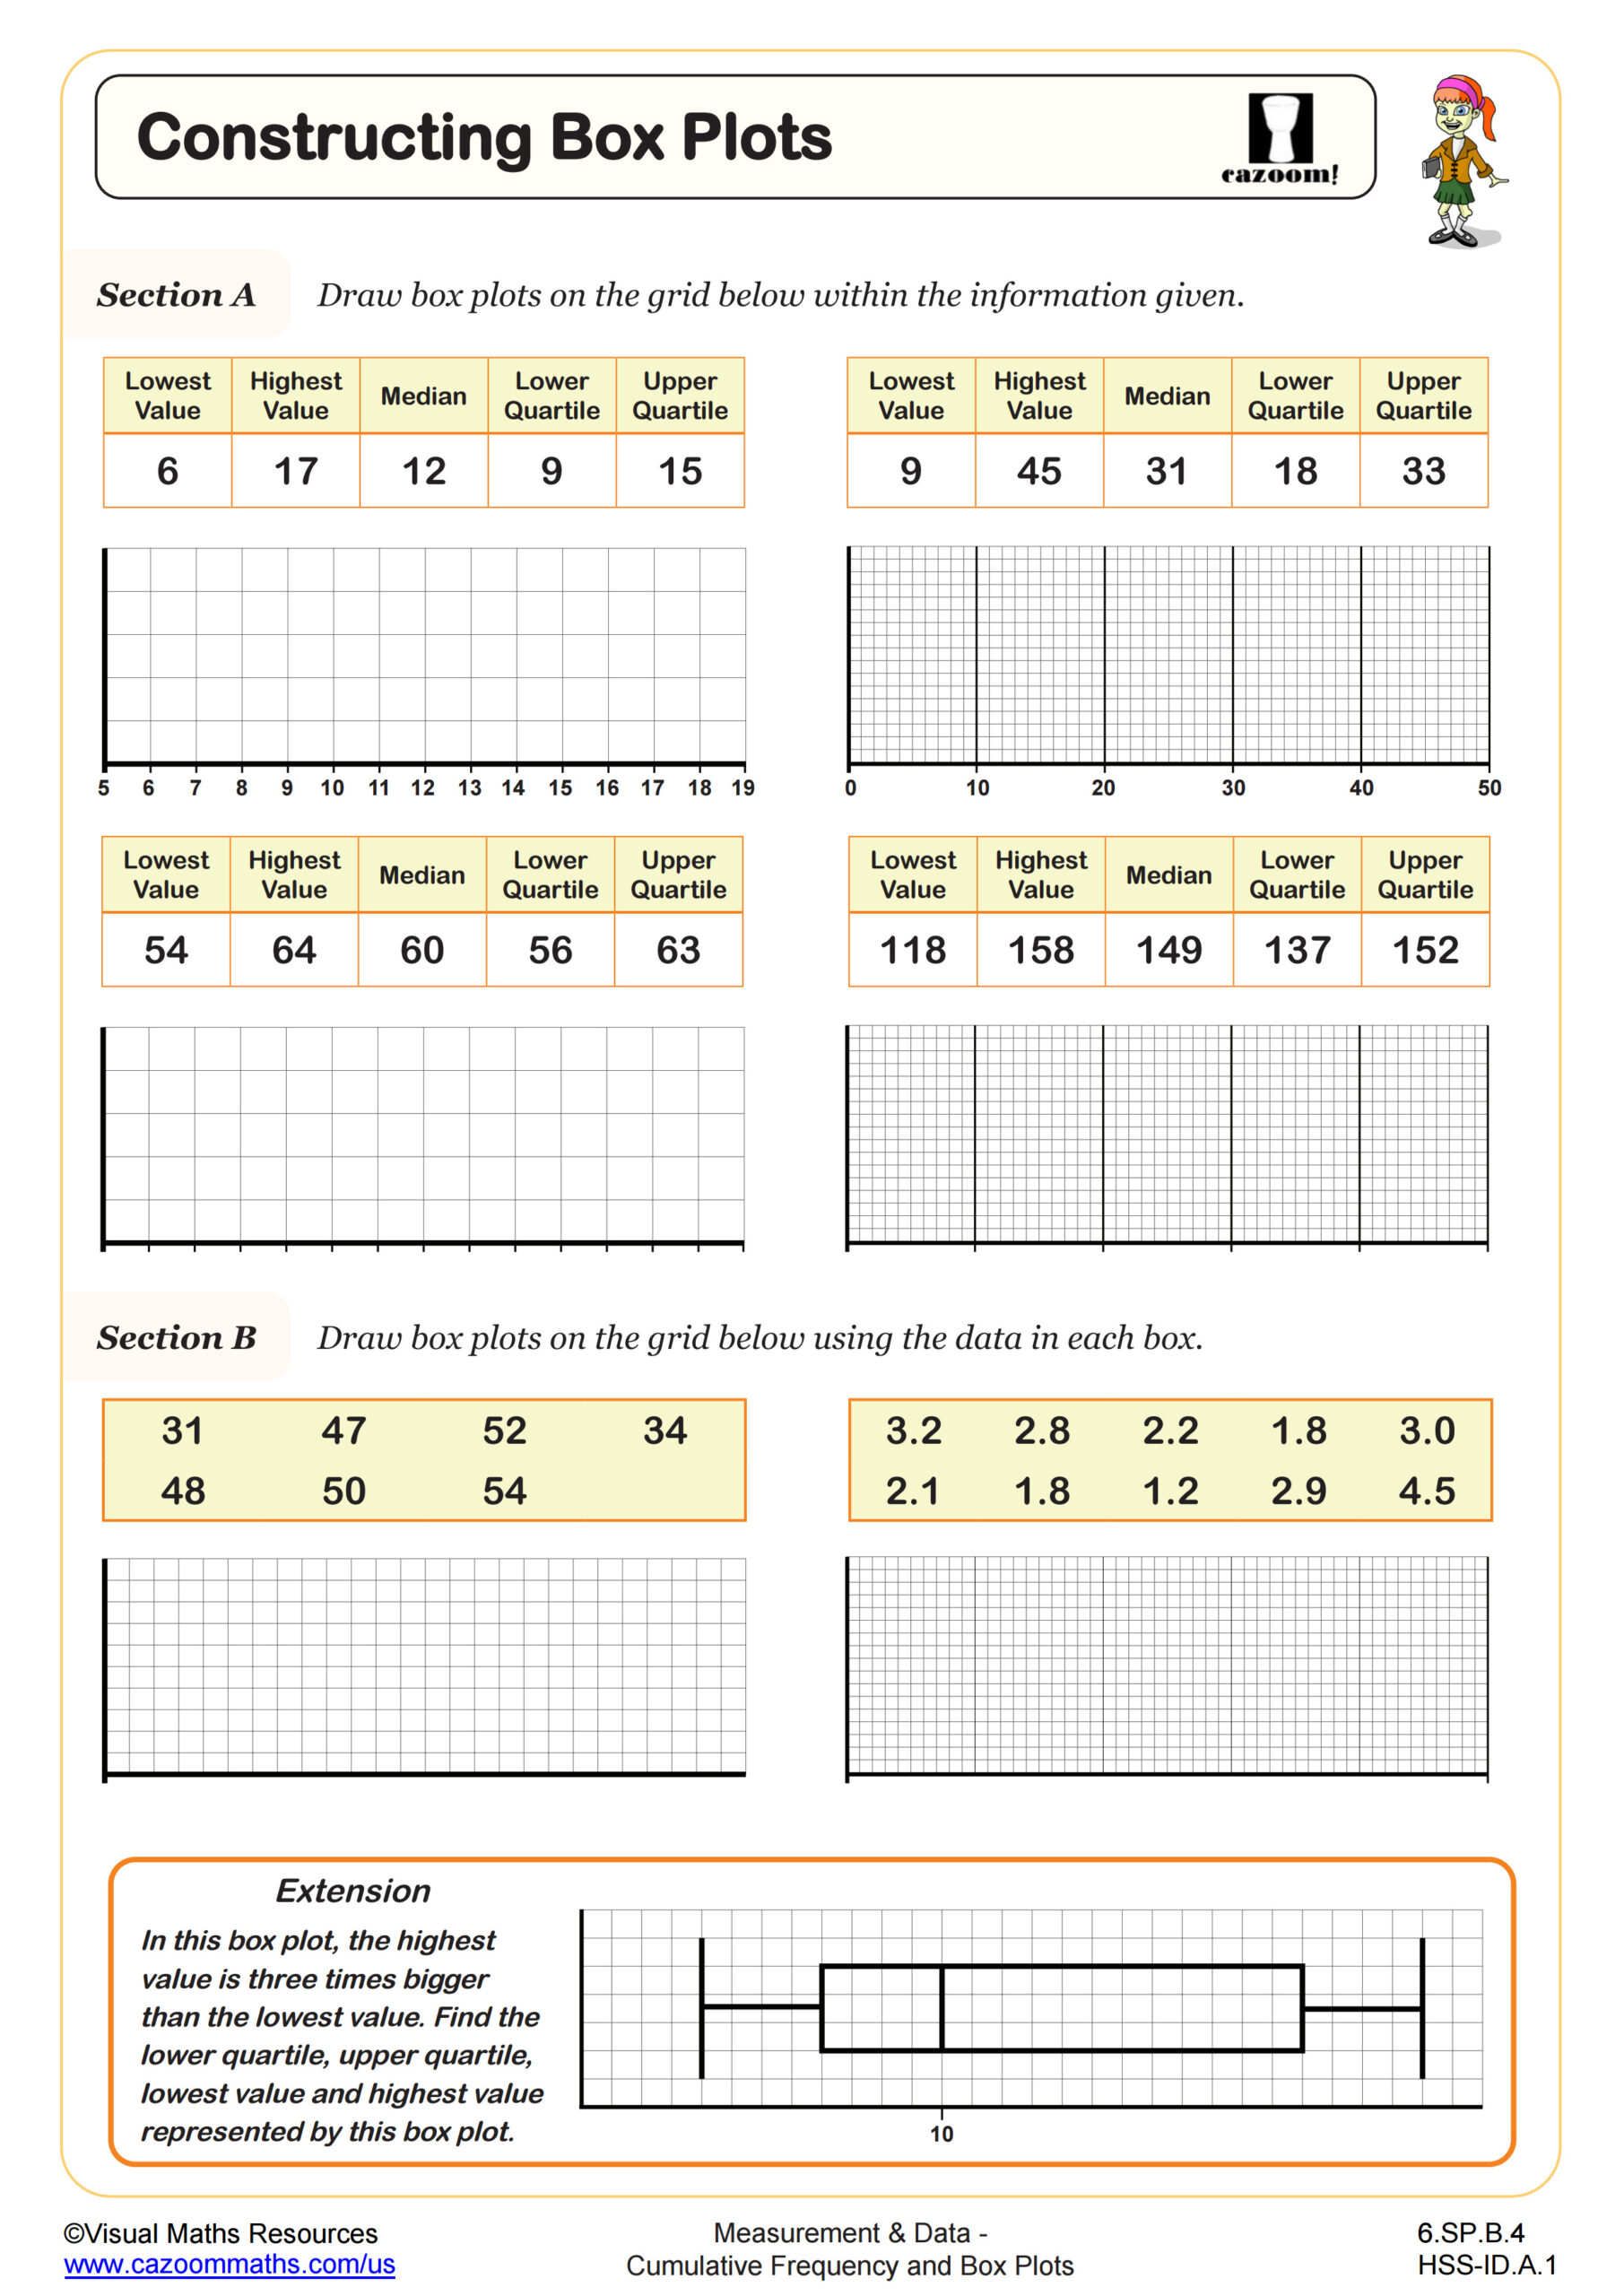
Constructing Box Plots
Grades: 6th Grade, Algebra I
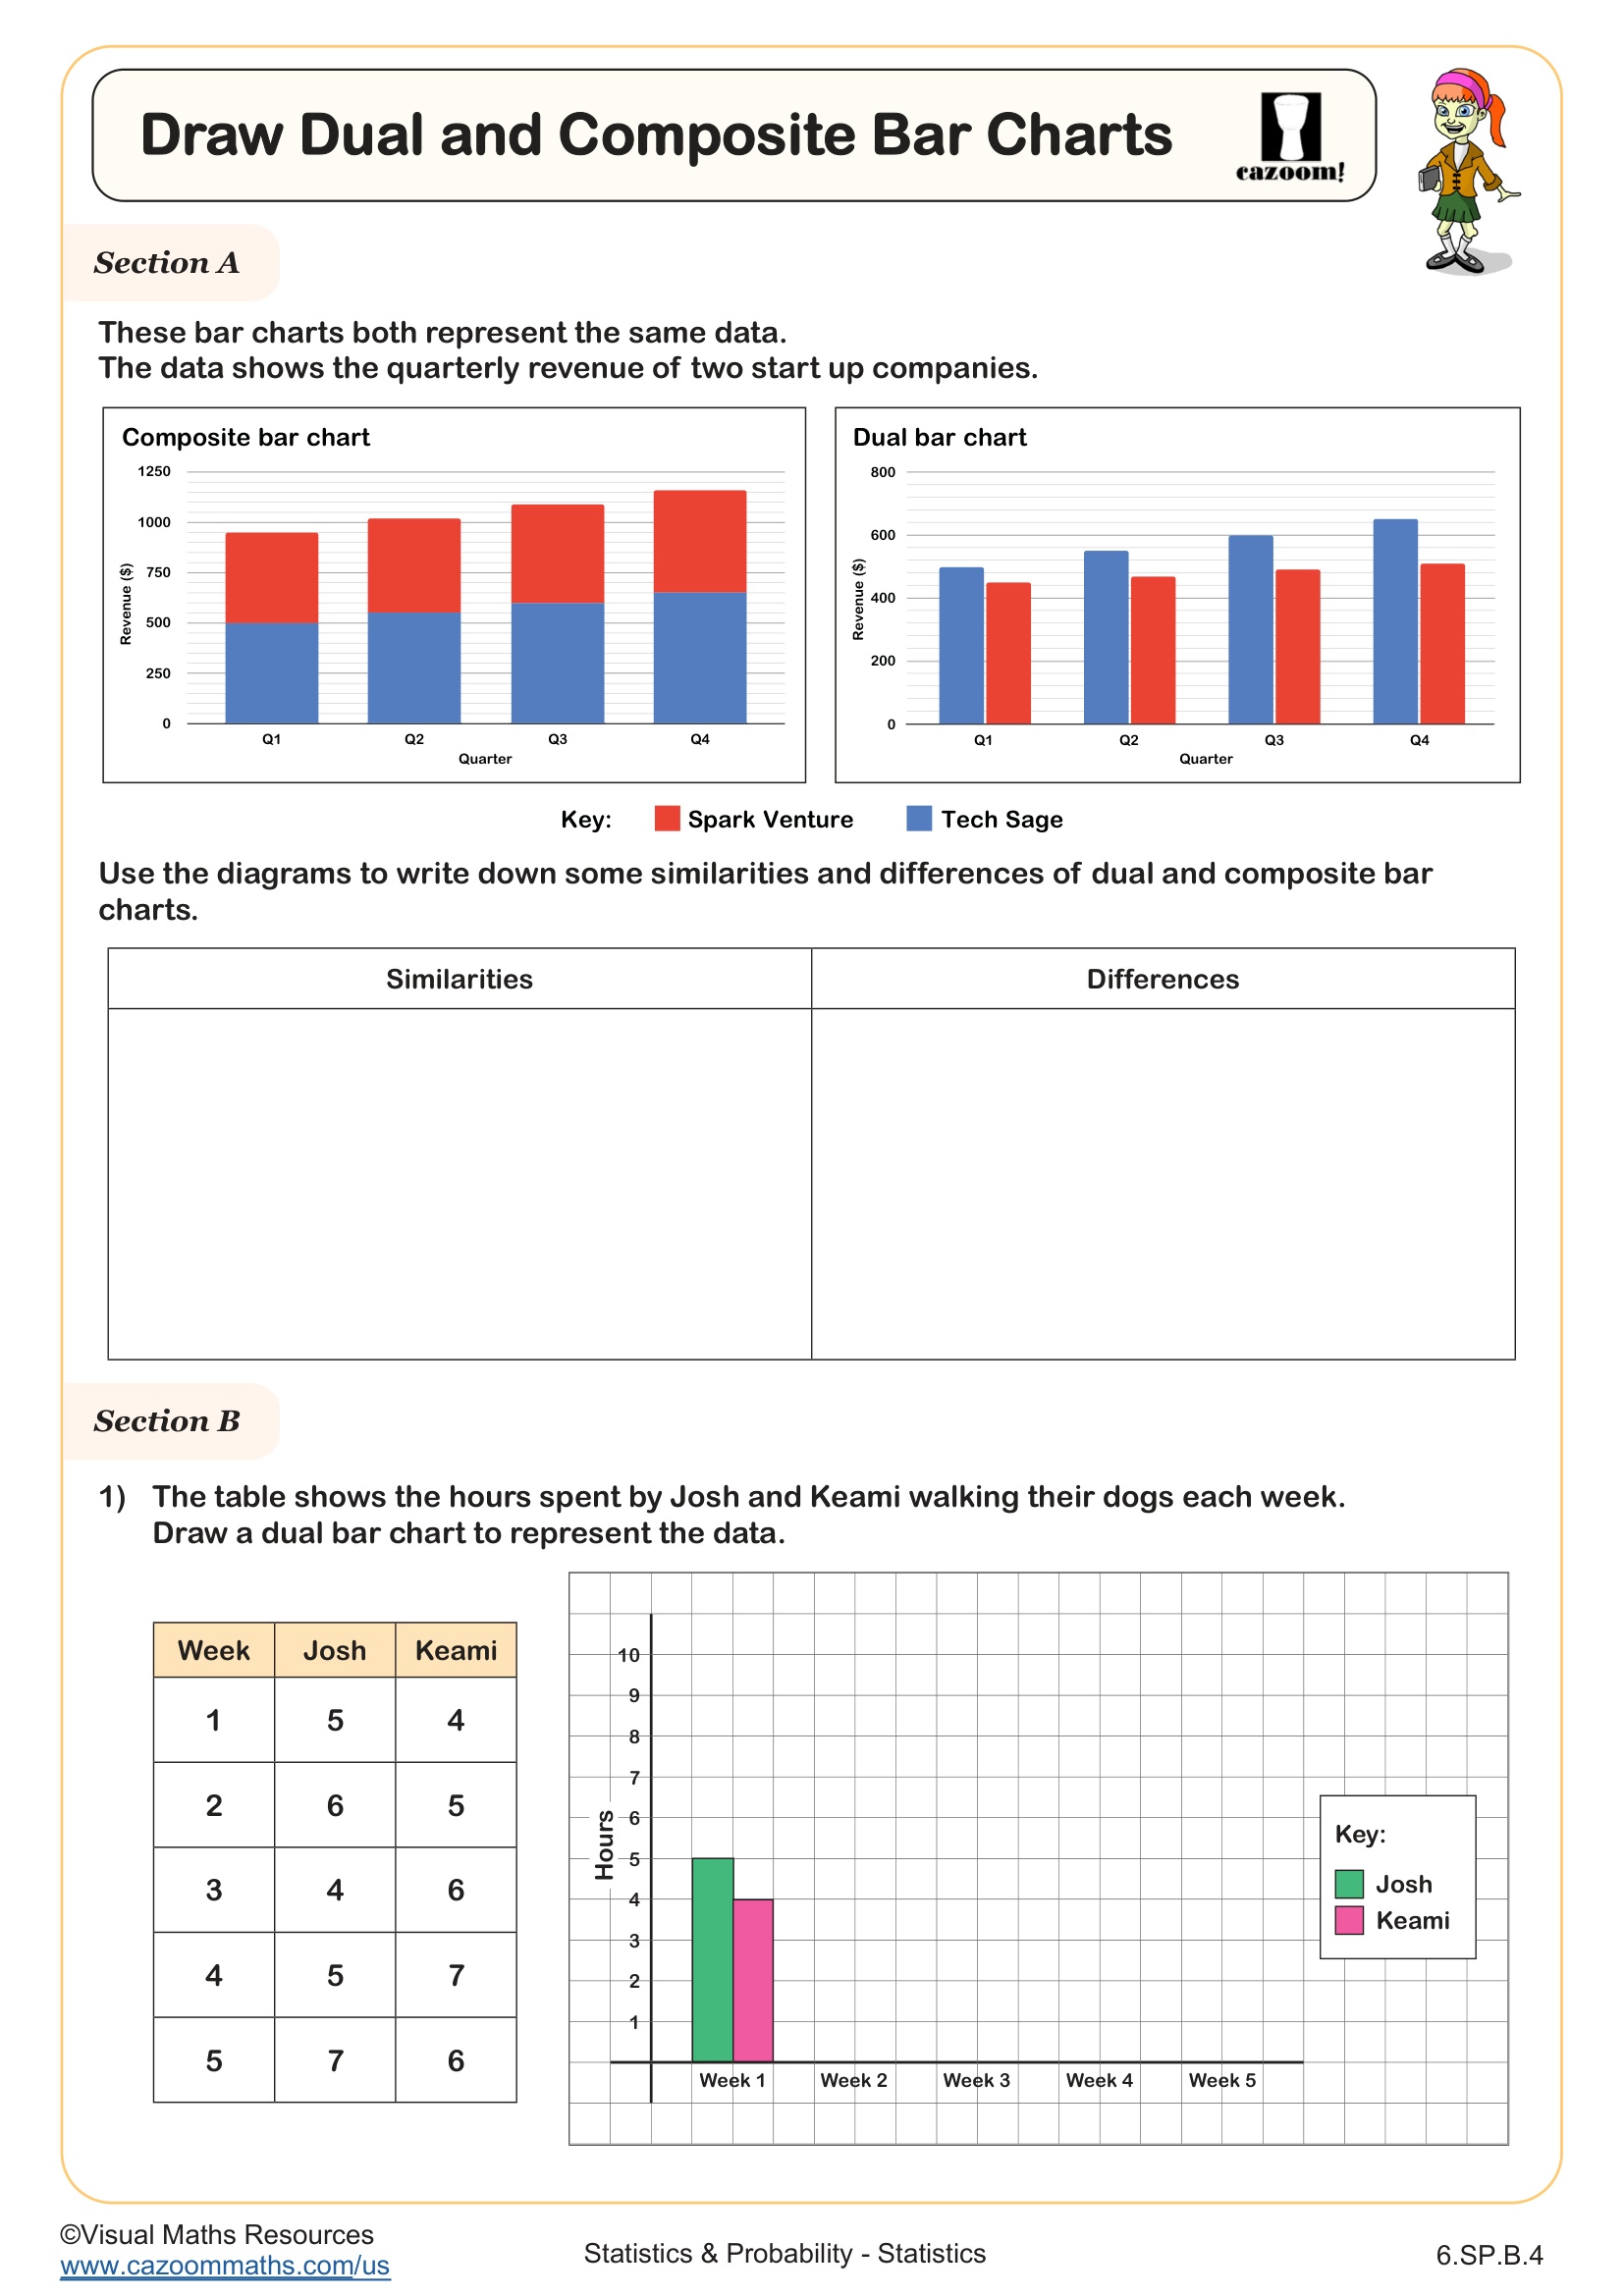
Draw Composite and Dual Bar Charts
Grades: 6th Grade
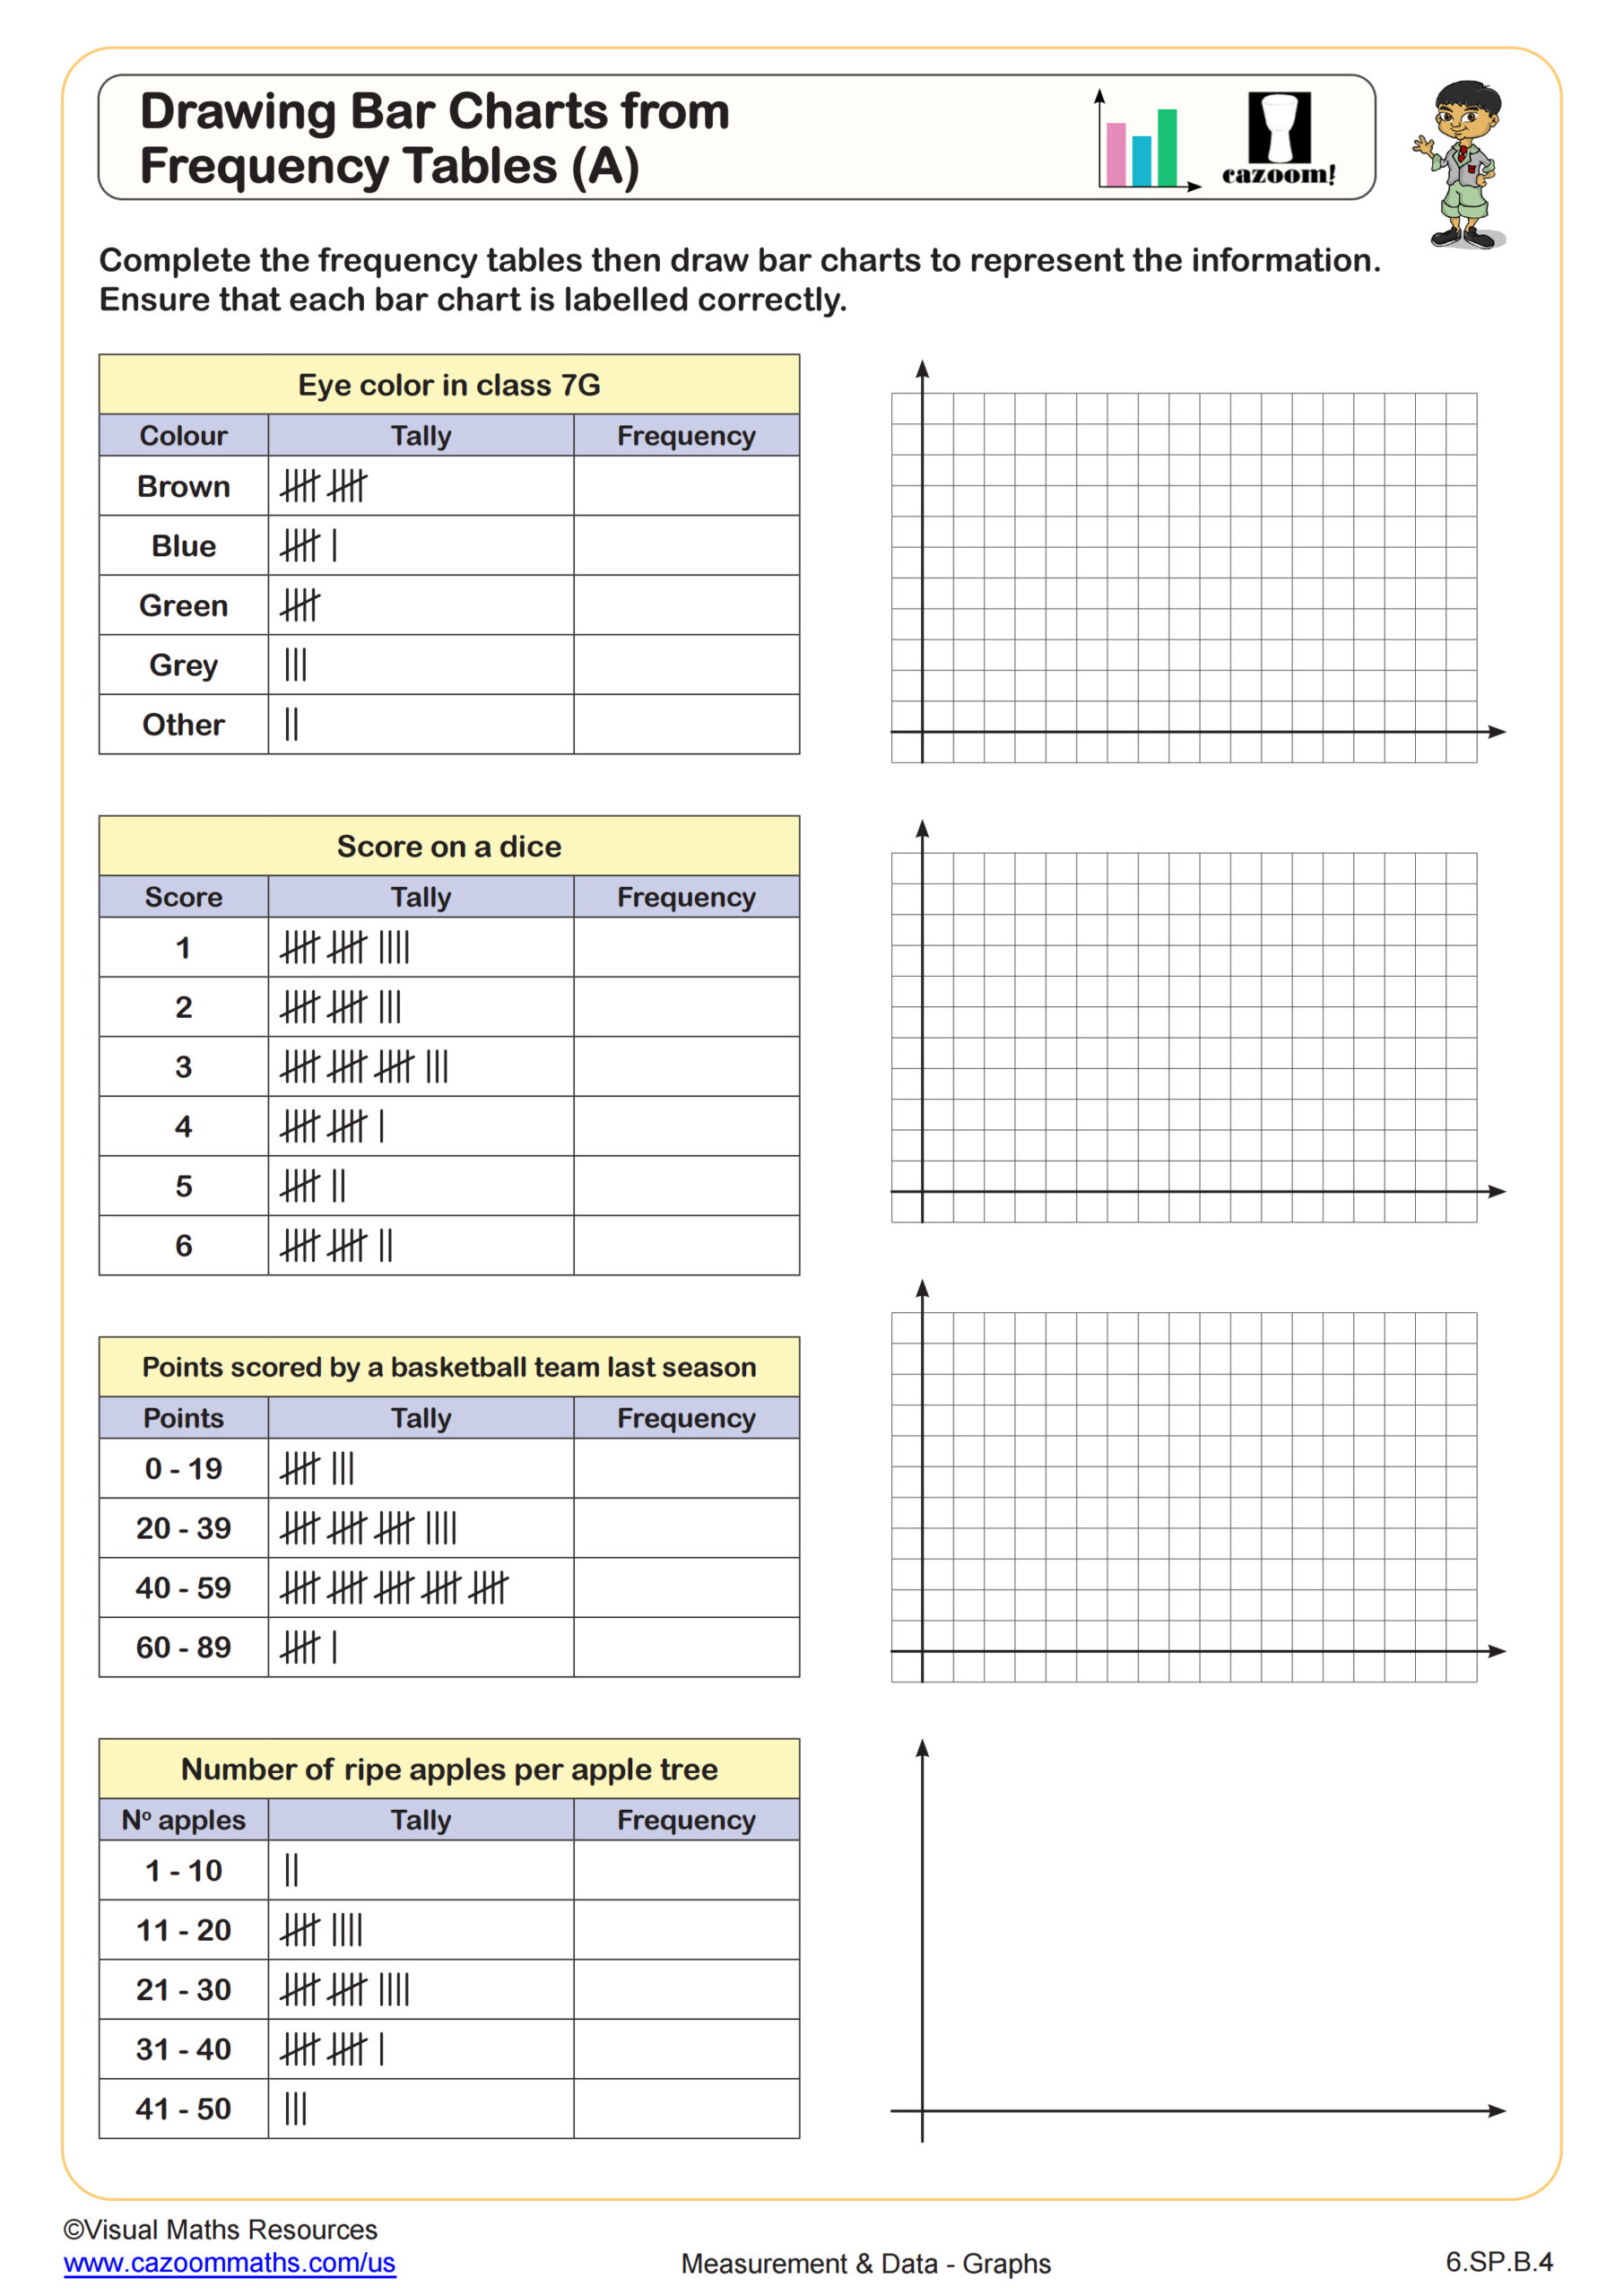
Drawing Bar Graphs from Frequency Tables (A)
Grades: 6th Grade
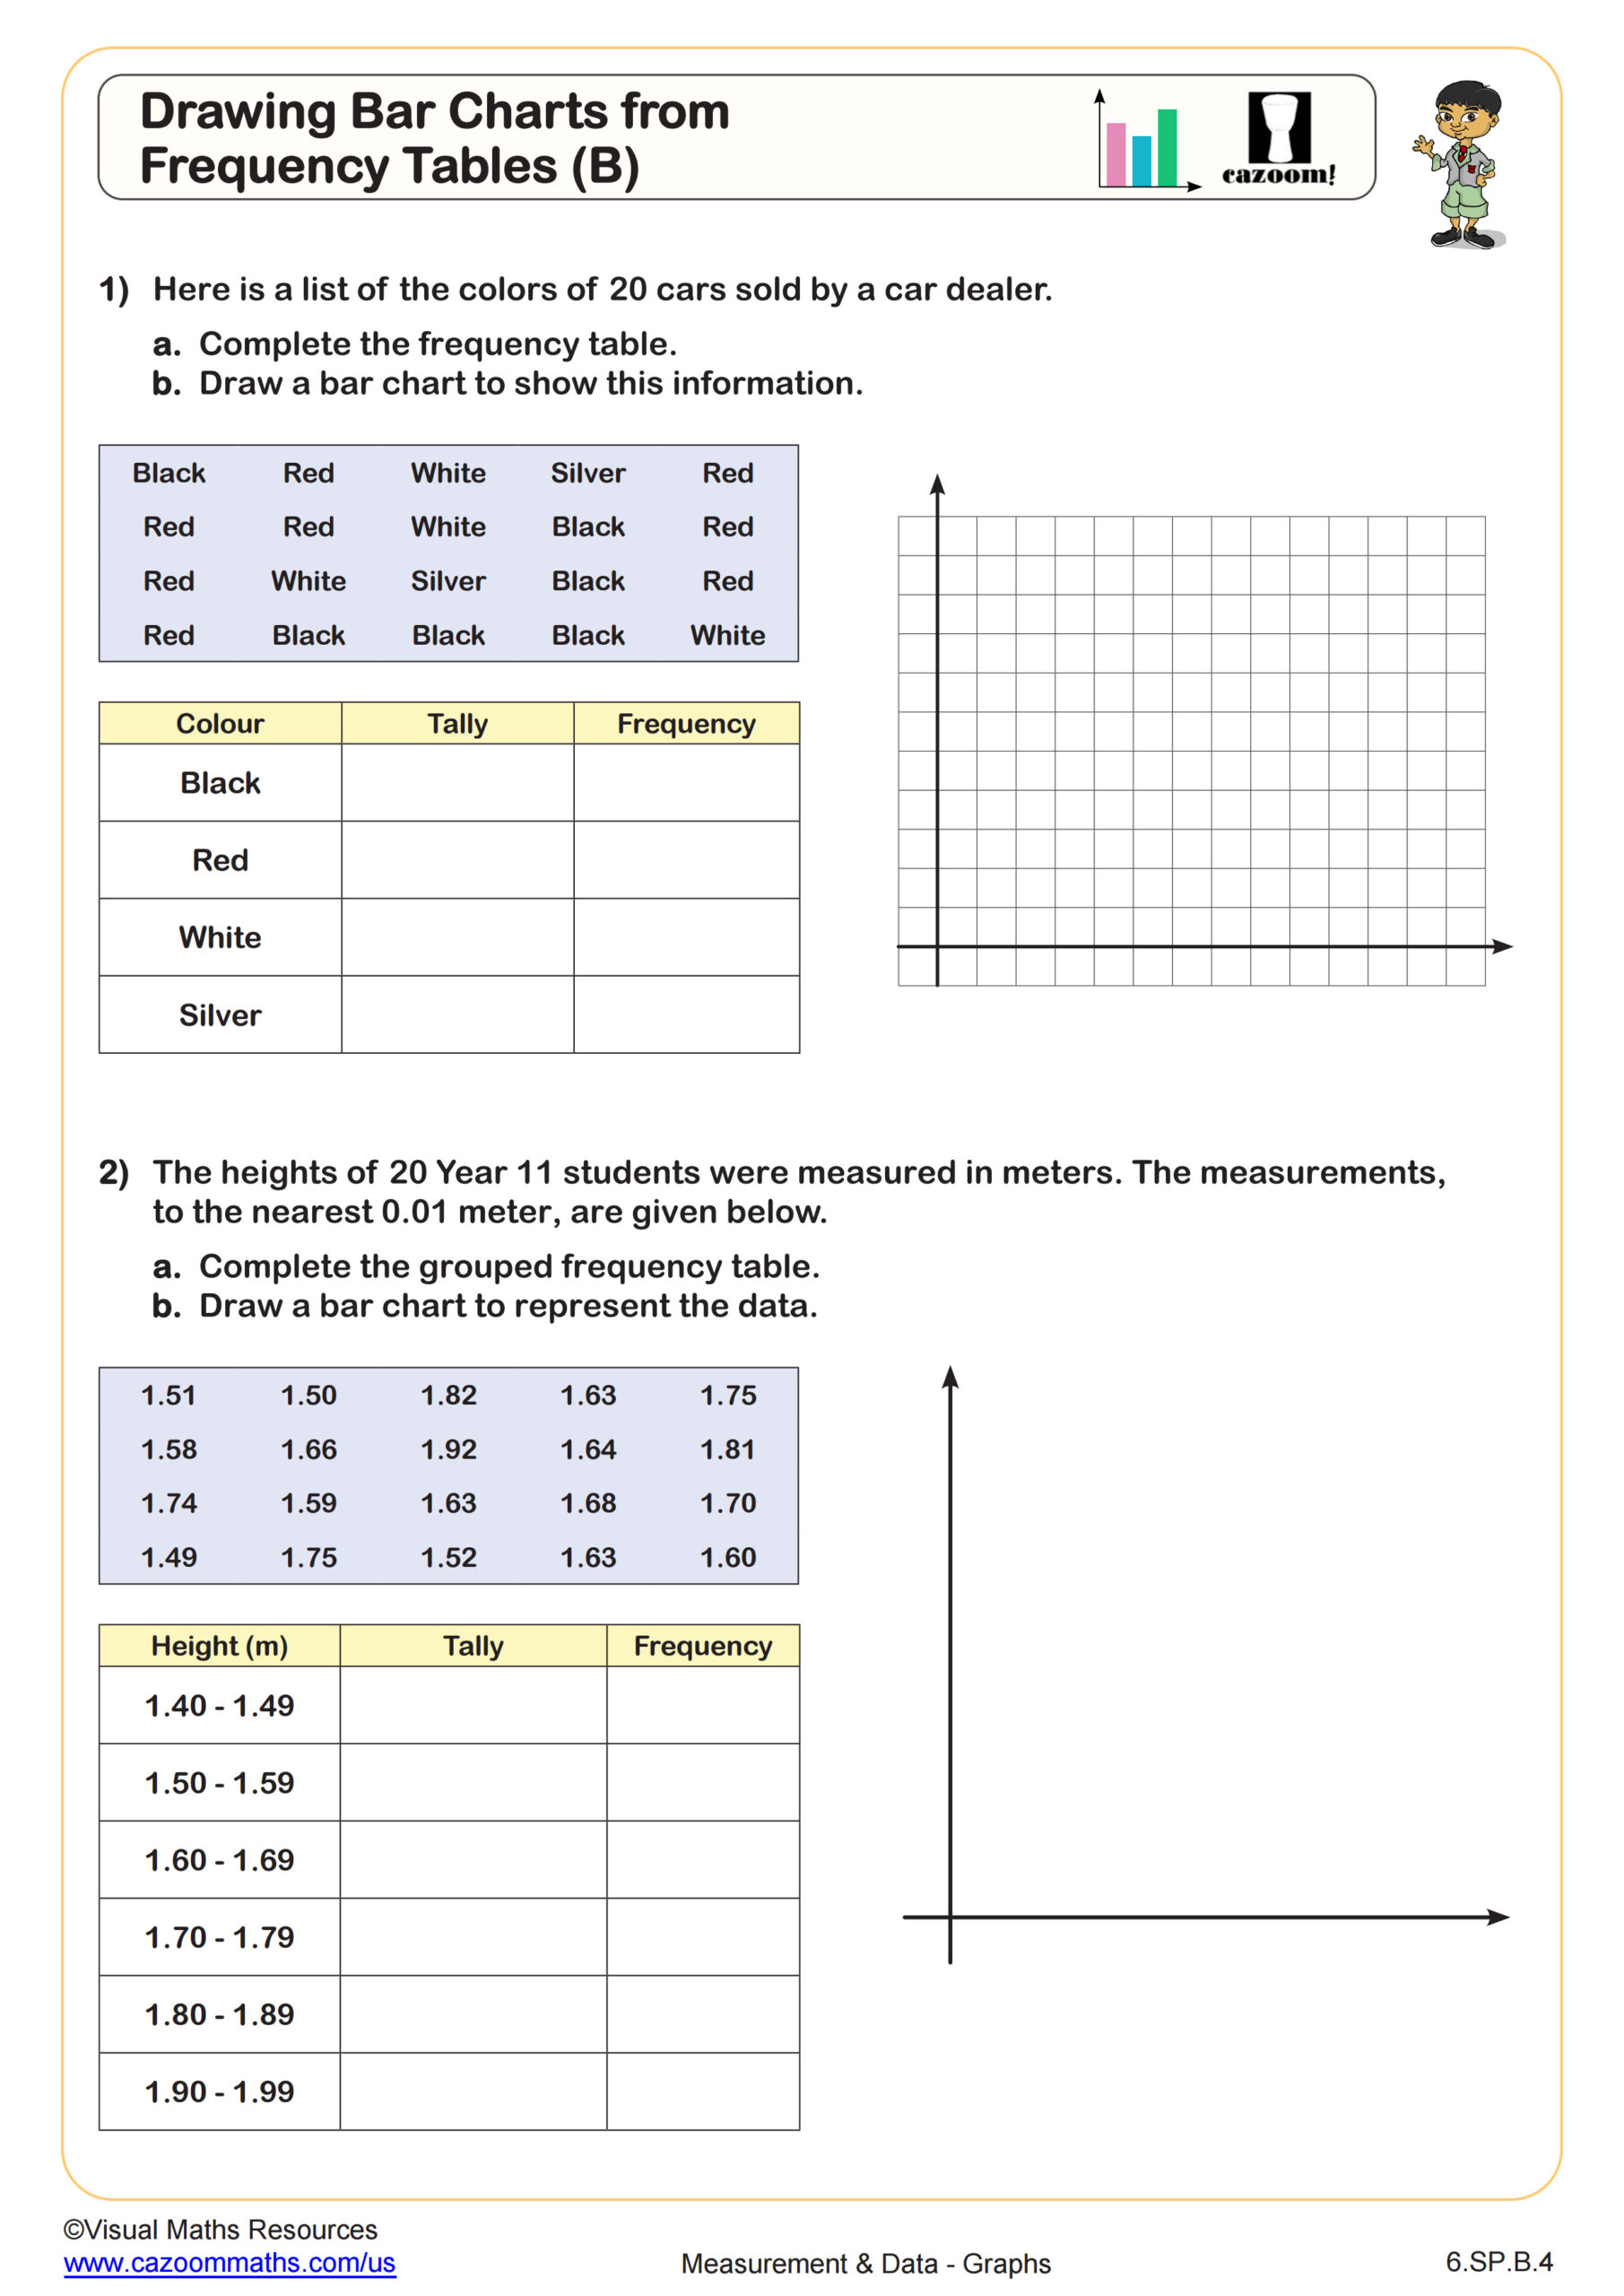
Drawing Bar Graphs from Frequency Tables (B)
Grades: 6th Grade
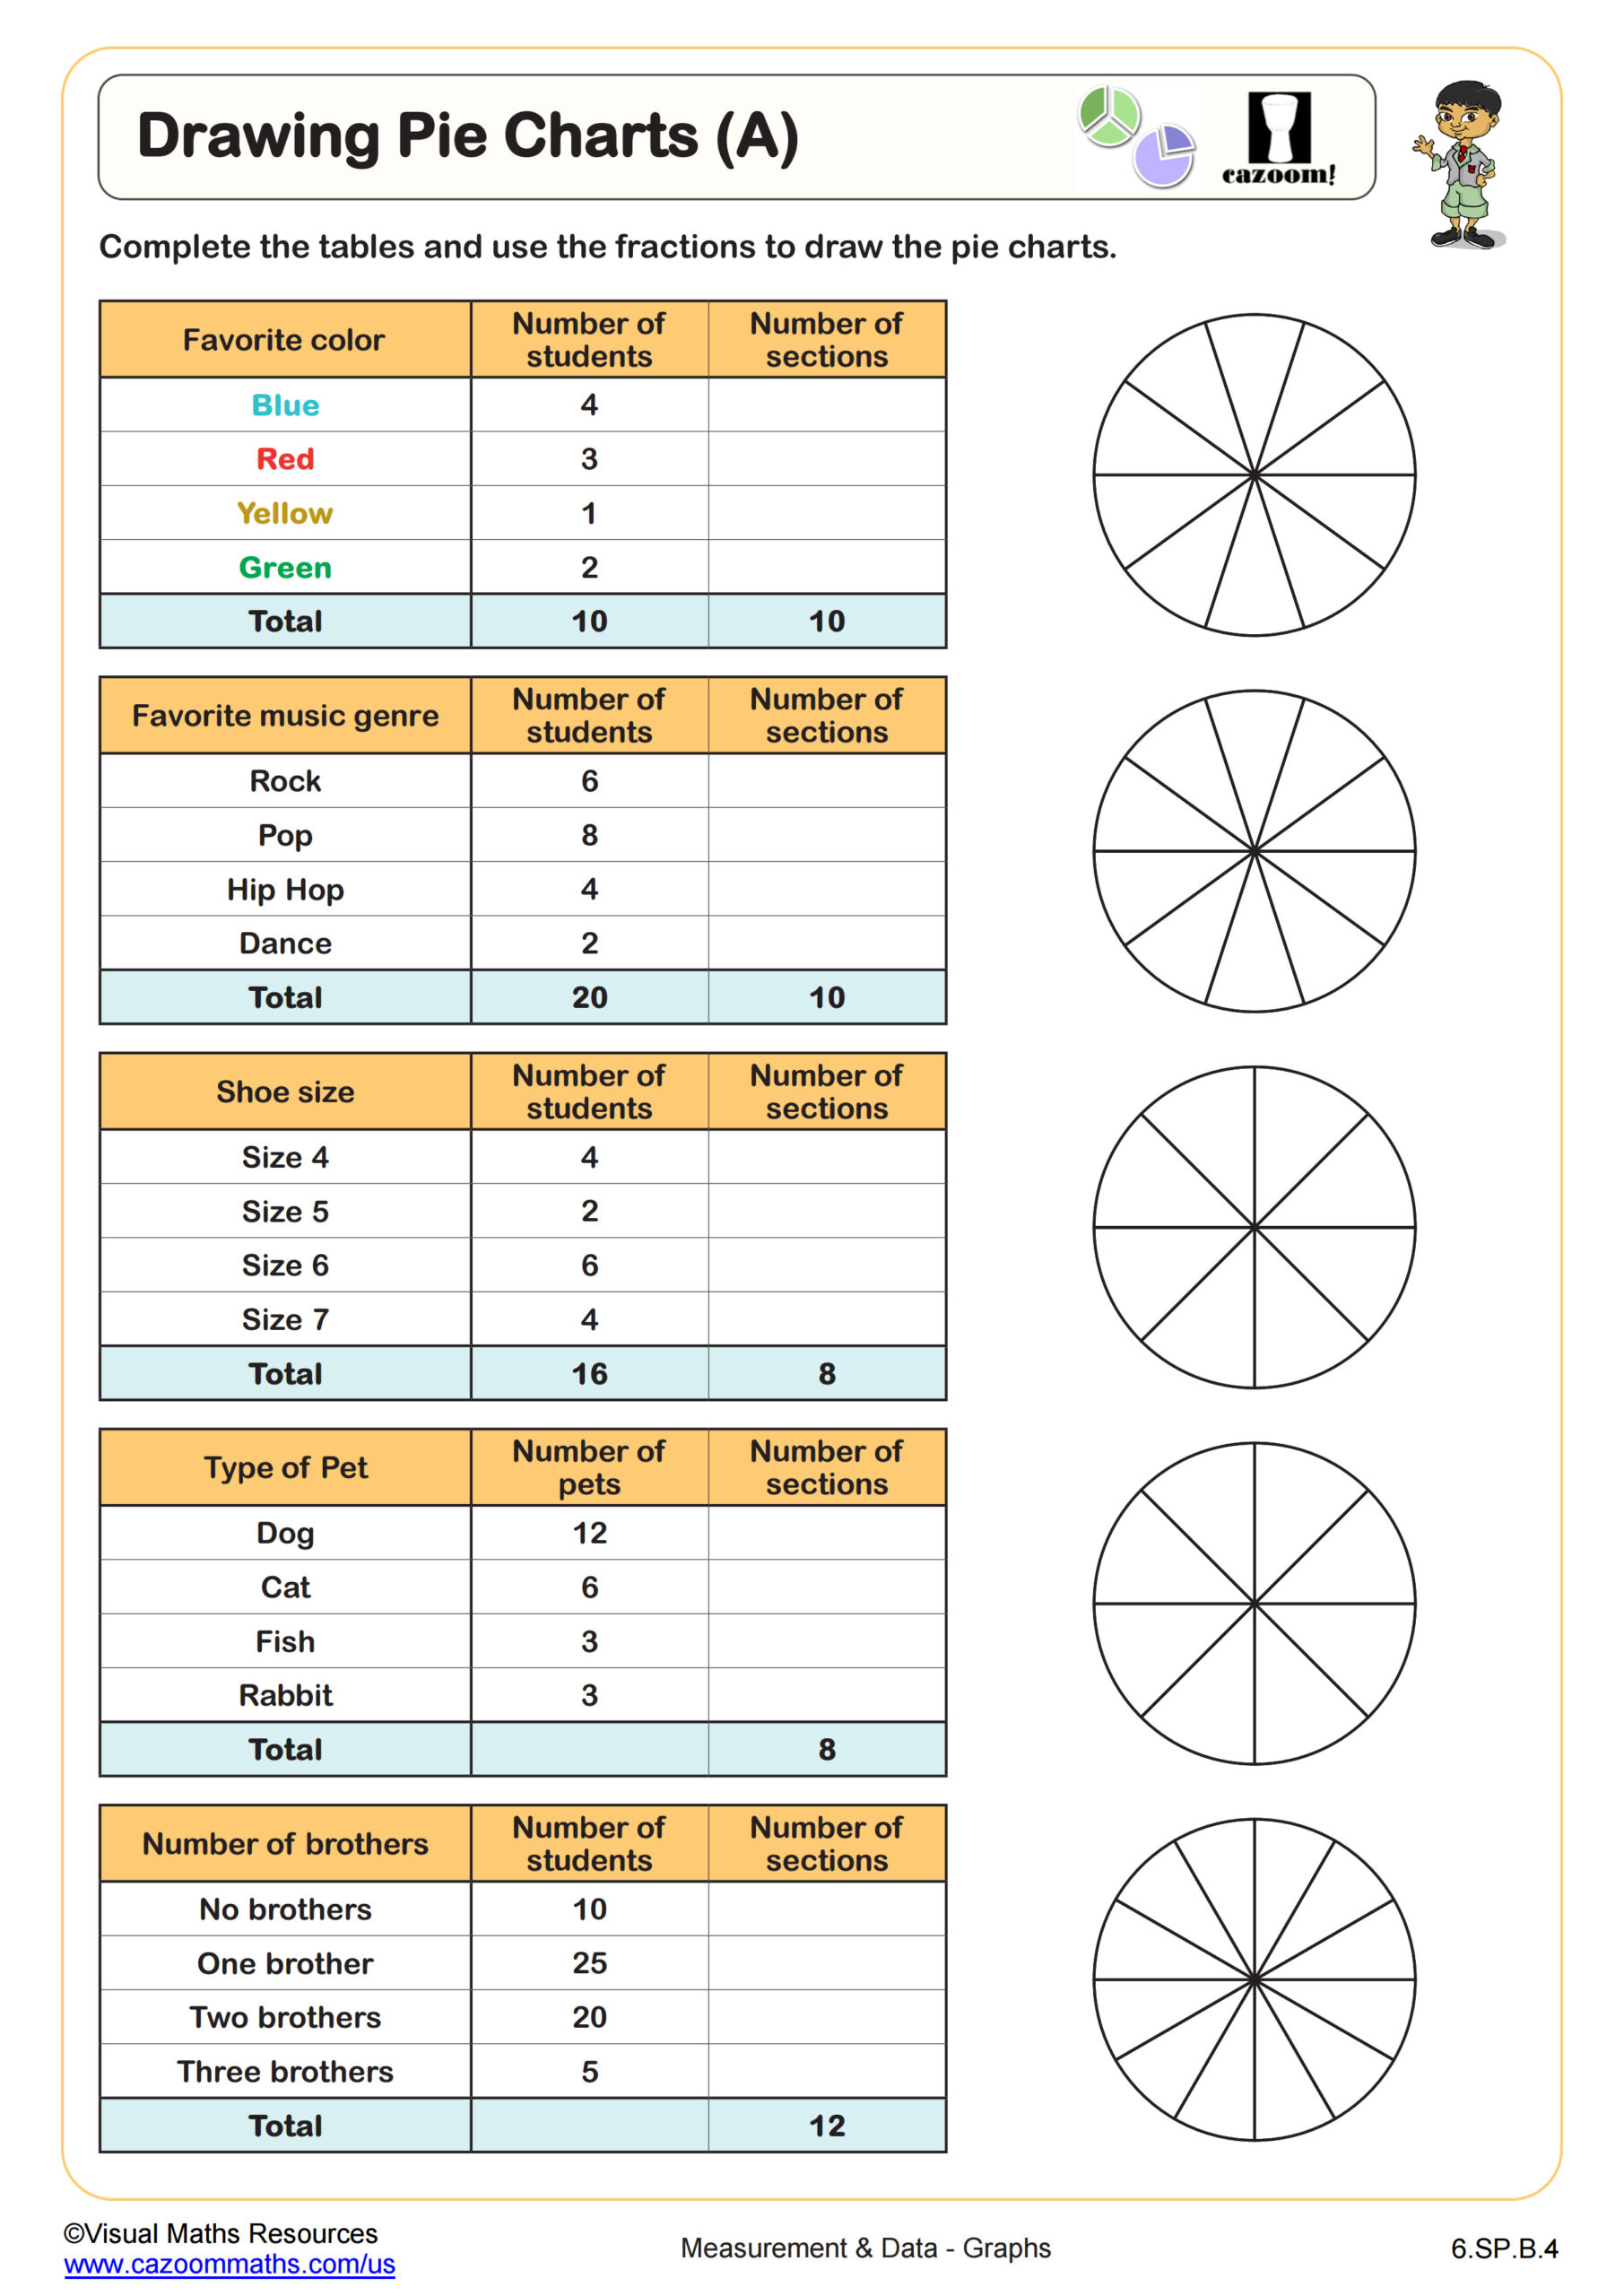
Drawing Pie Charts (A)
Grades: 6th Grade
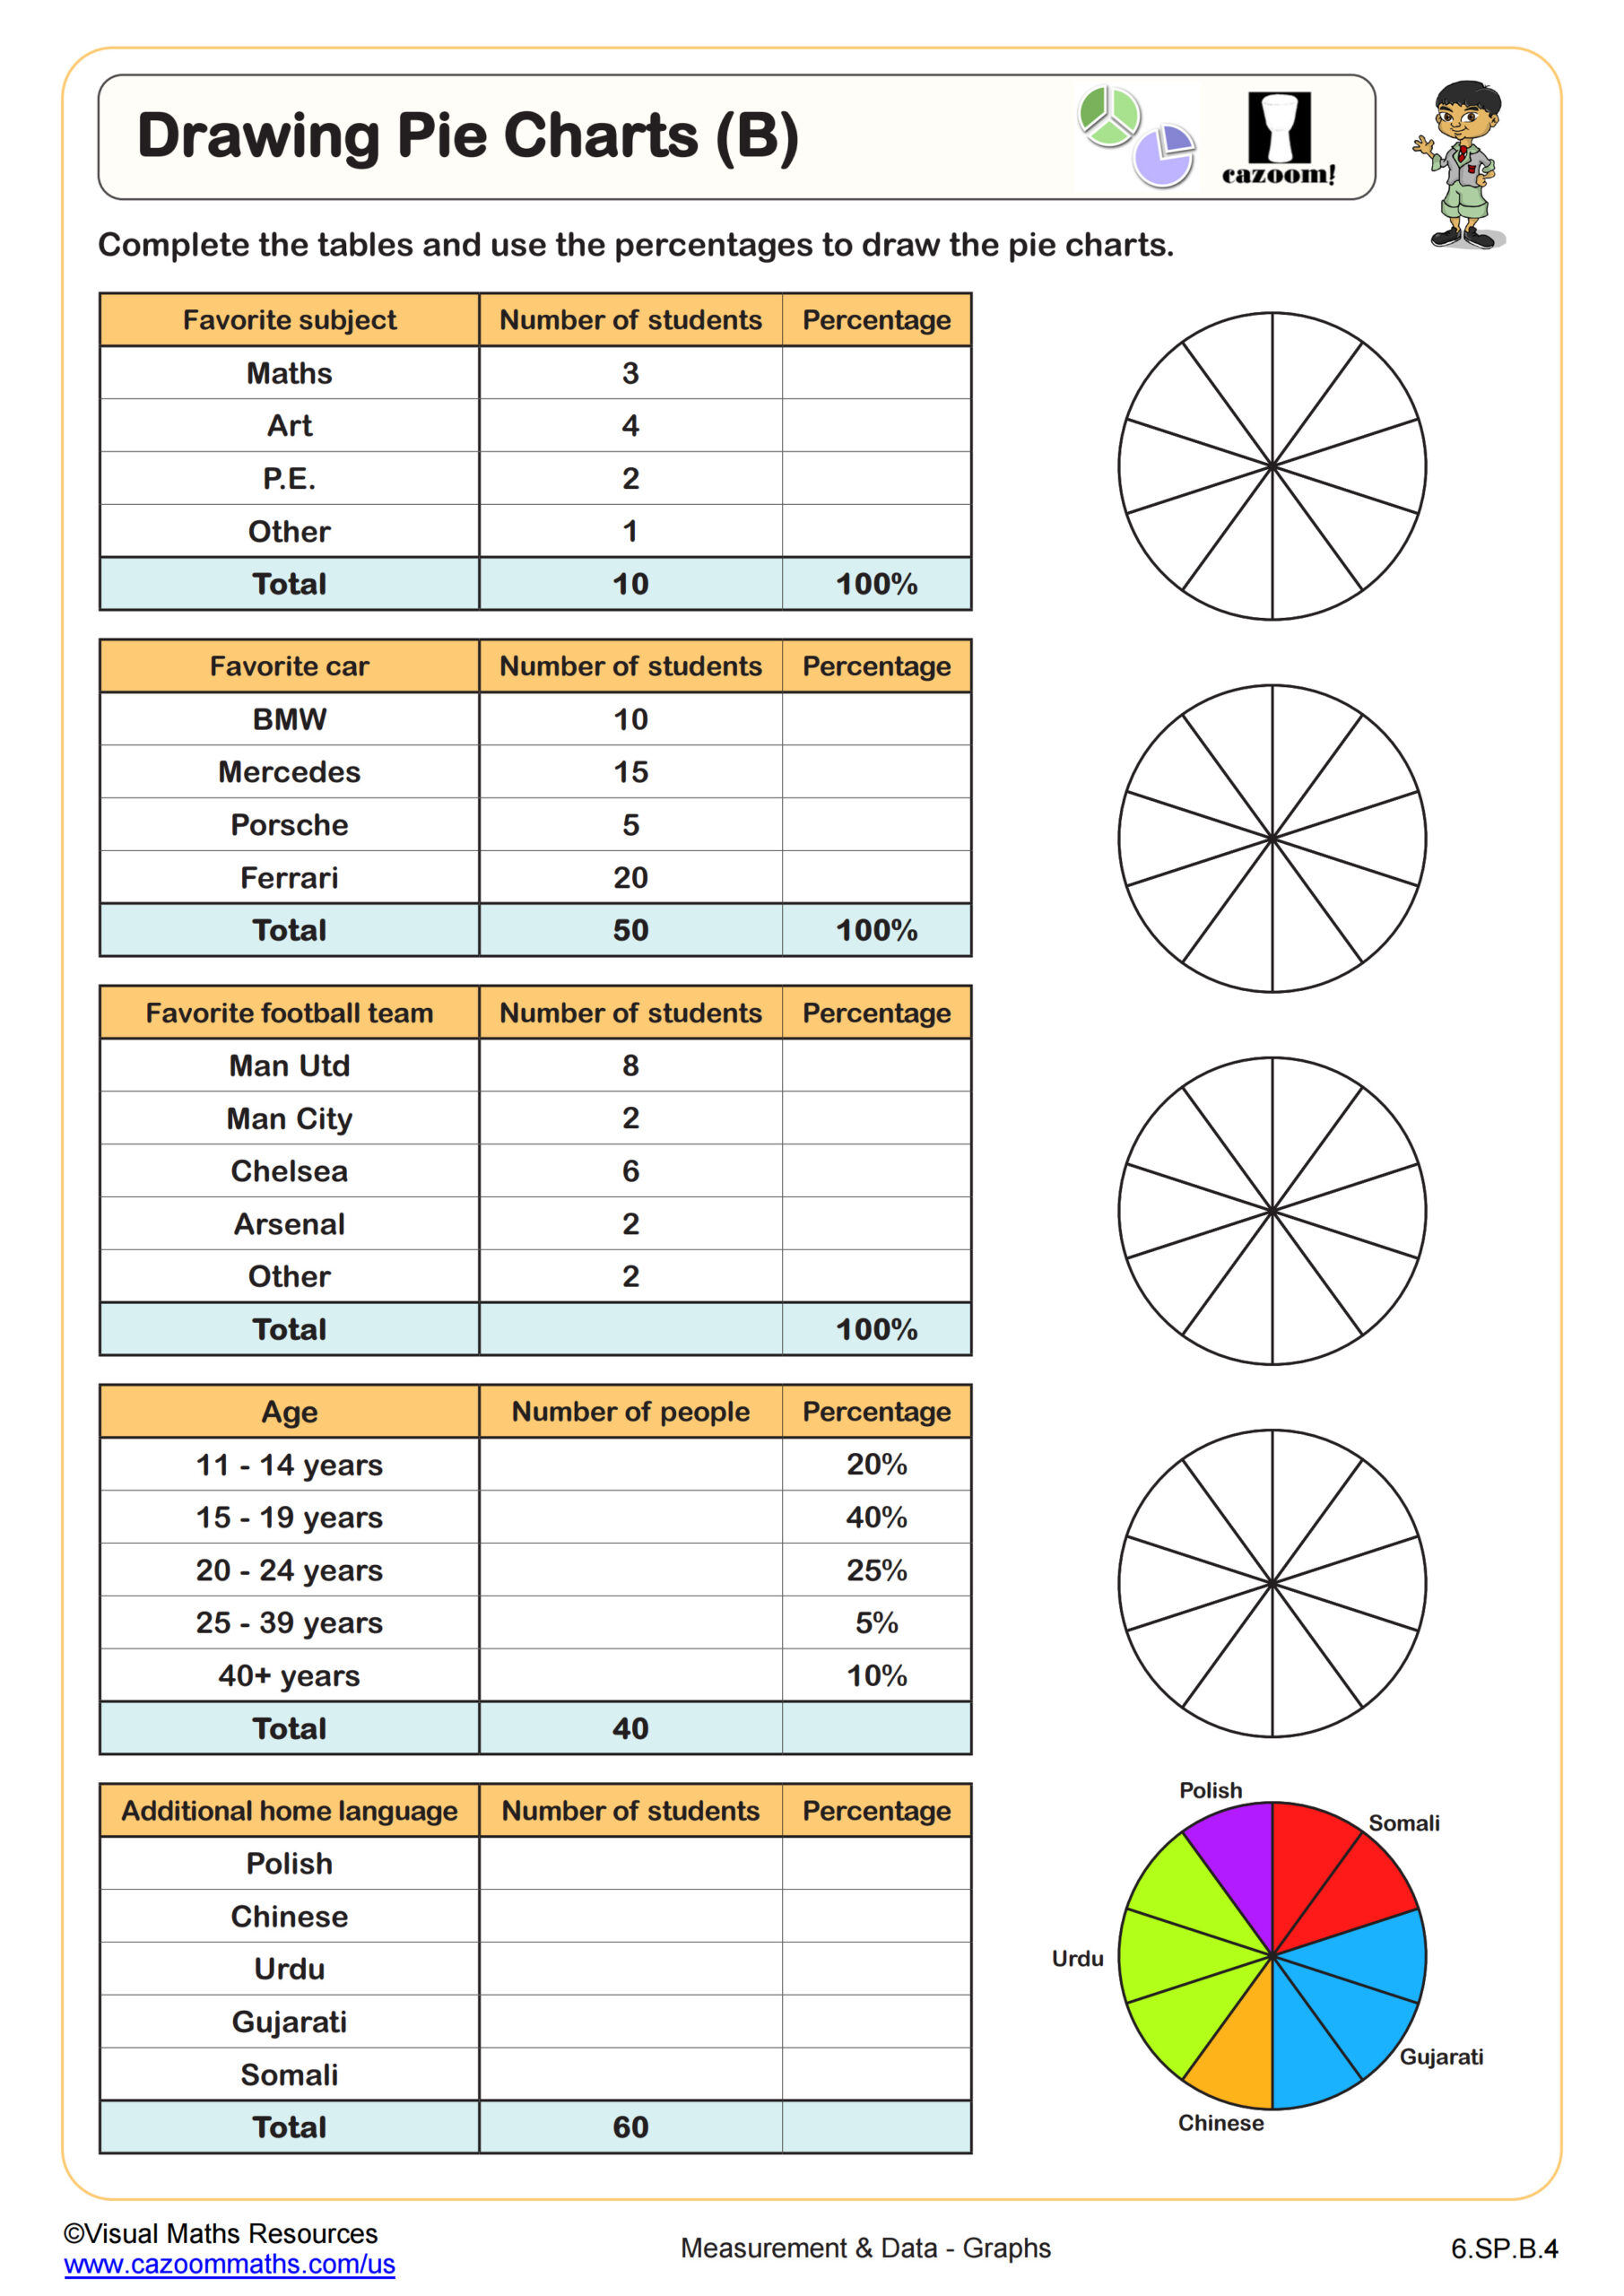
Drawing Pie Charts (B)
Grades: 6th Grade
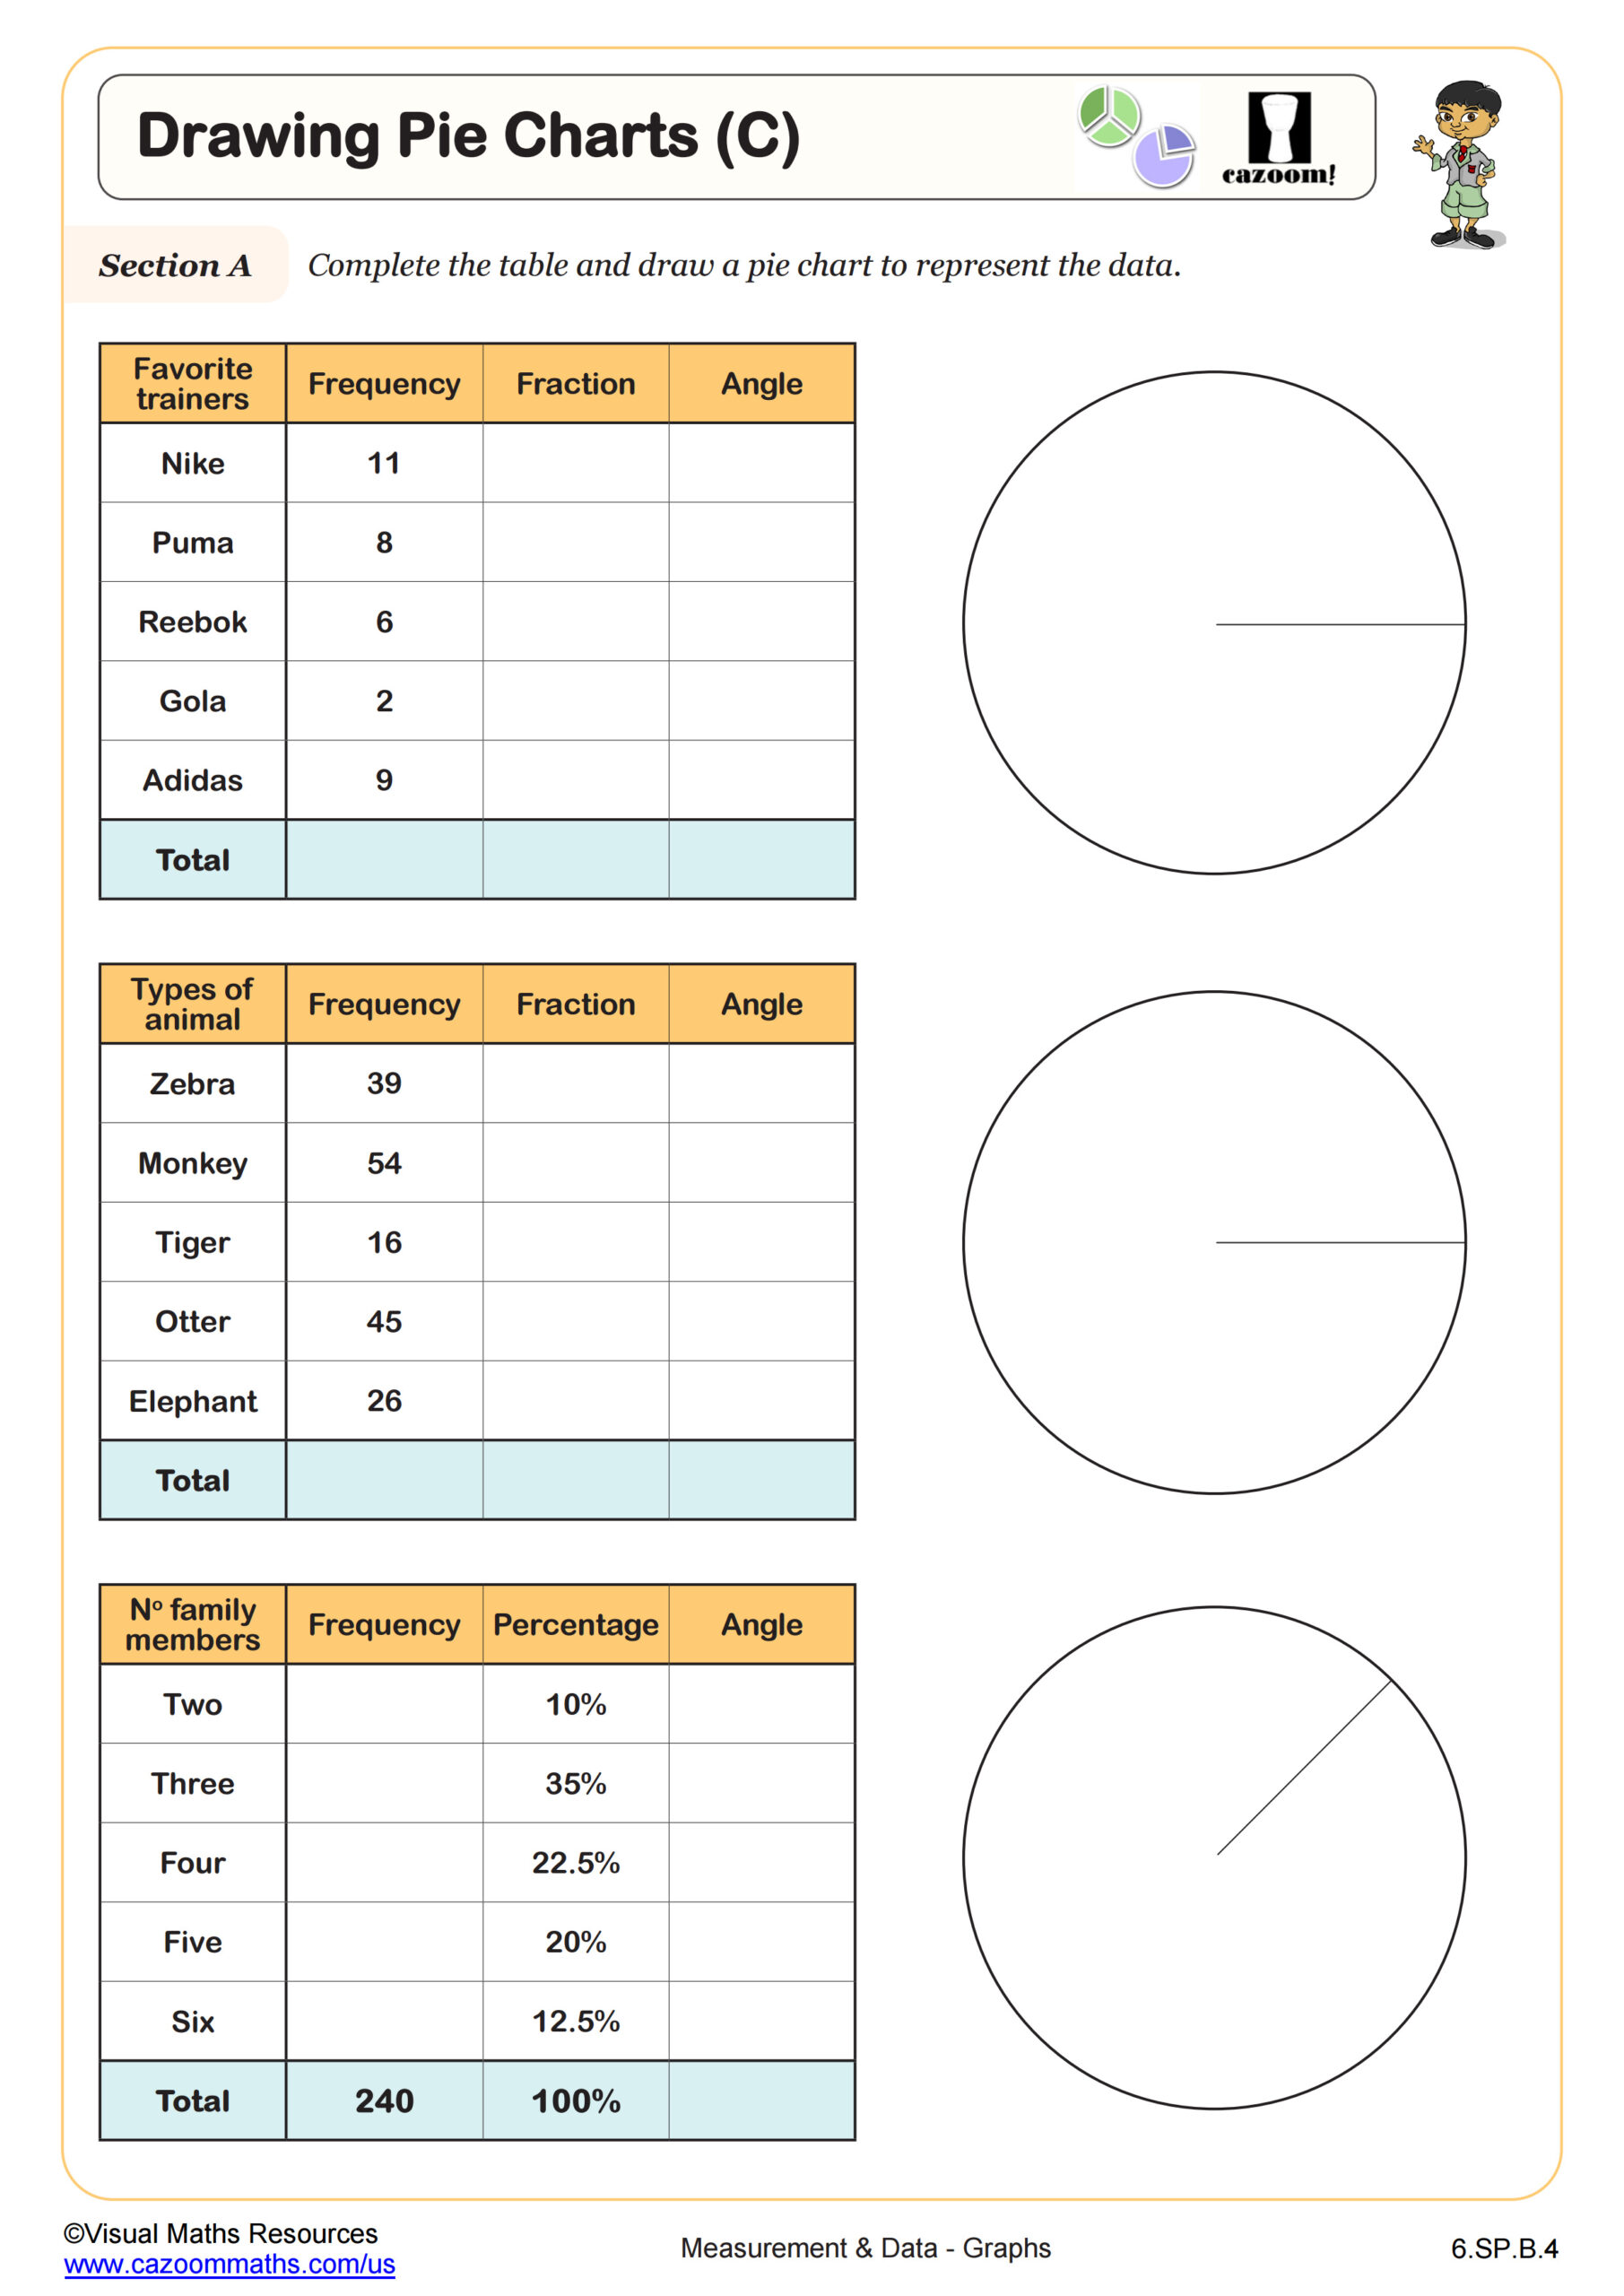
Drawing Pie Charts (C)
Grades: 6th Grade
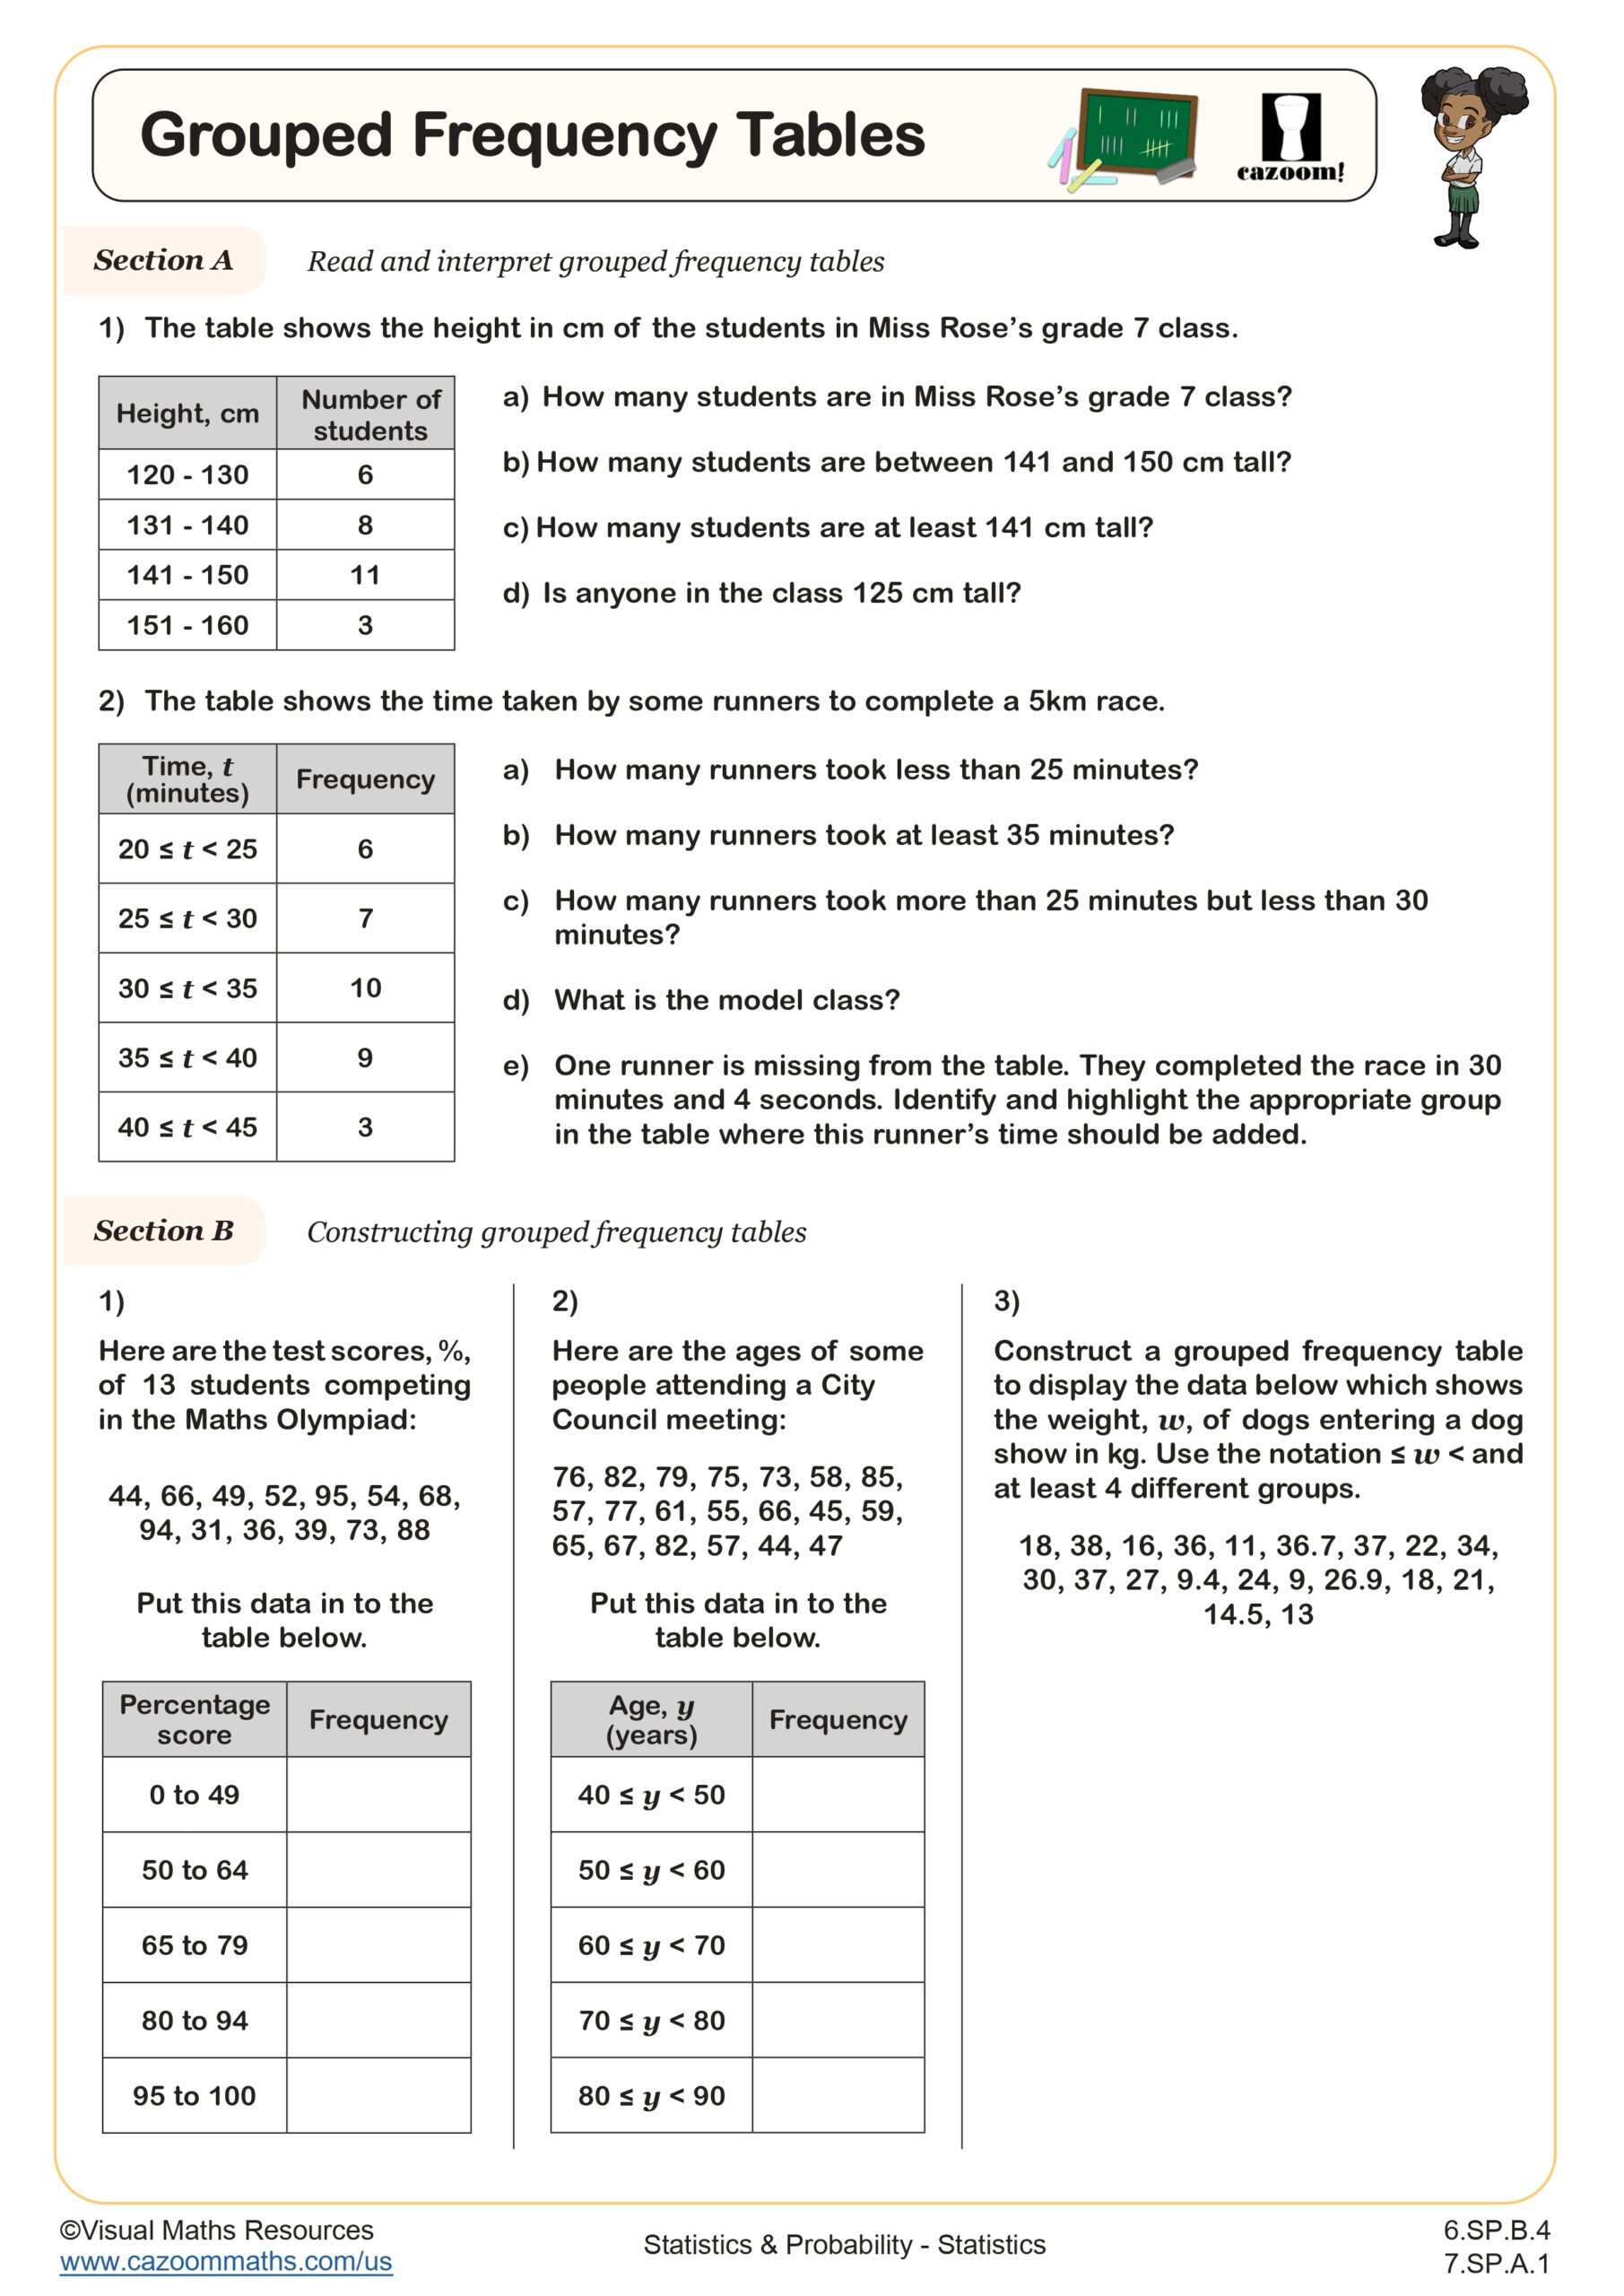
Grouped Frequency Tables
Grades: 6th Grade, 7th Grade
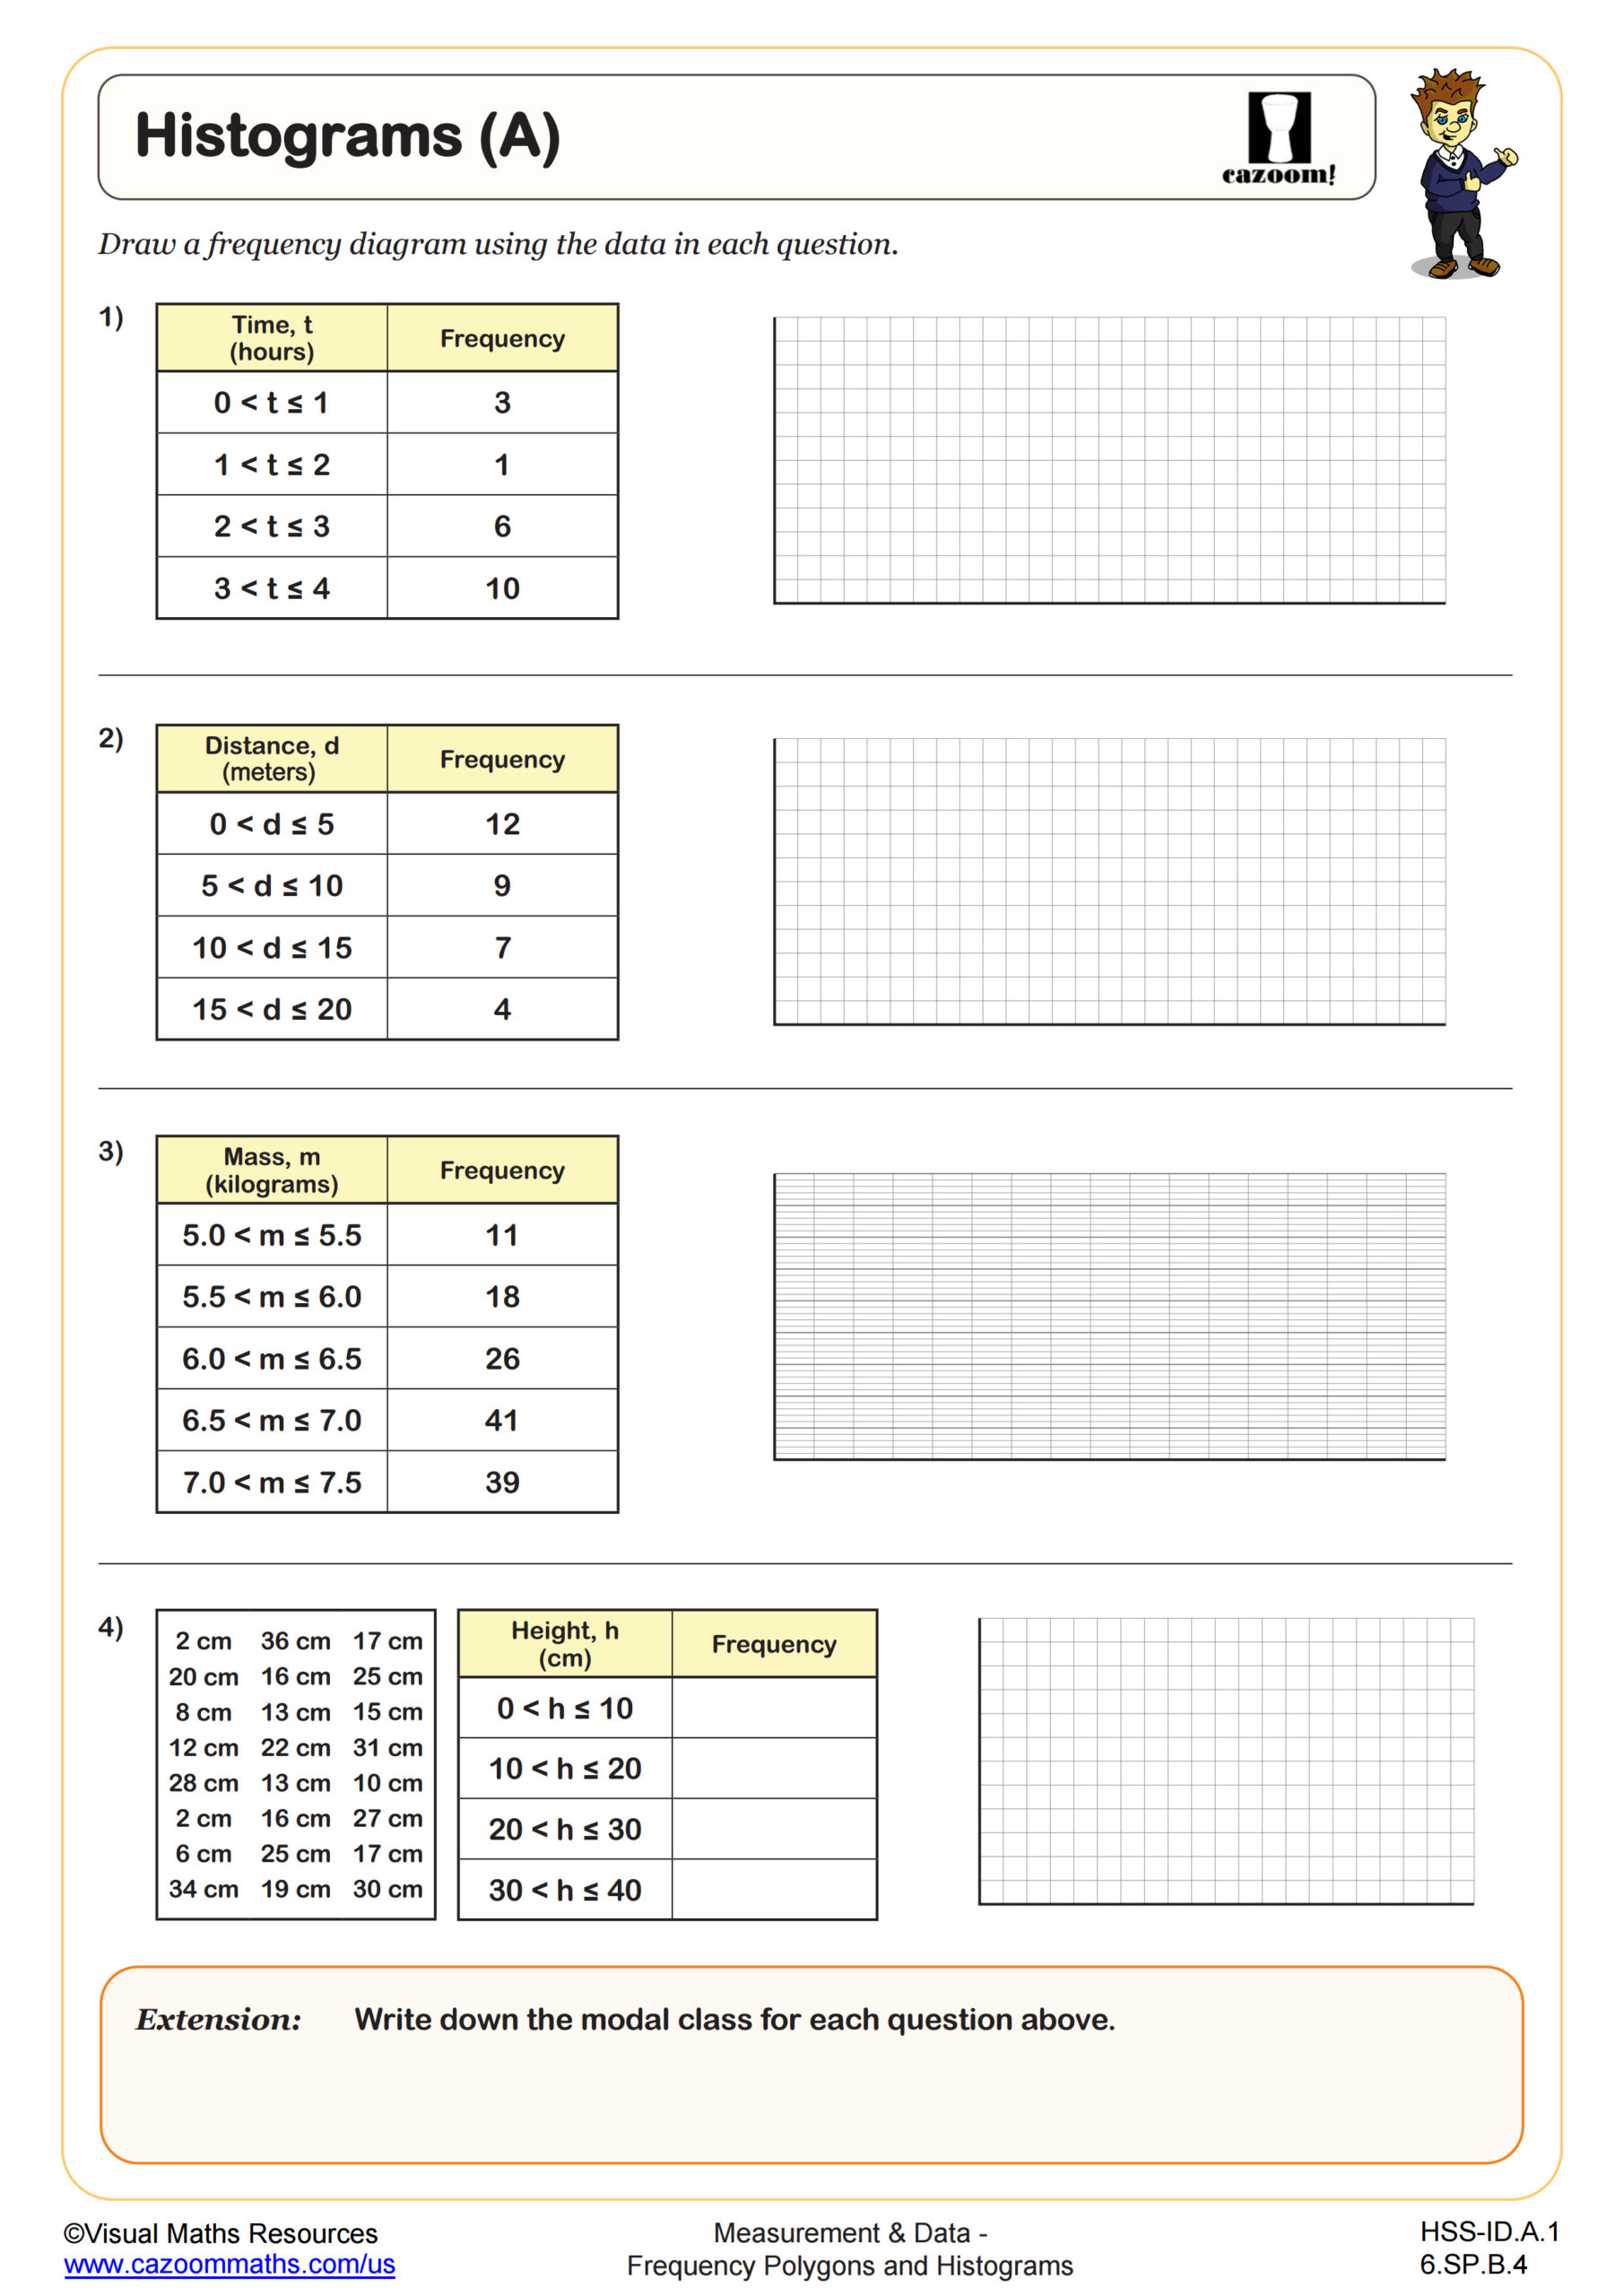
Histograms (A)
Grades: 6th Grade, Algebra I
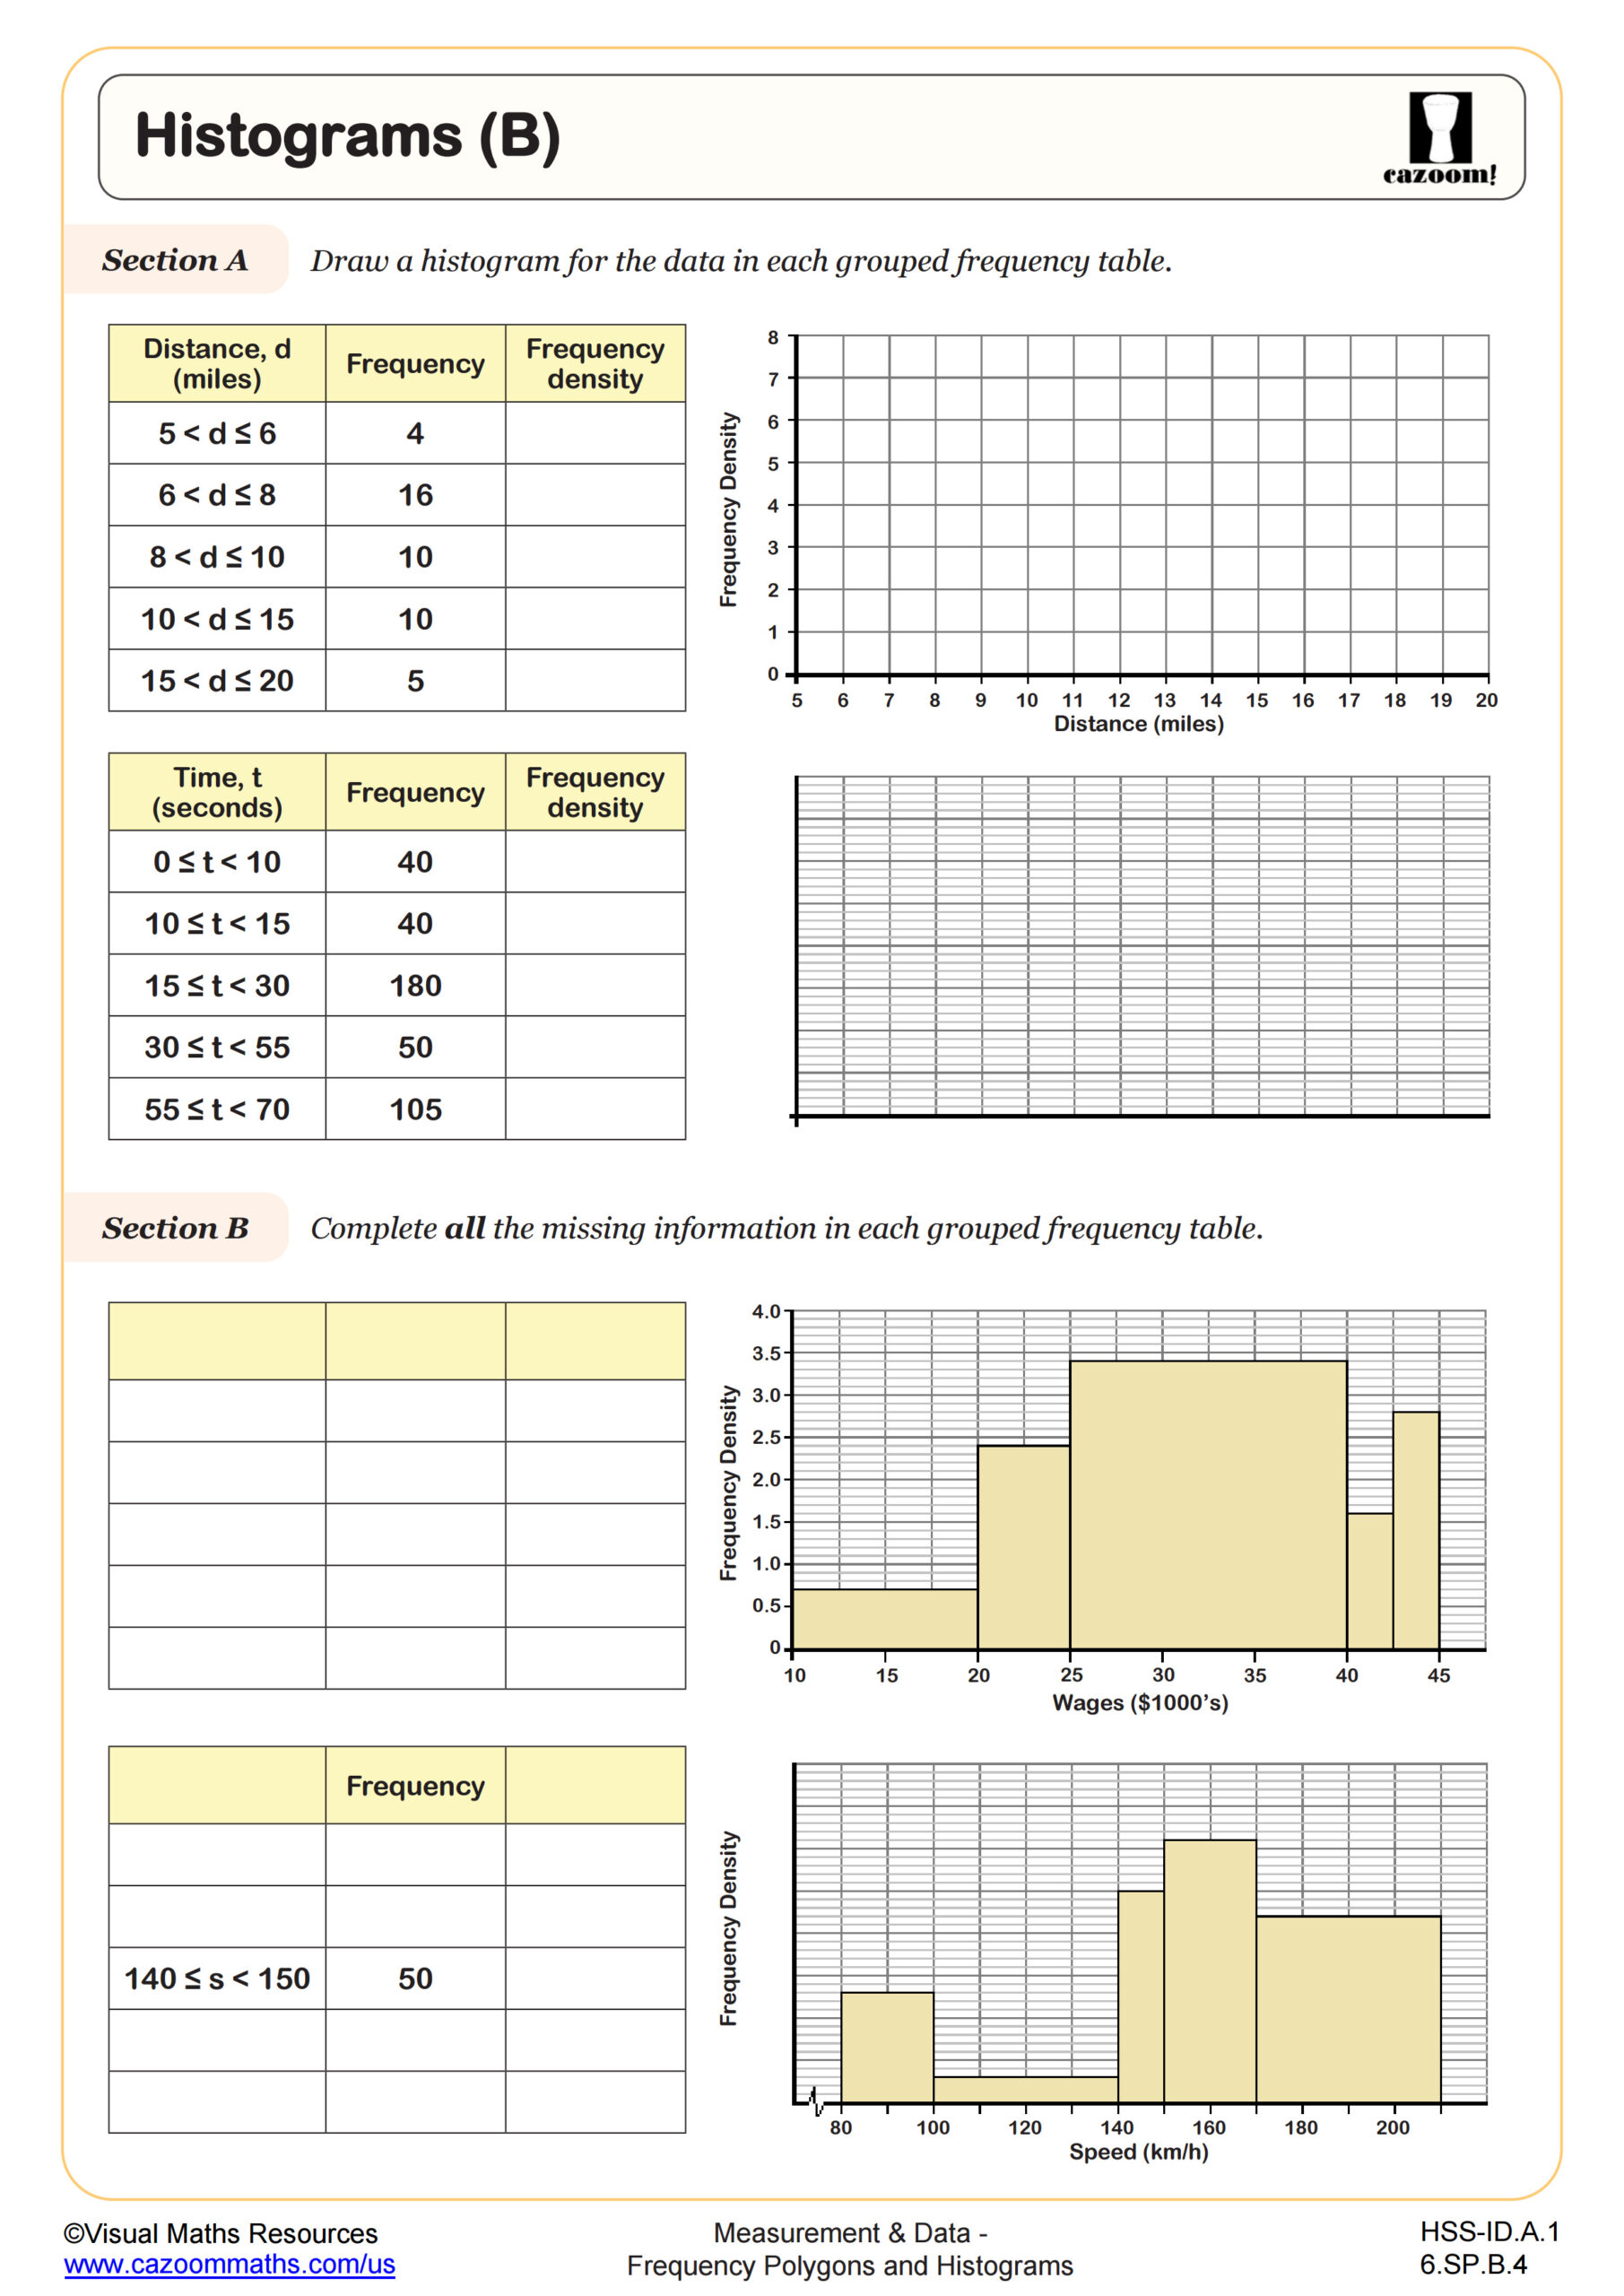
Histograms (B)
Grades: 6th Grade, Algebra I
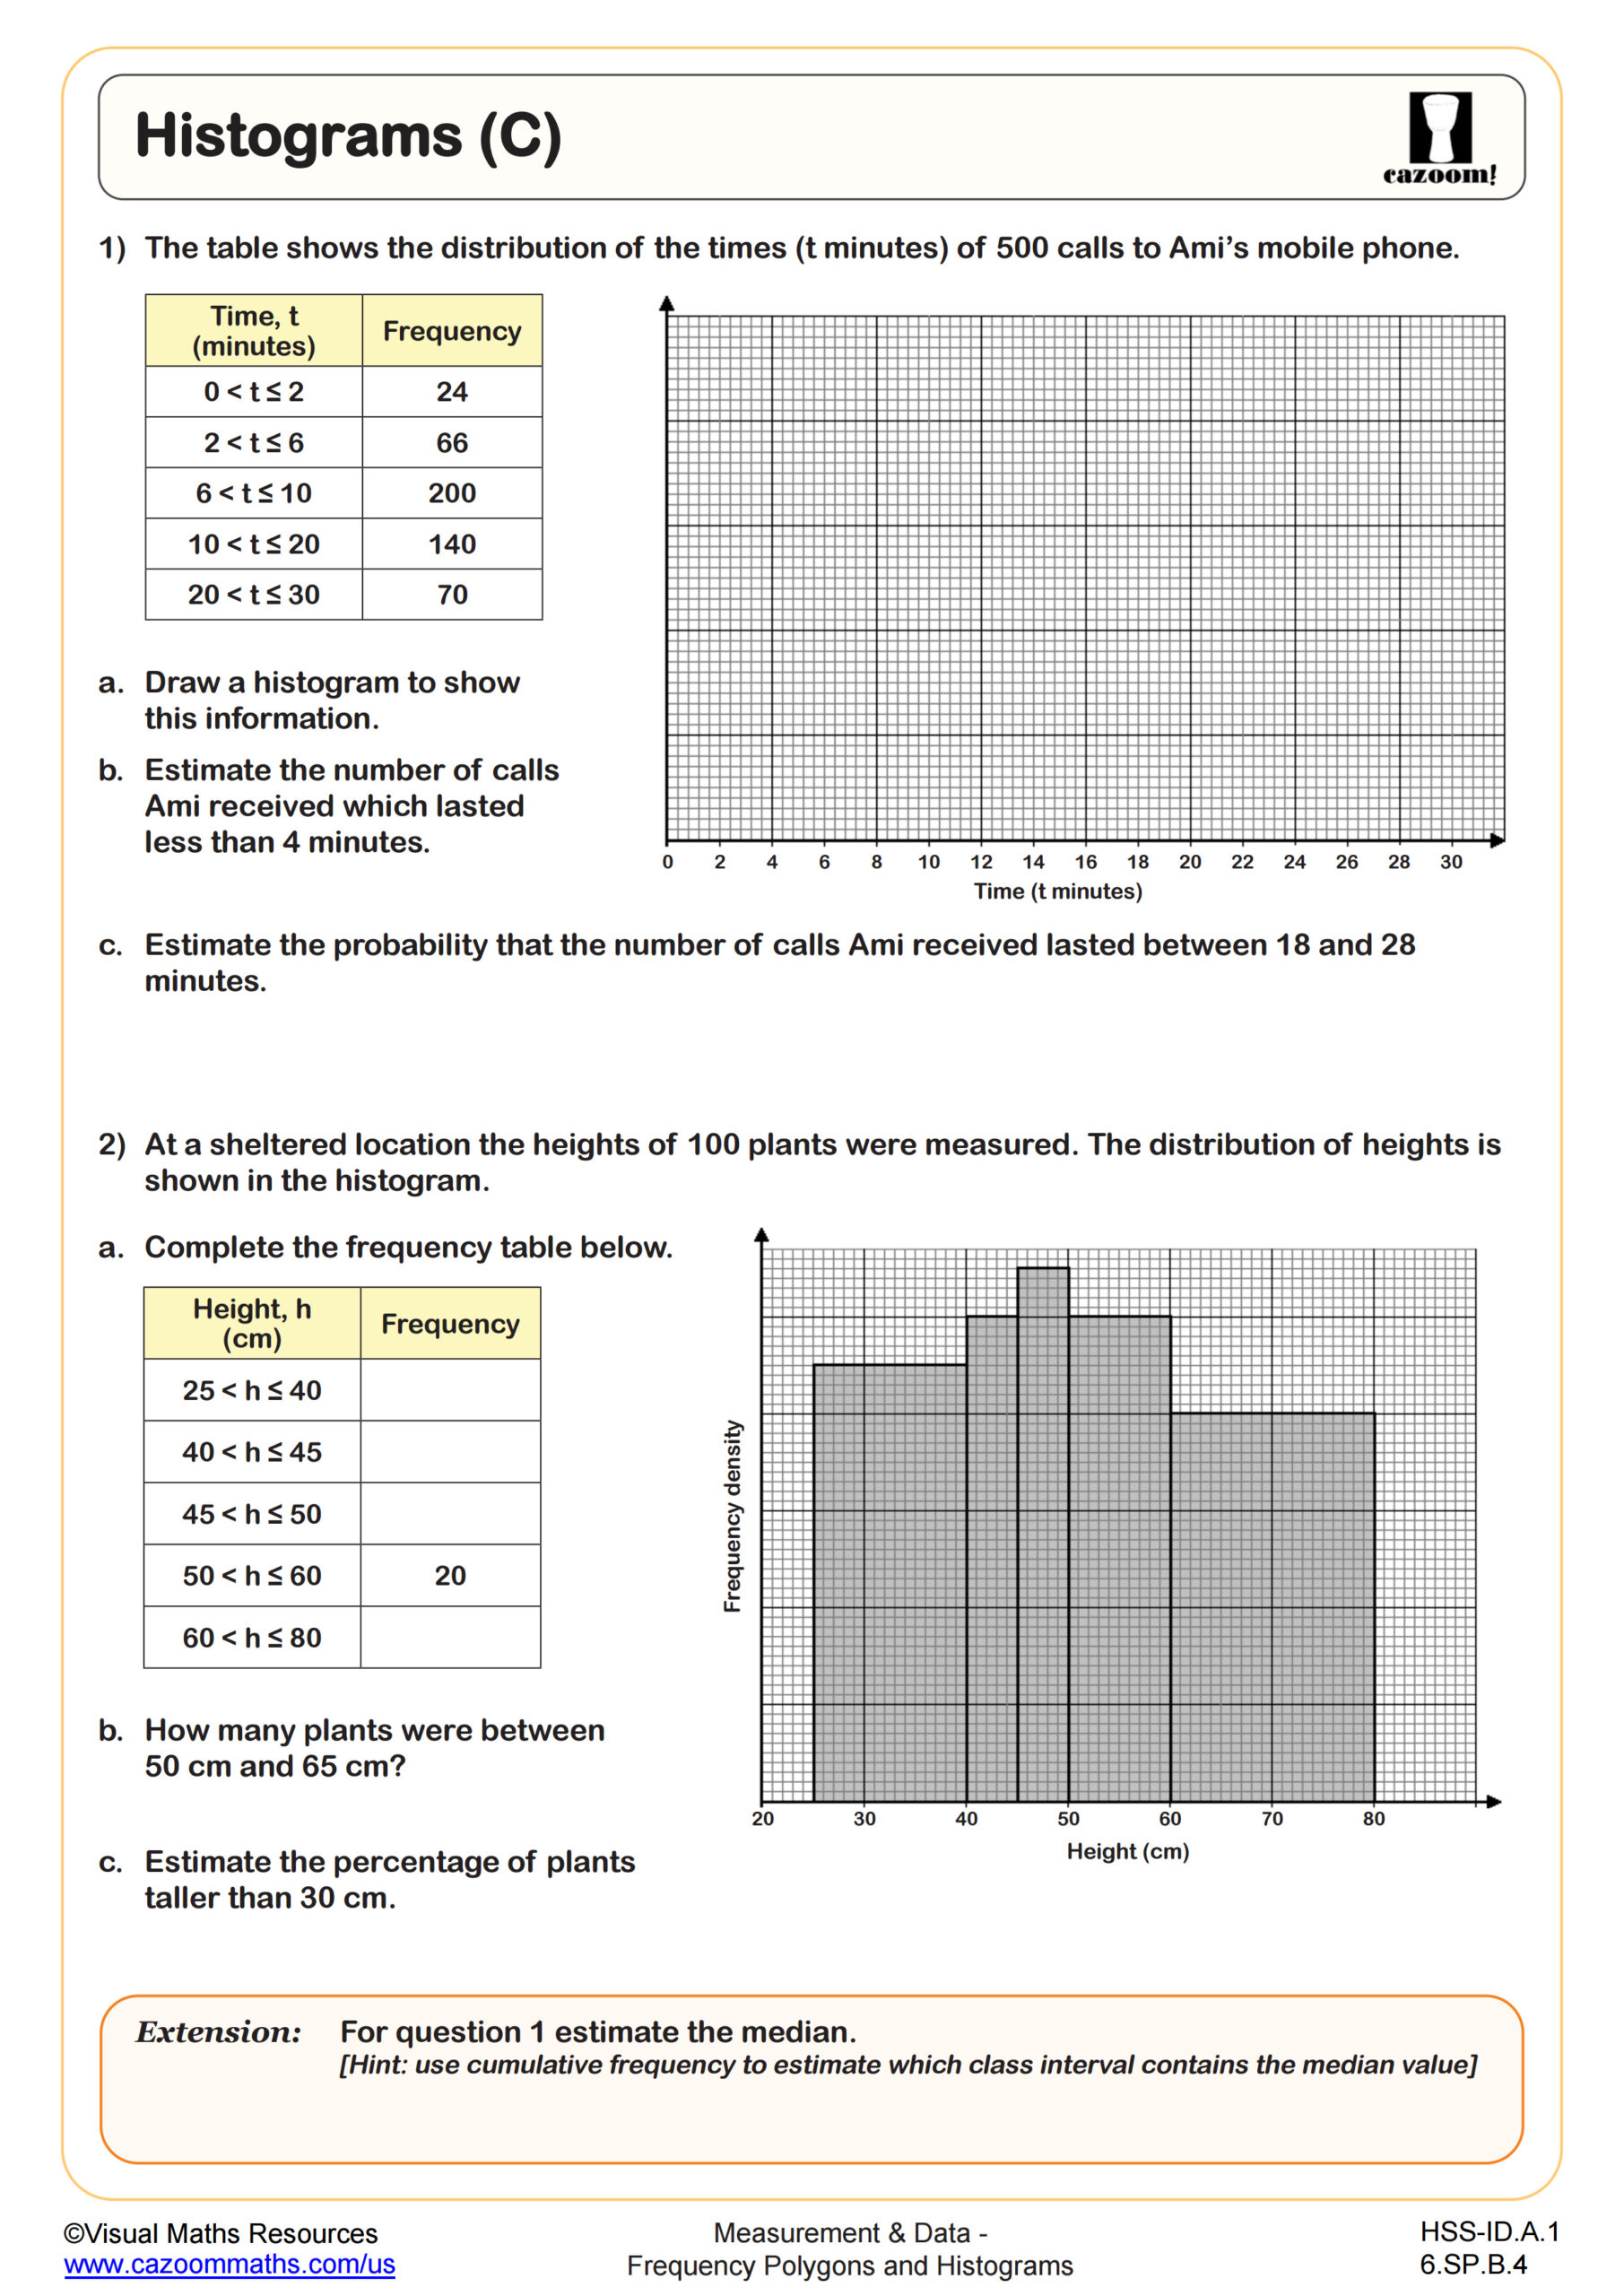
Histograms (C)
Grades: 6th Grade, Algebra I
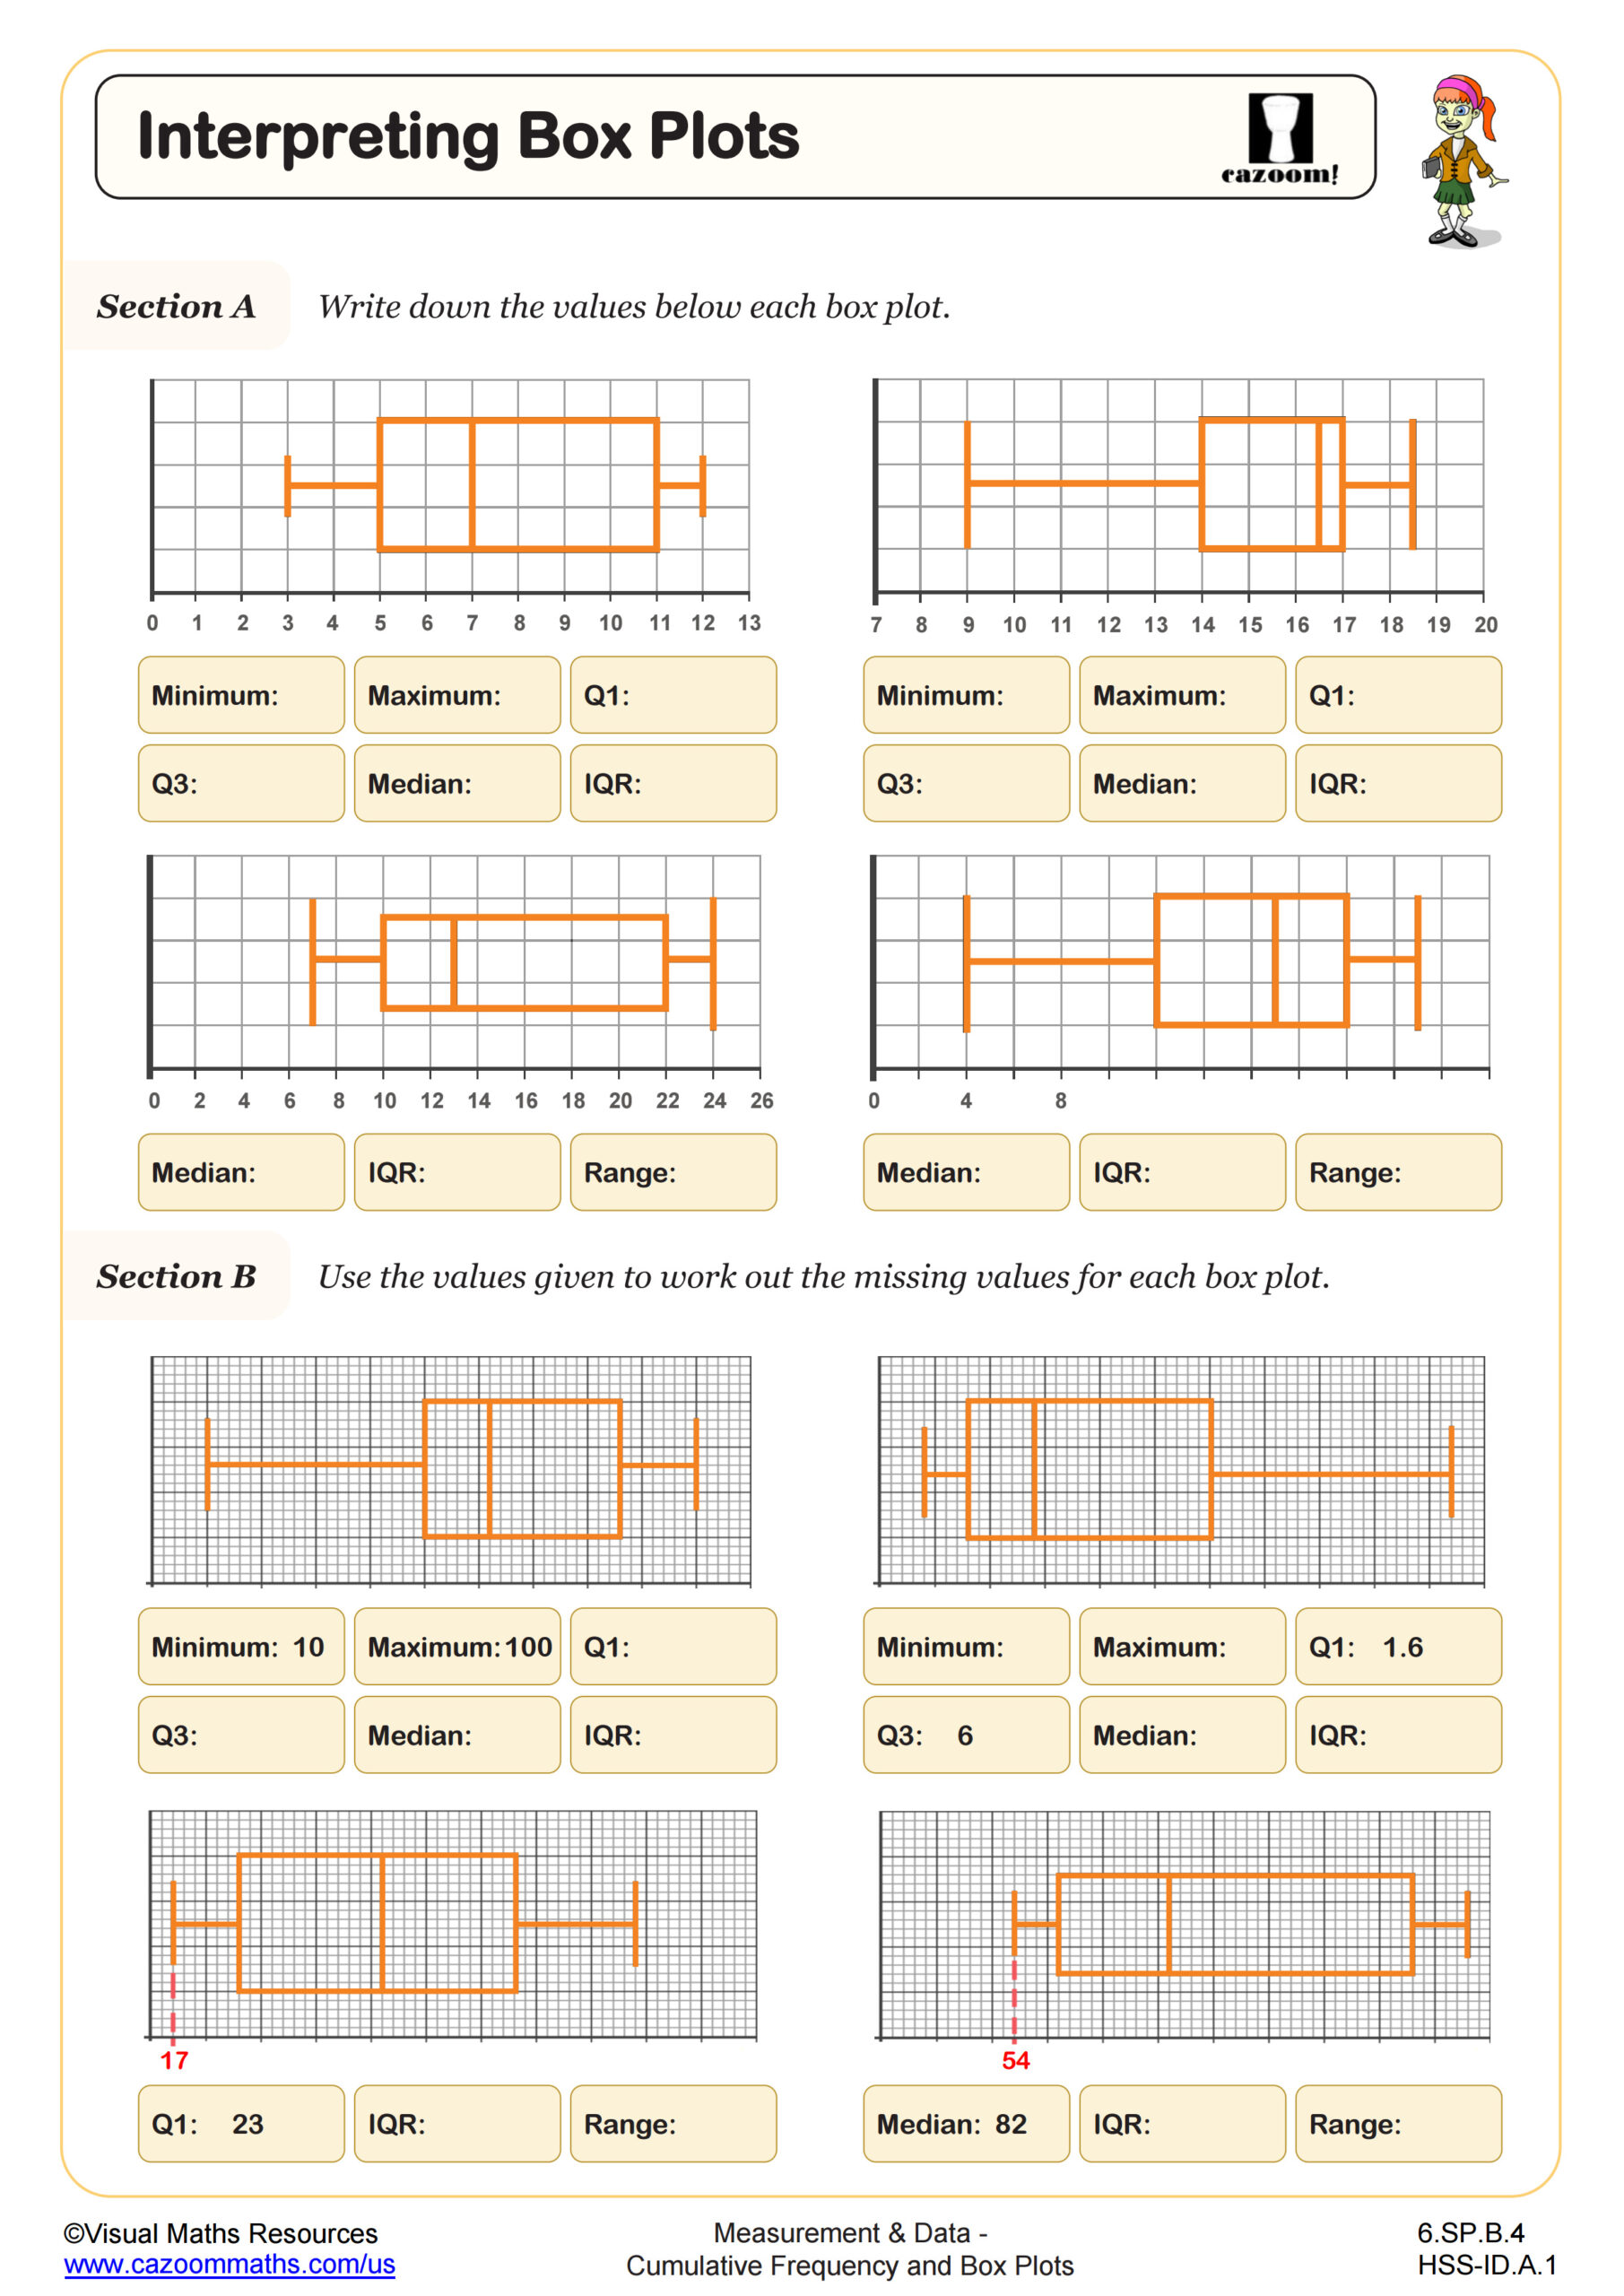
Interpreting Boxplots
Grades: 6th Grade, Algebra I
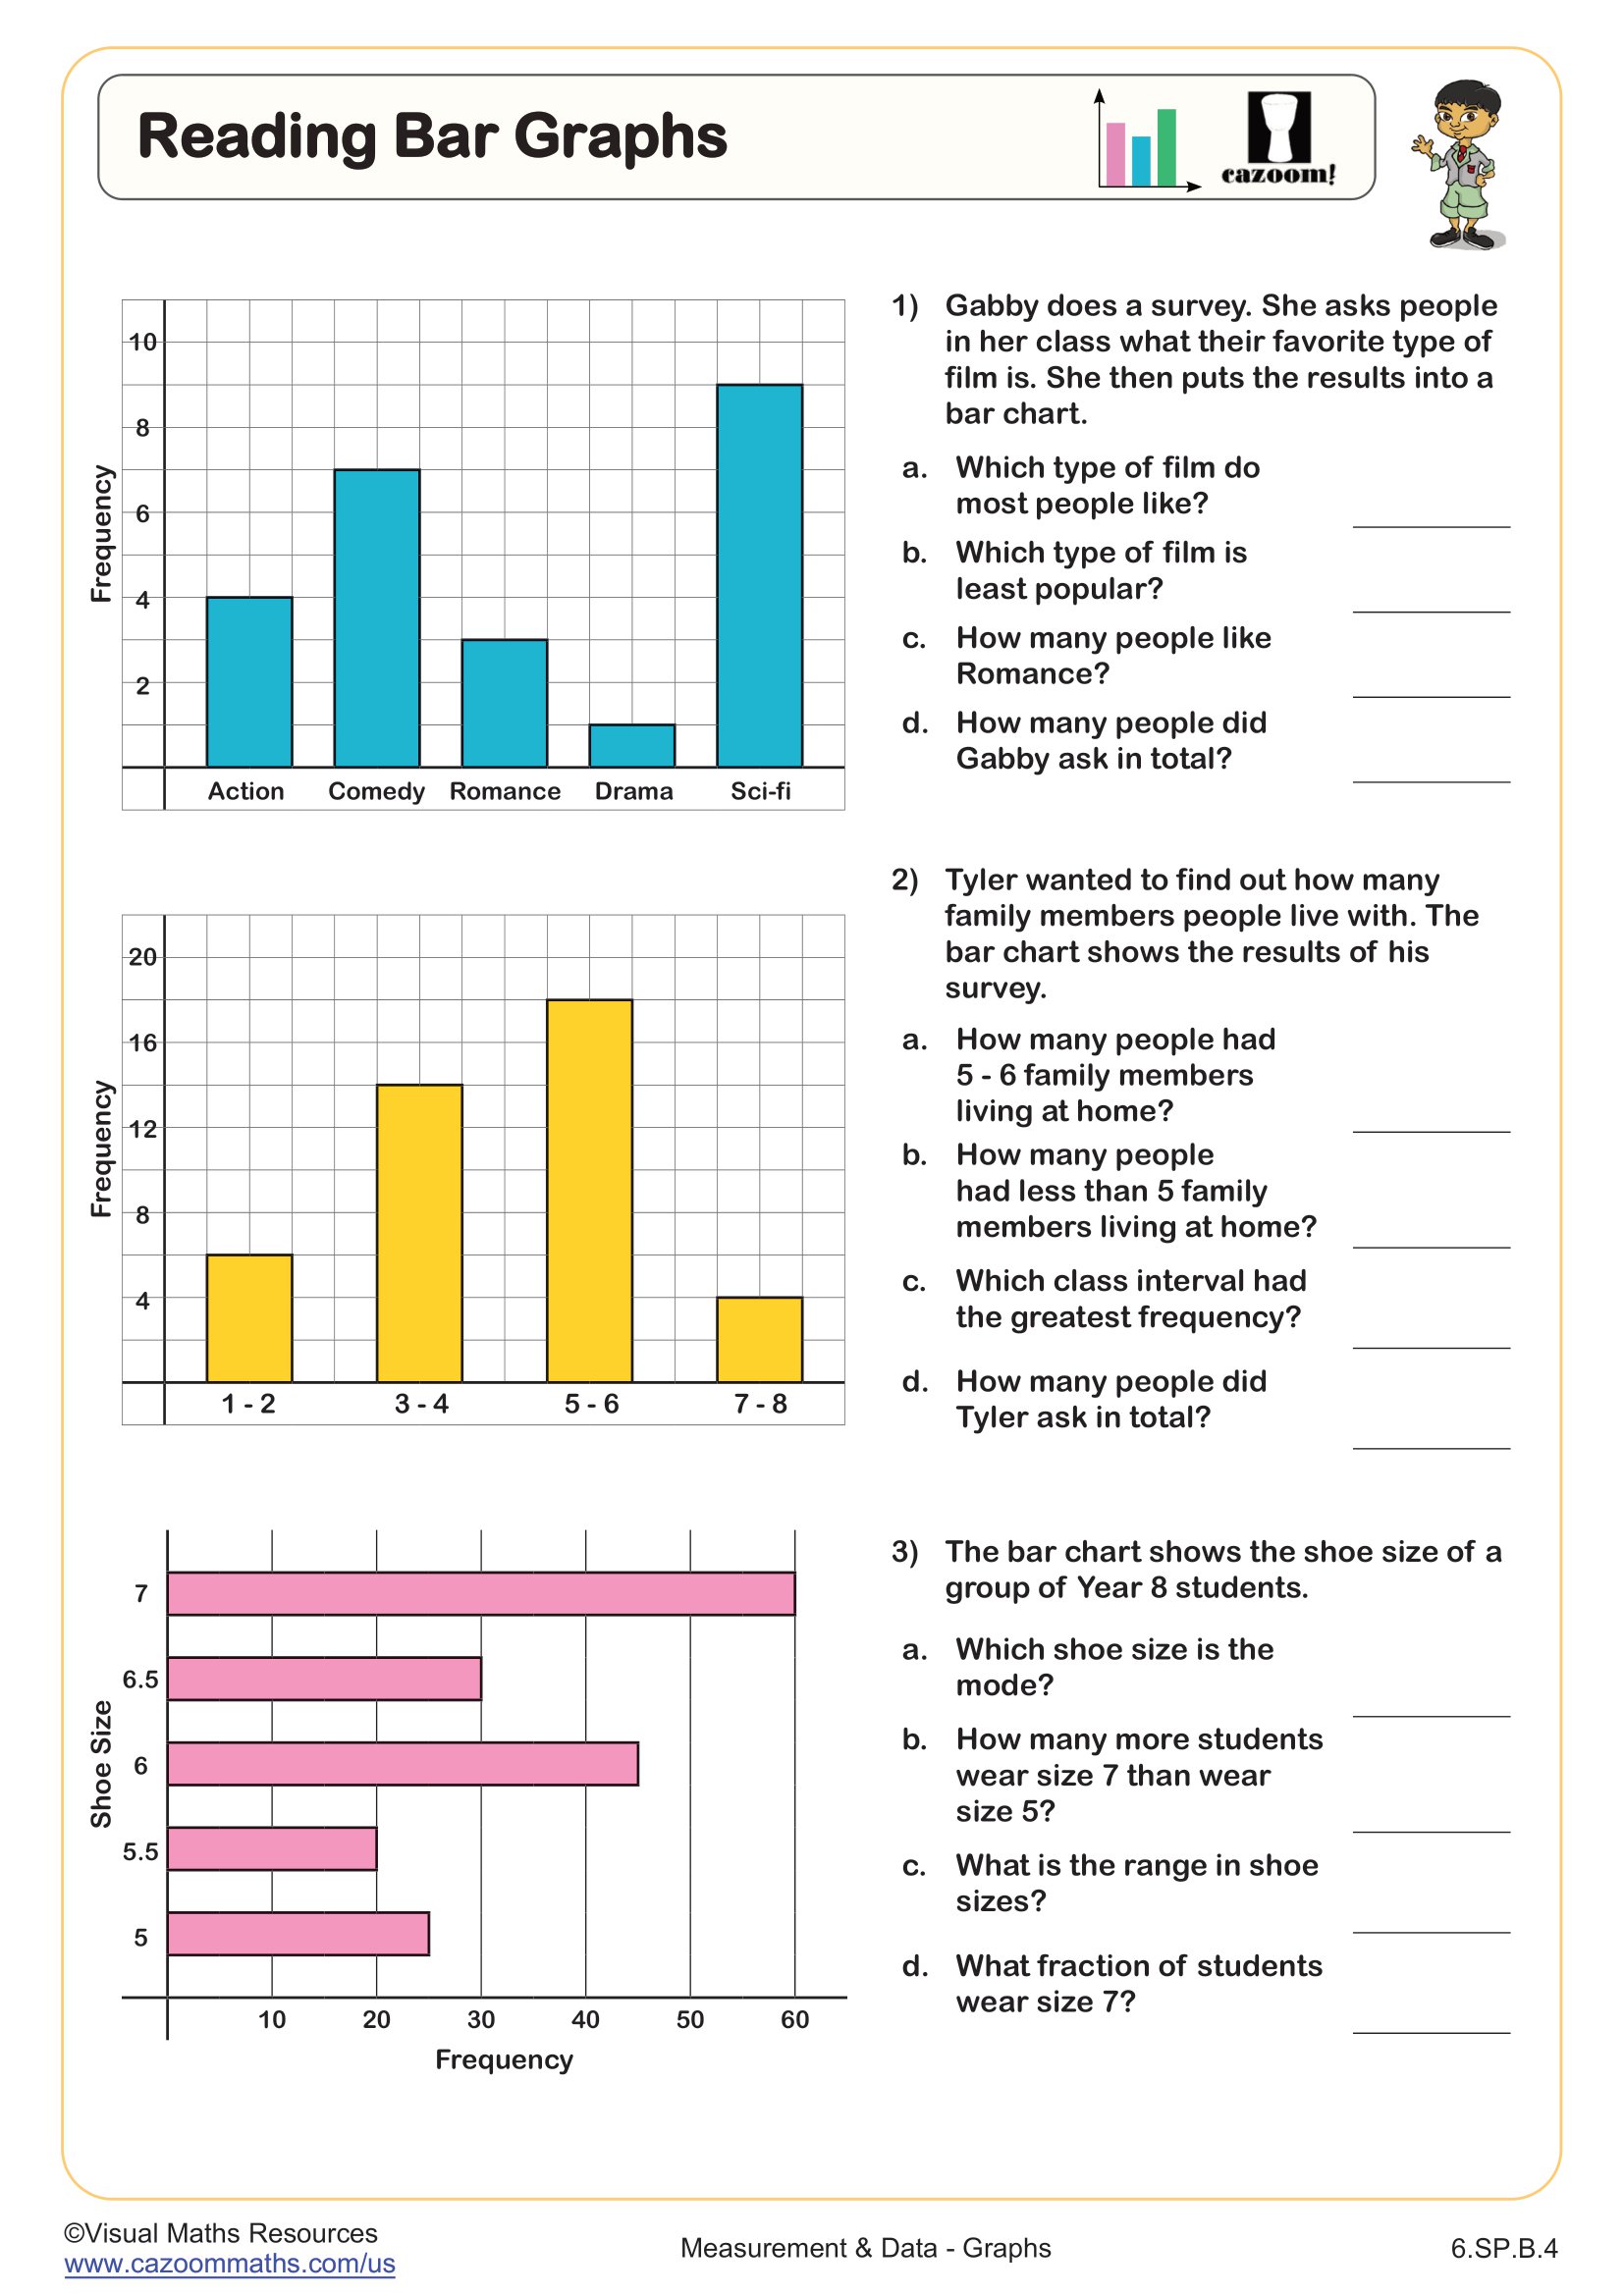
Reading Bar Graphs
Grades: 6th Grade
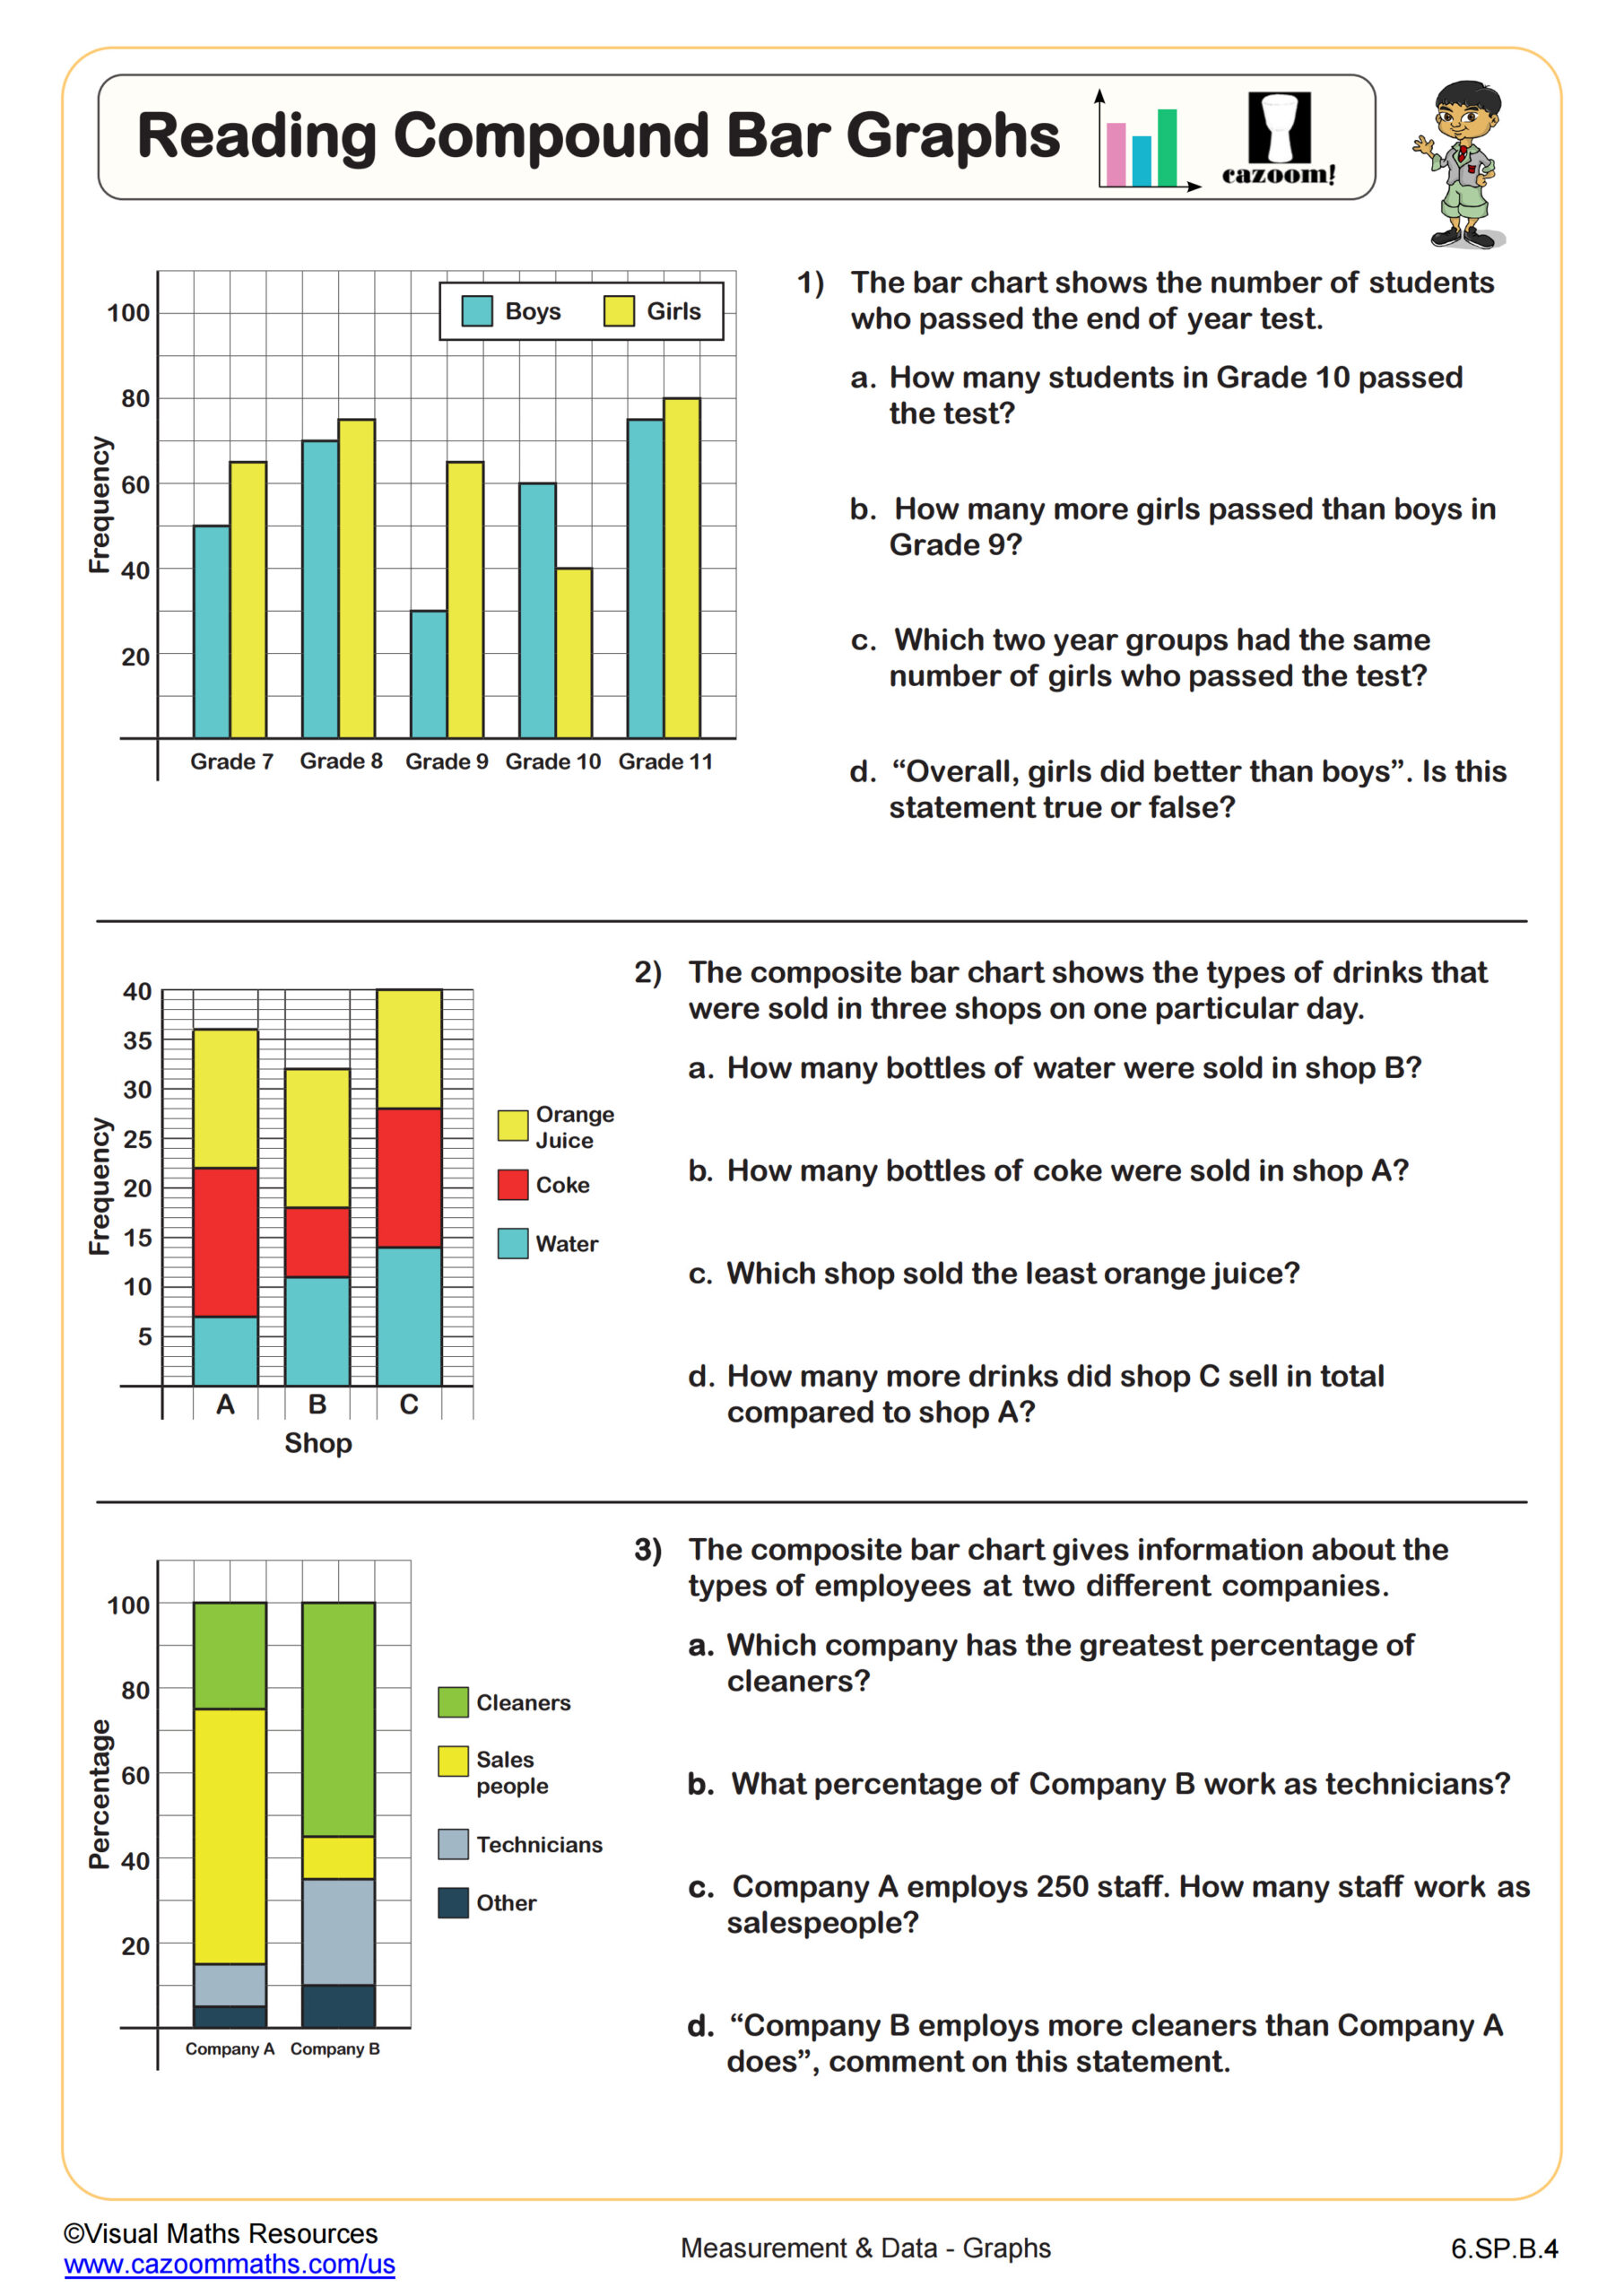
Reading Compound Bar Graphs
Grades: 6th Grade
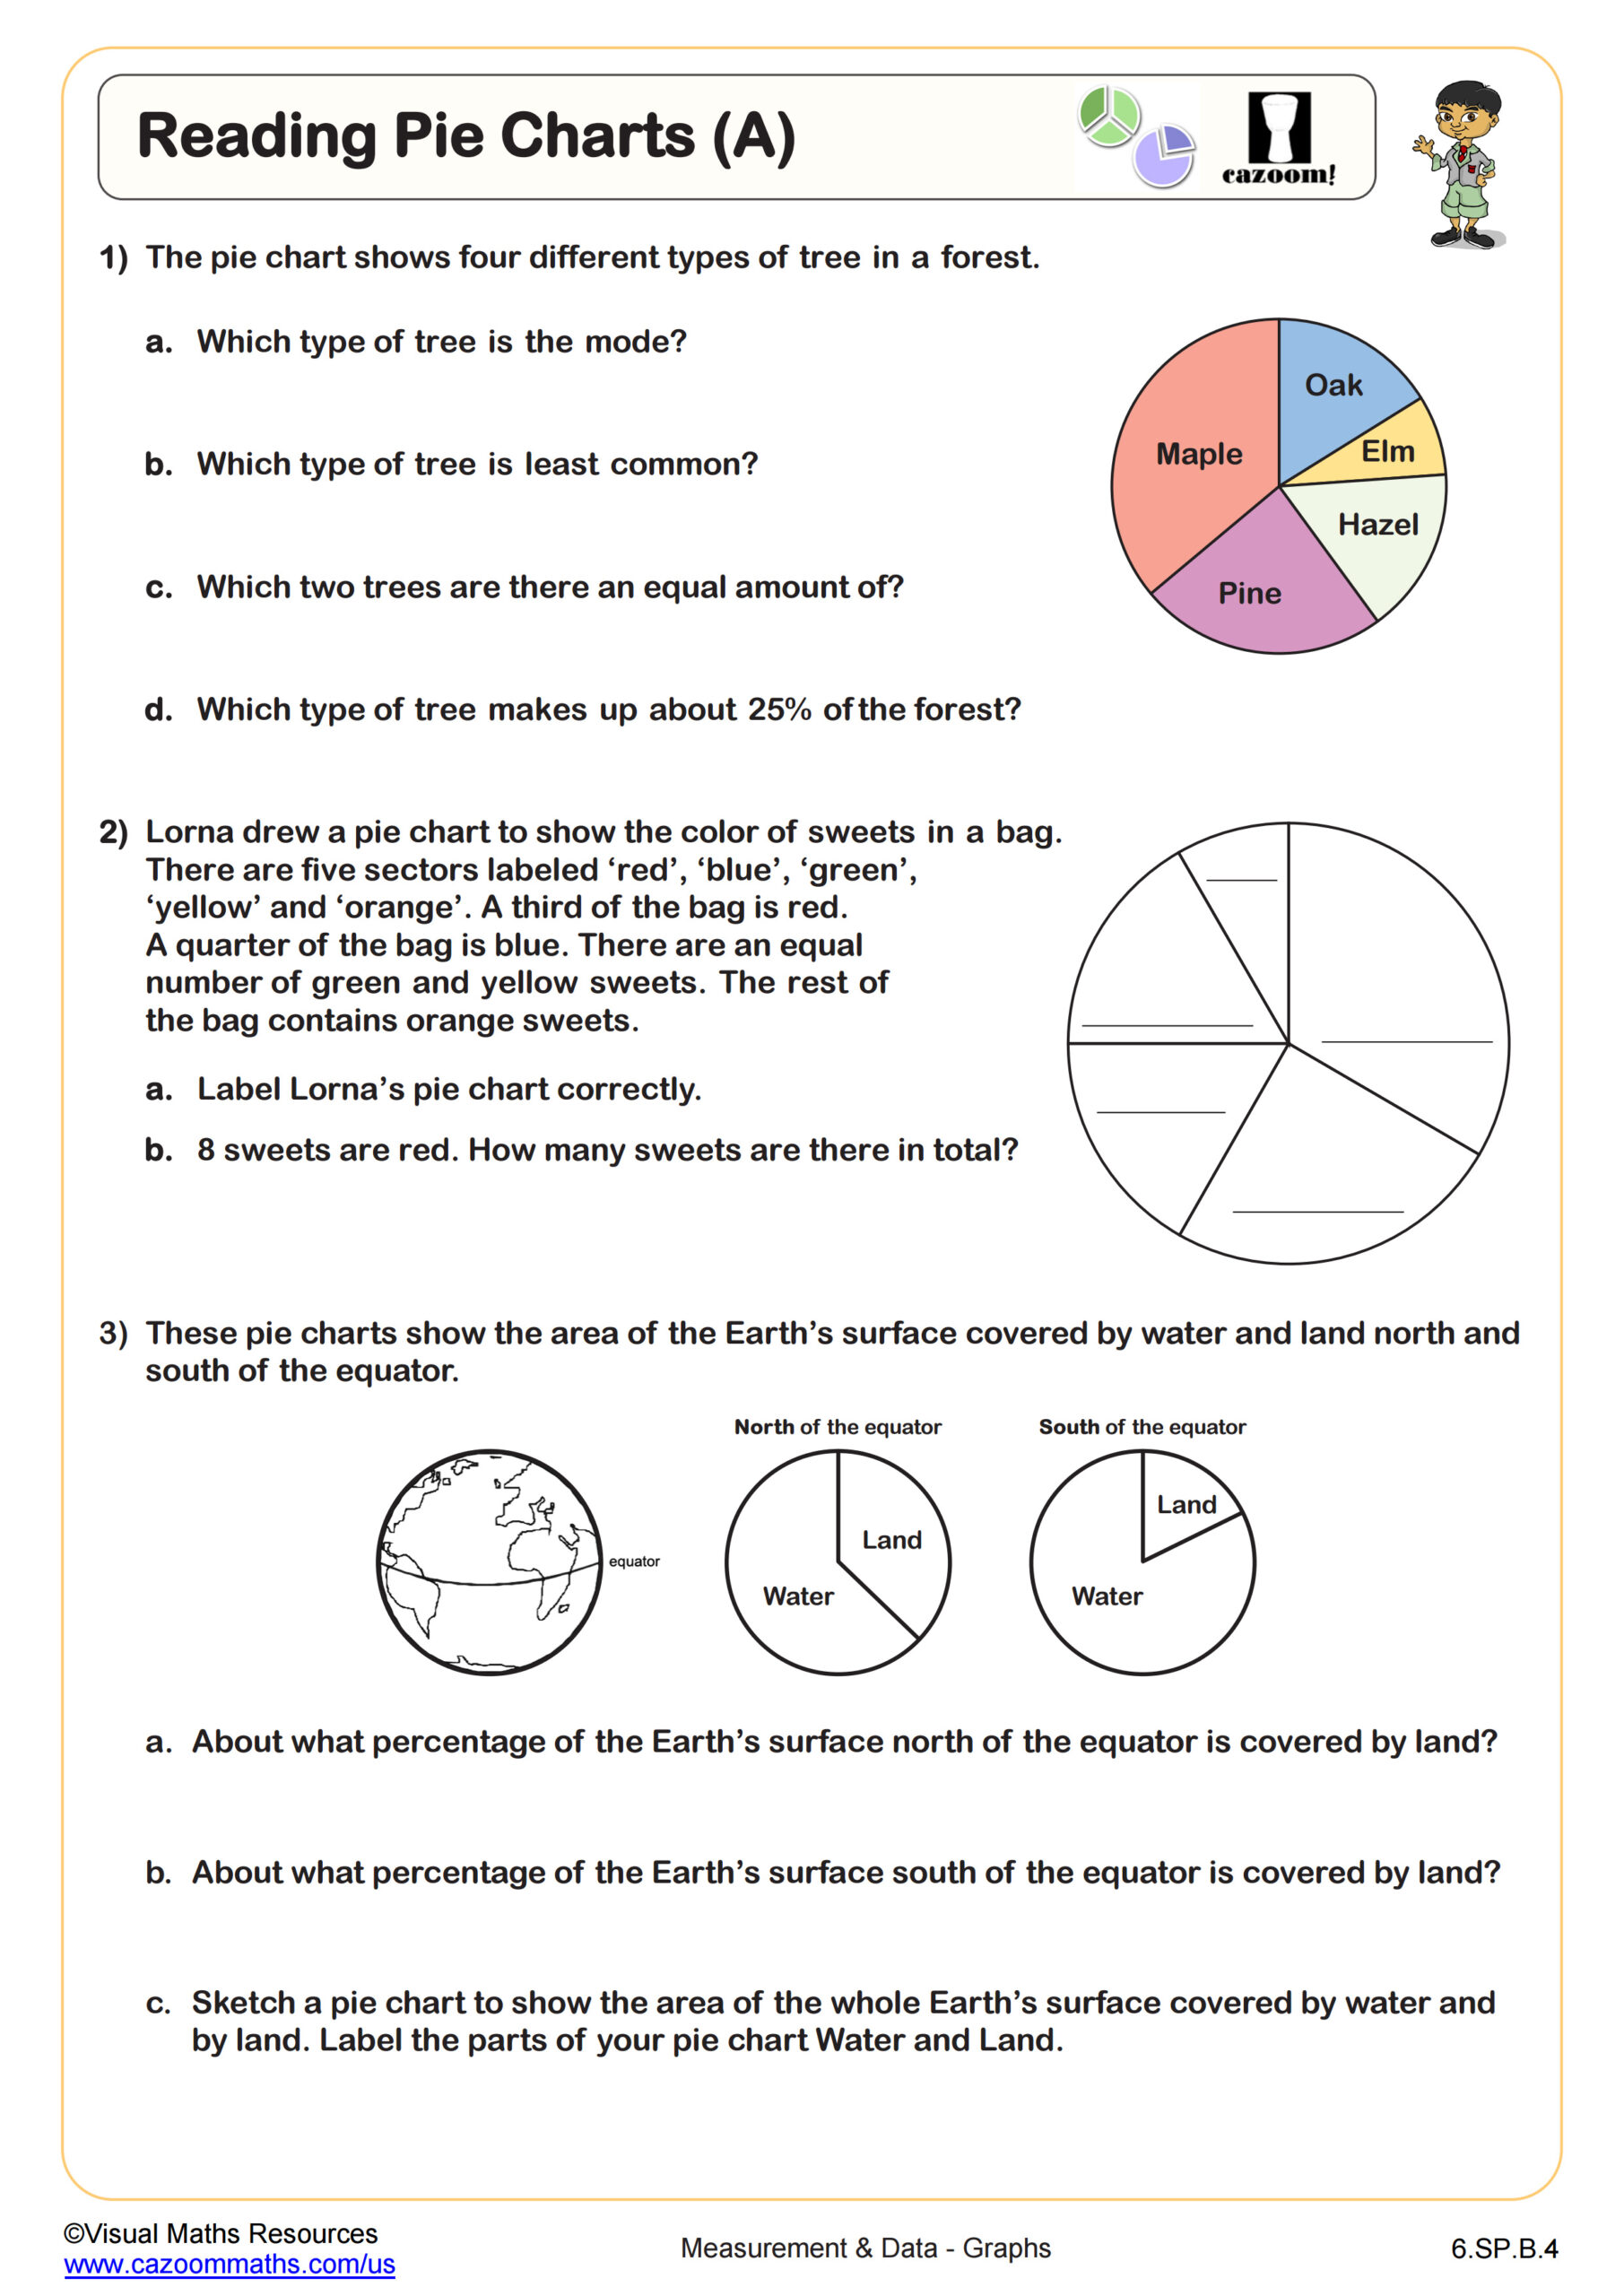
Reading Pie Charts (A)
Grades: 6th Grade
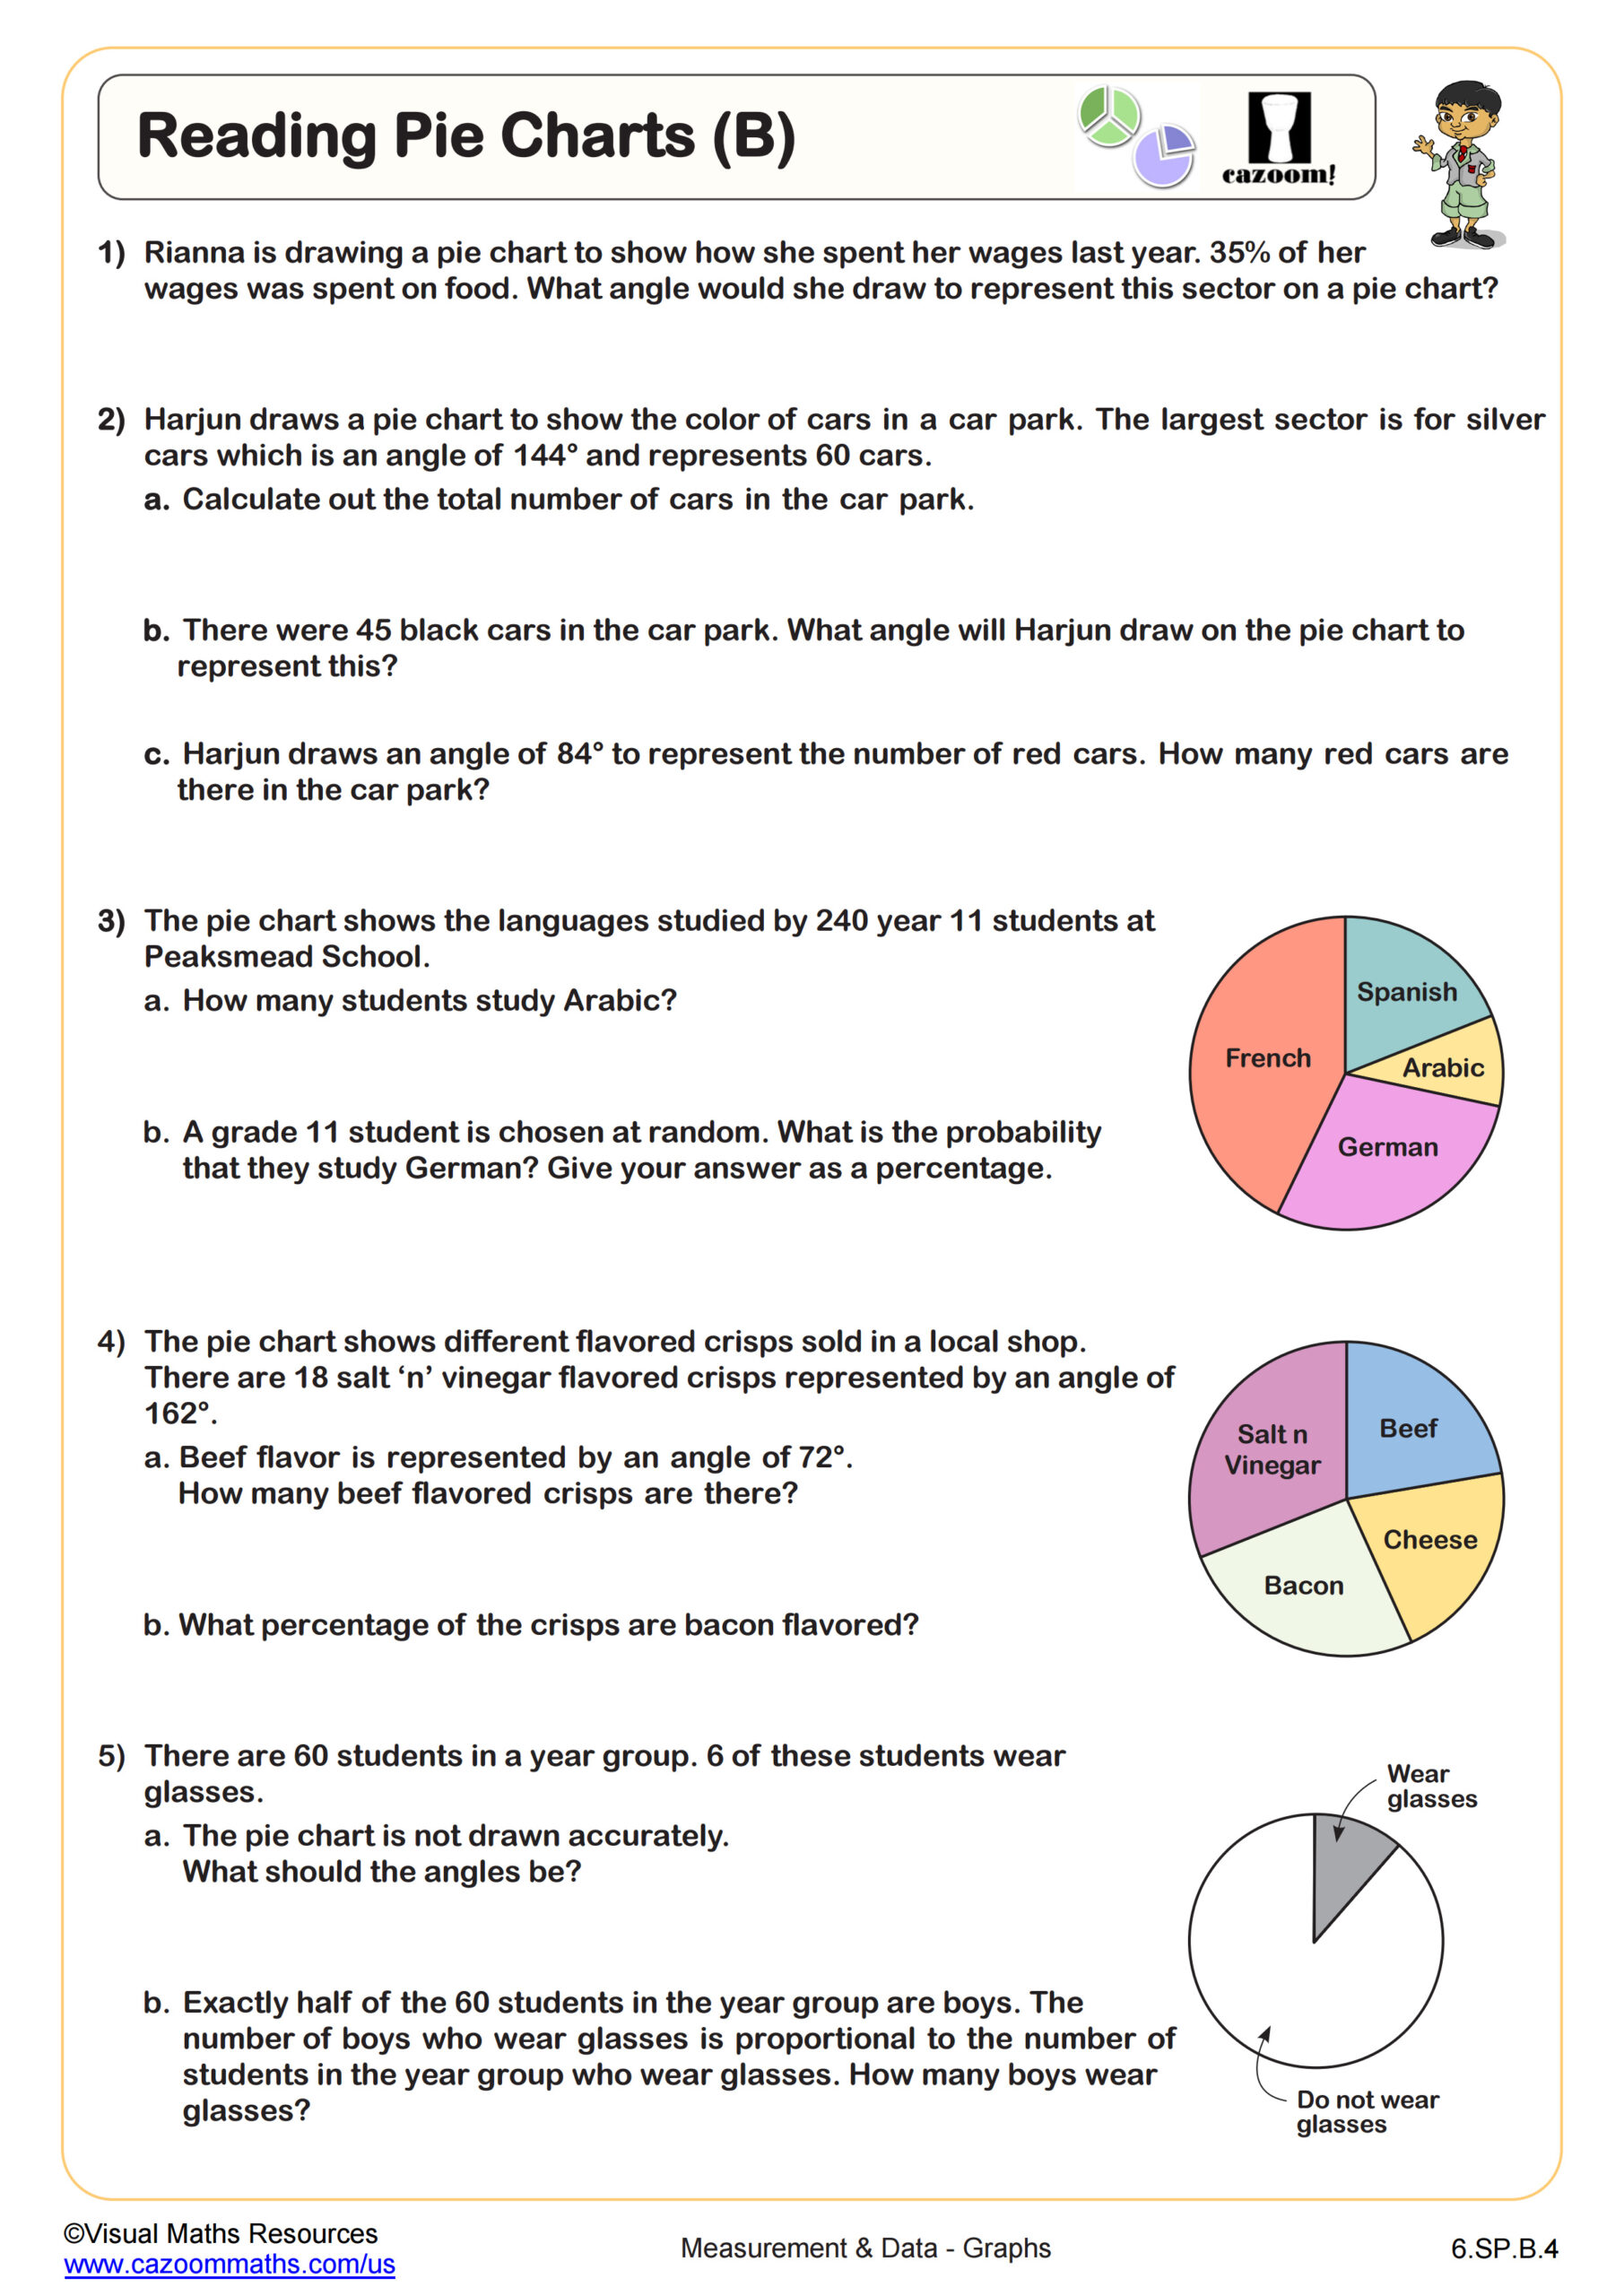
Reading Pie Charts (B)
Grades: 6th Grade
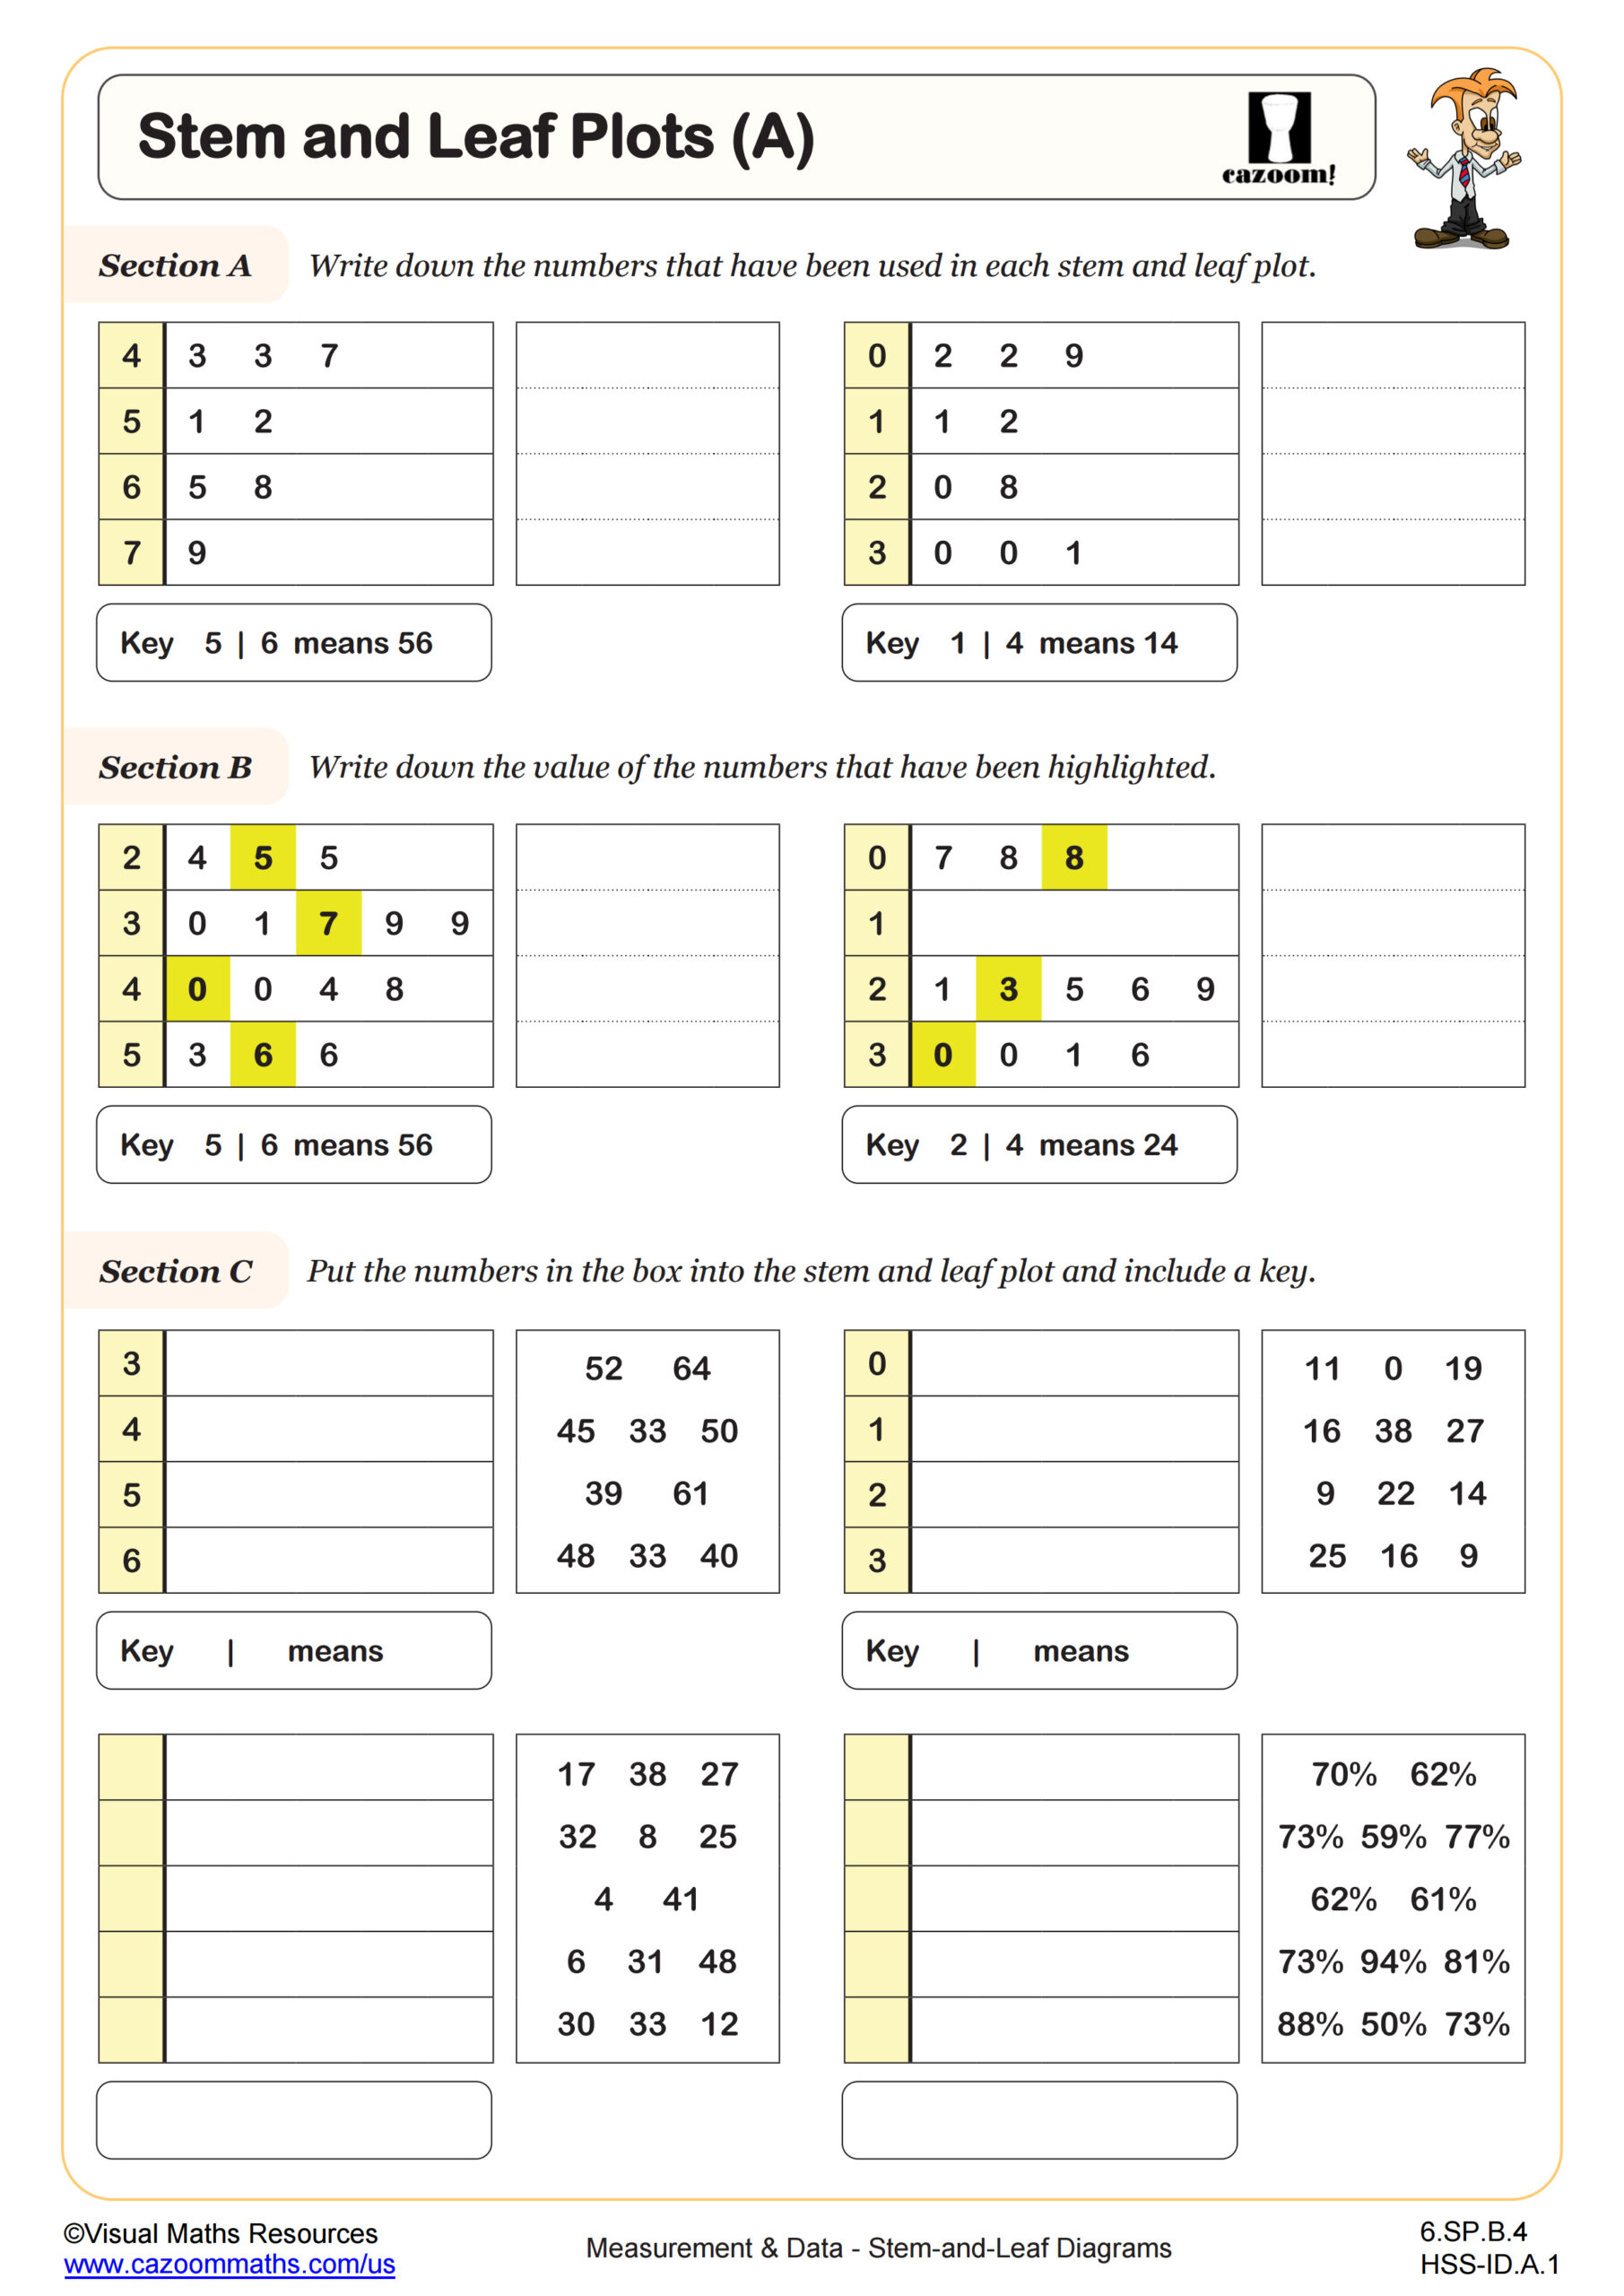
Stem and Leaf Plots (A)
Grades: 6th Grade, Geometry
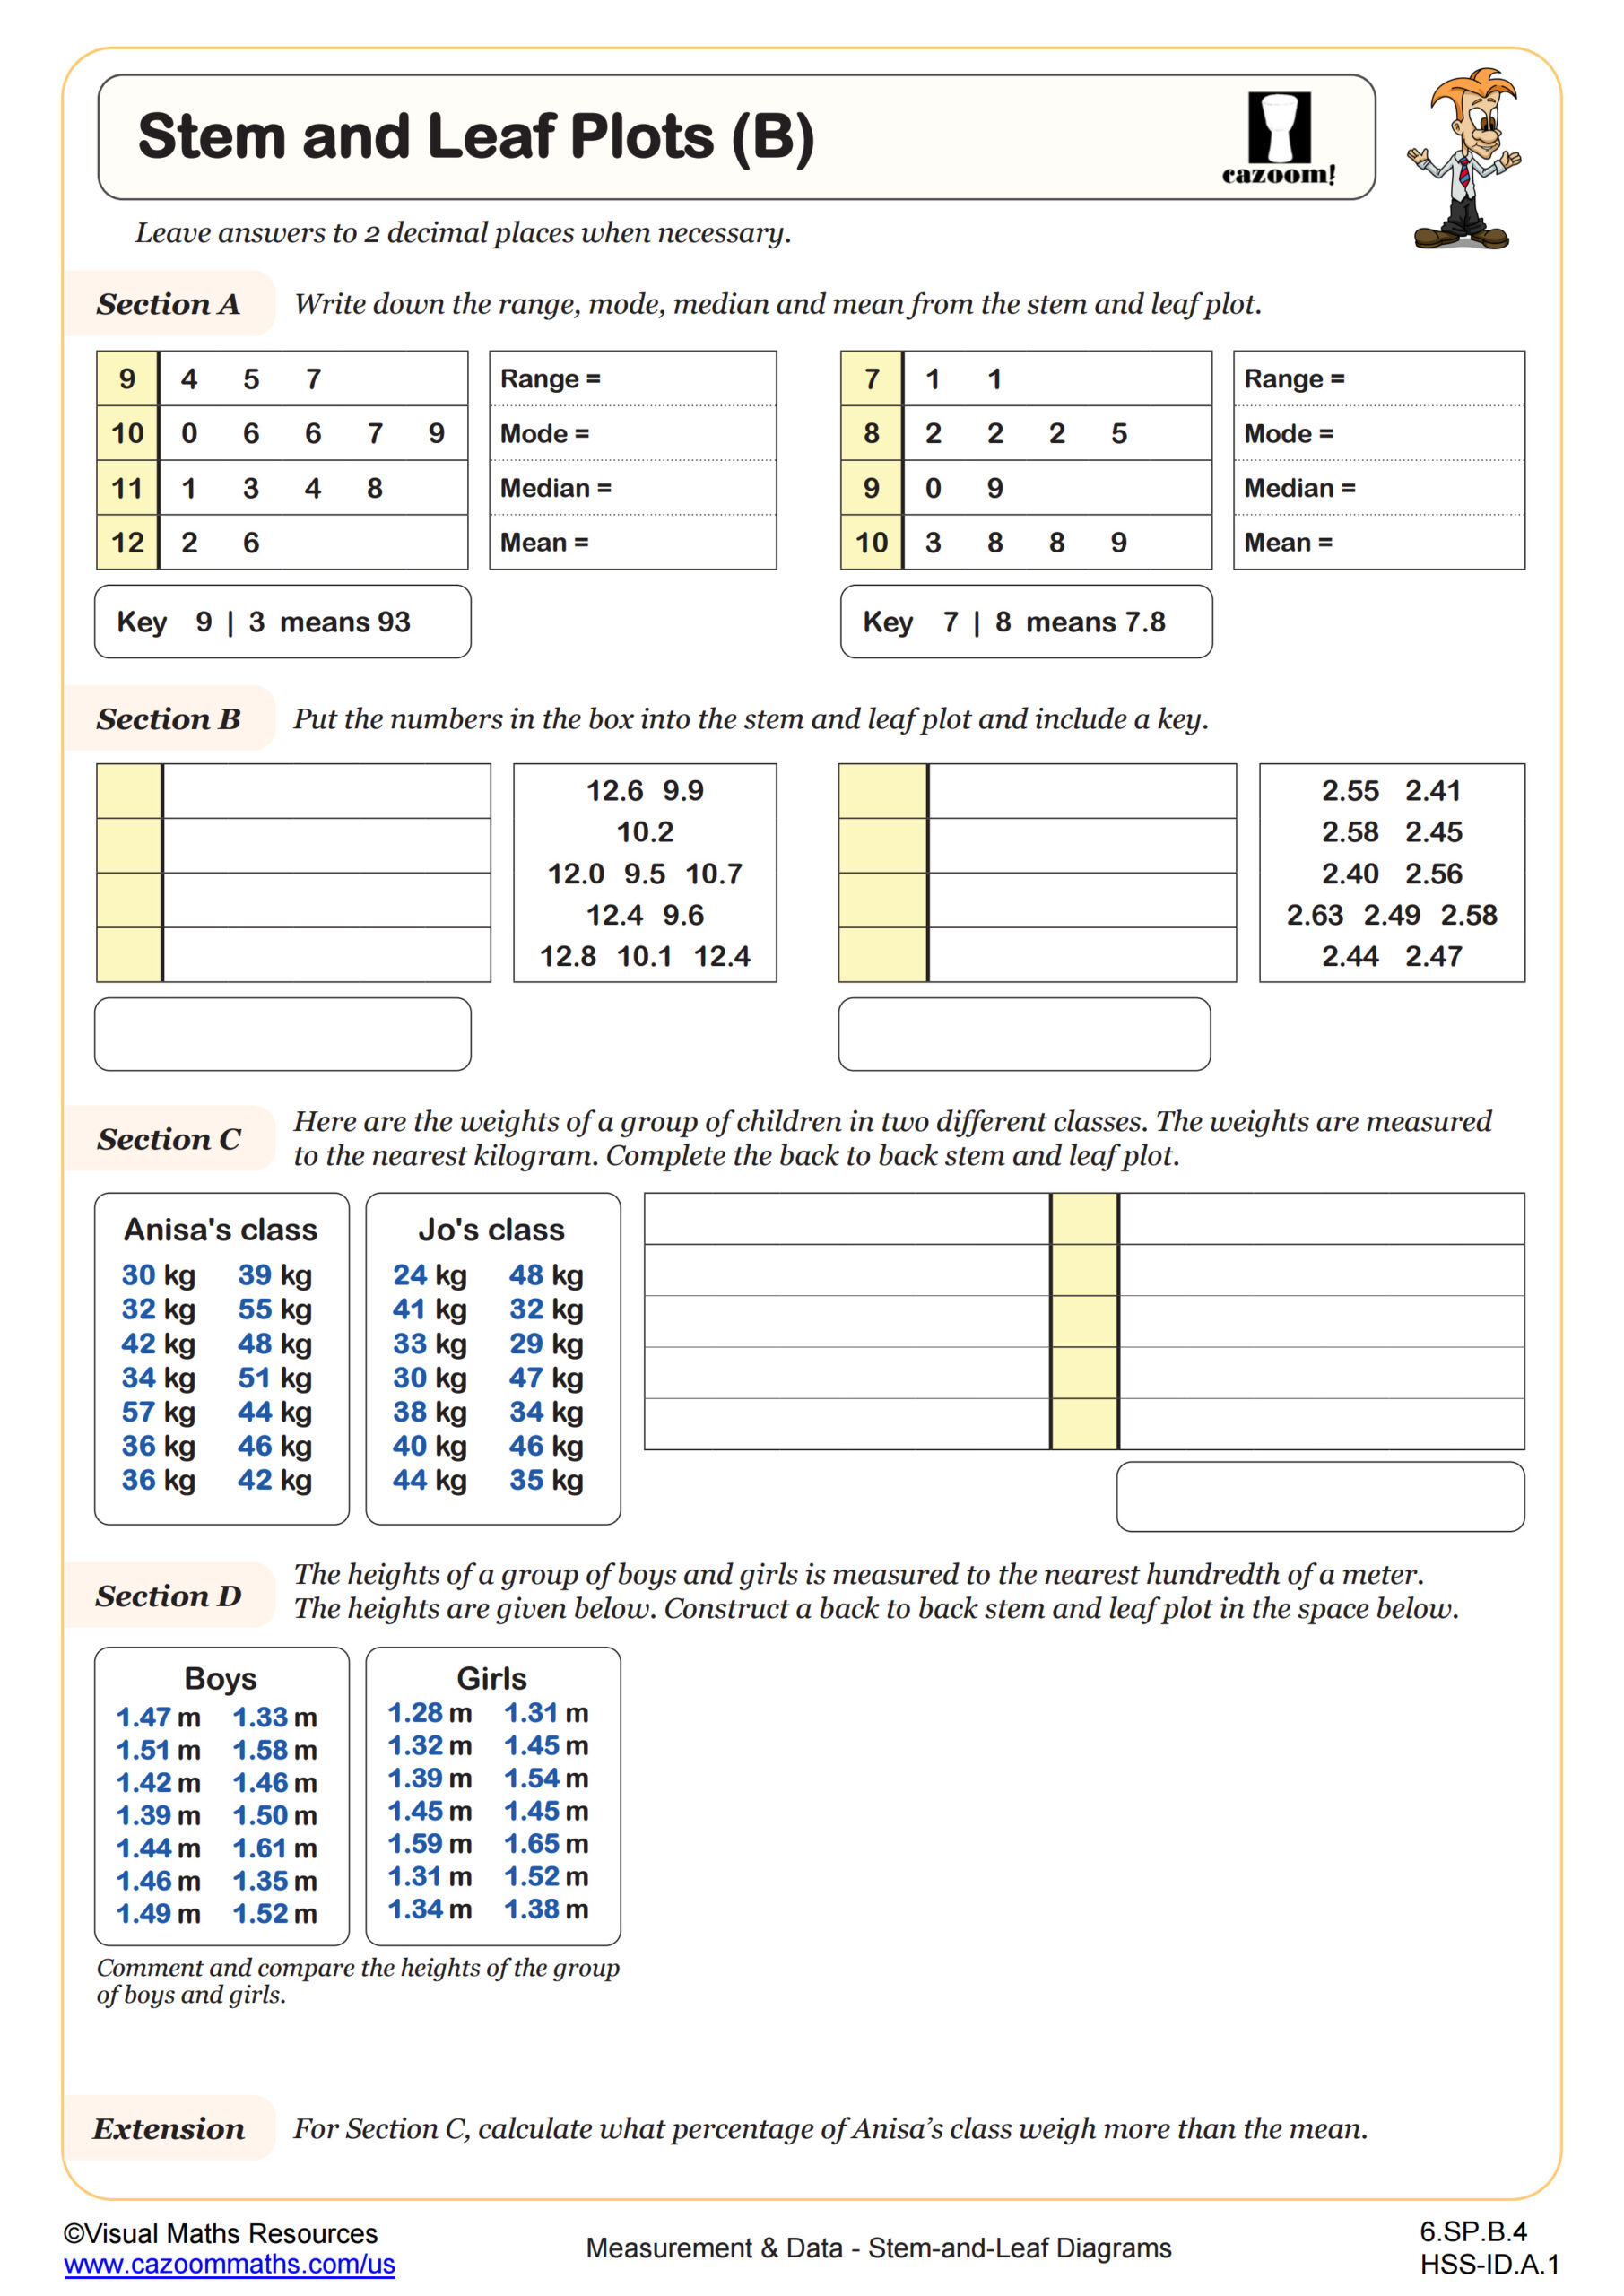
Stem and Leaf Plots (B)
Grades: 6th Grade, Geometry
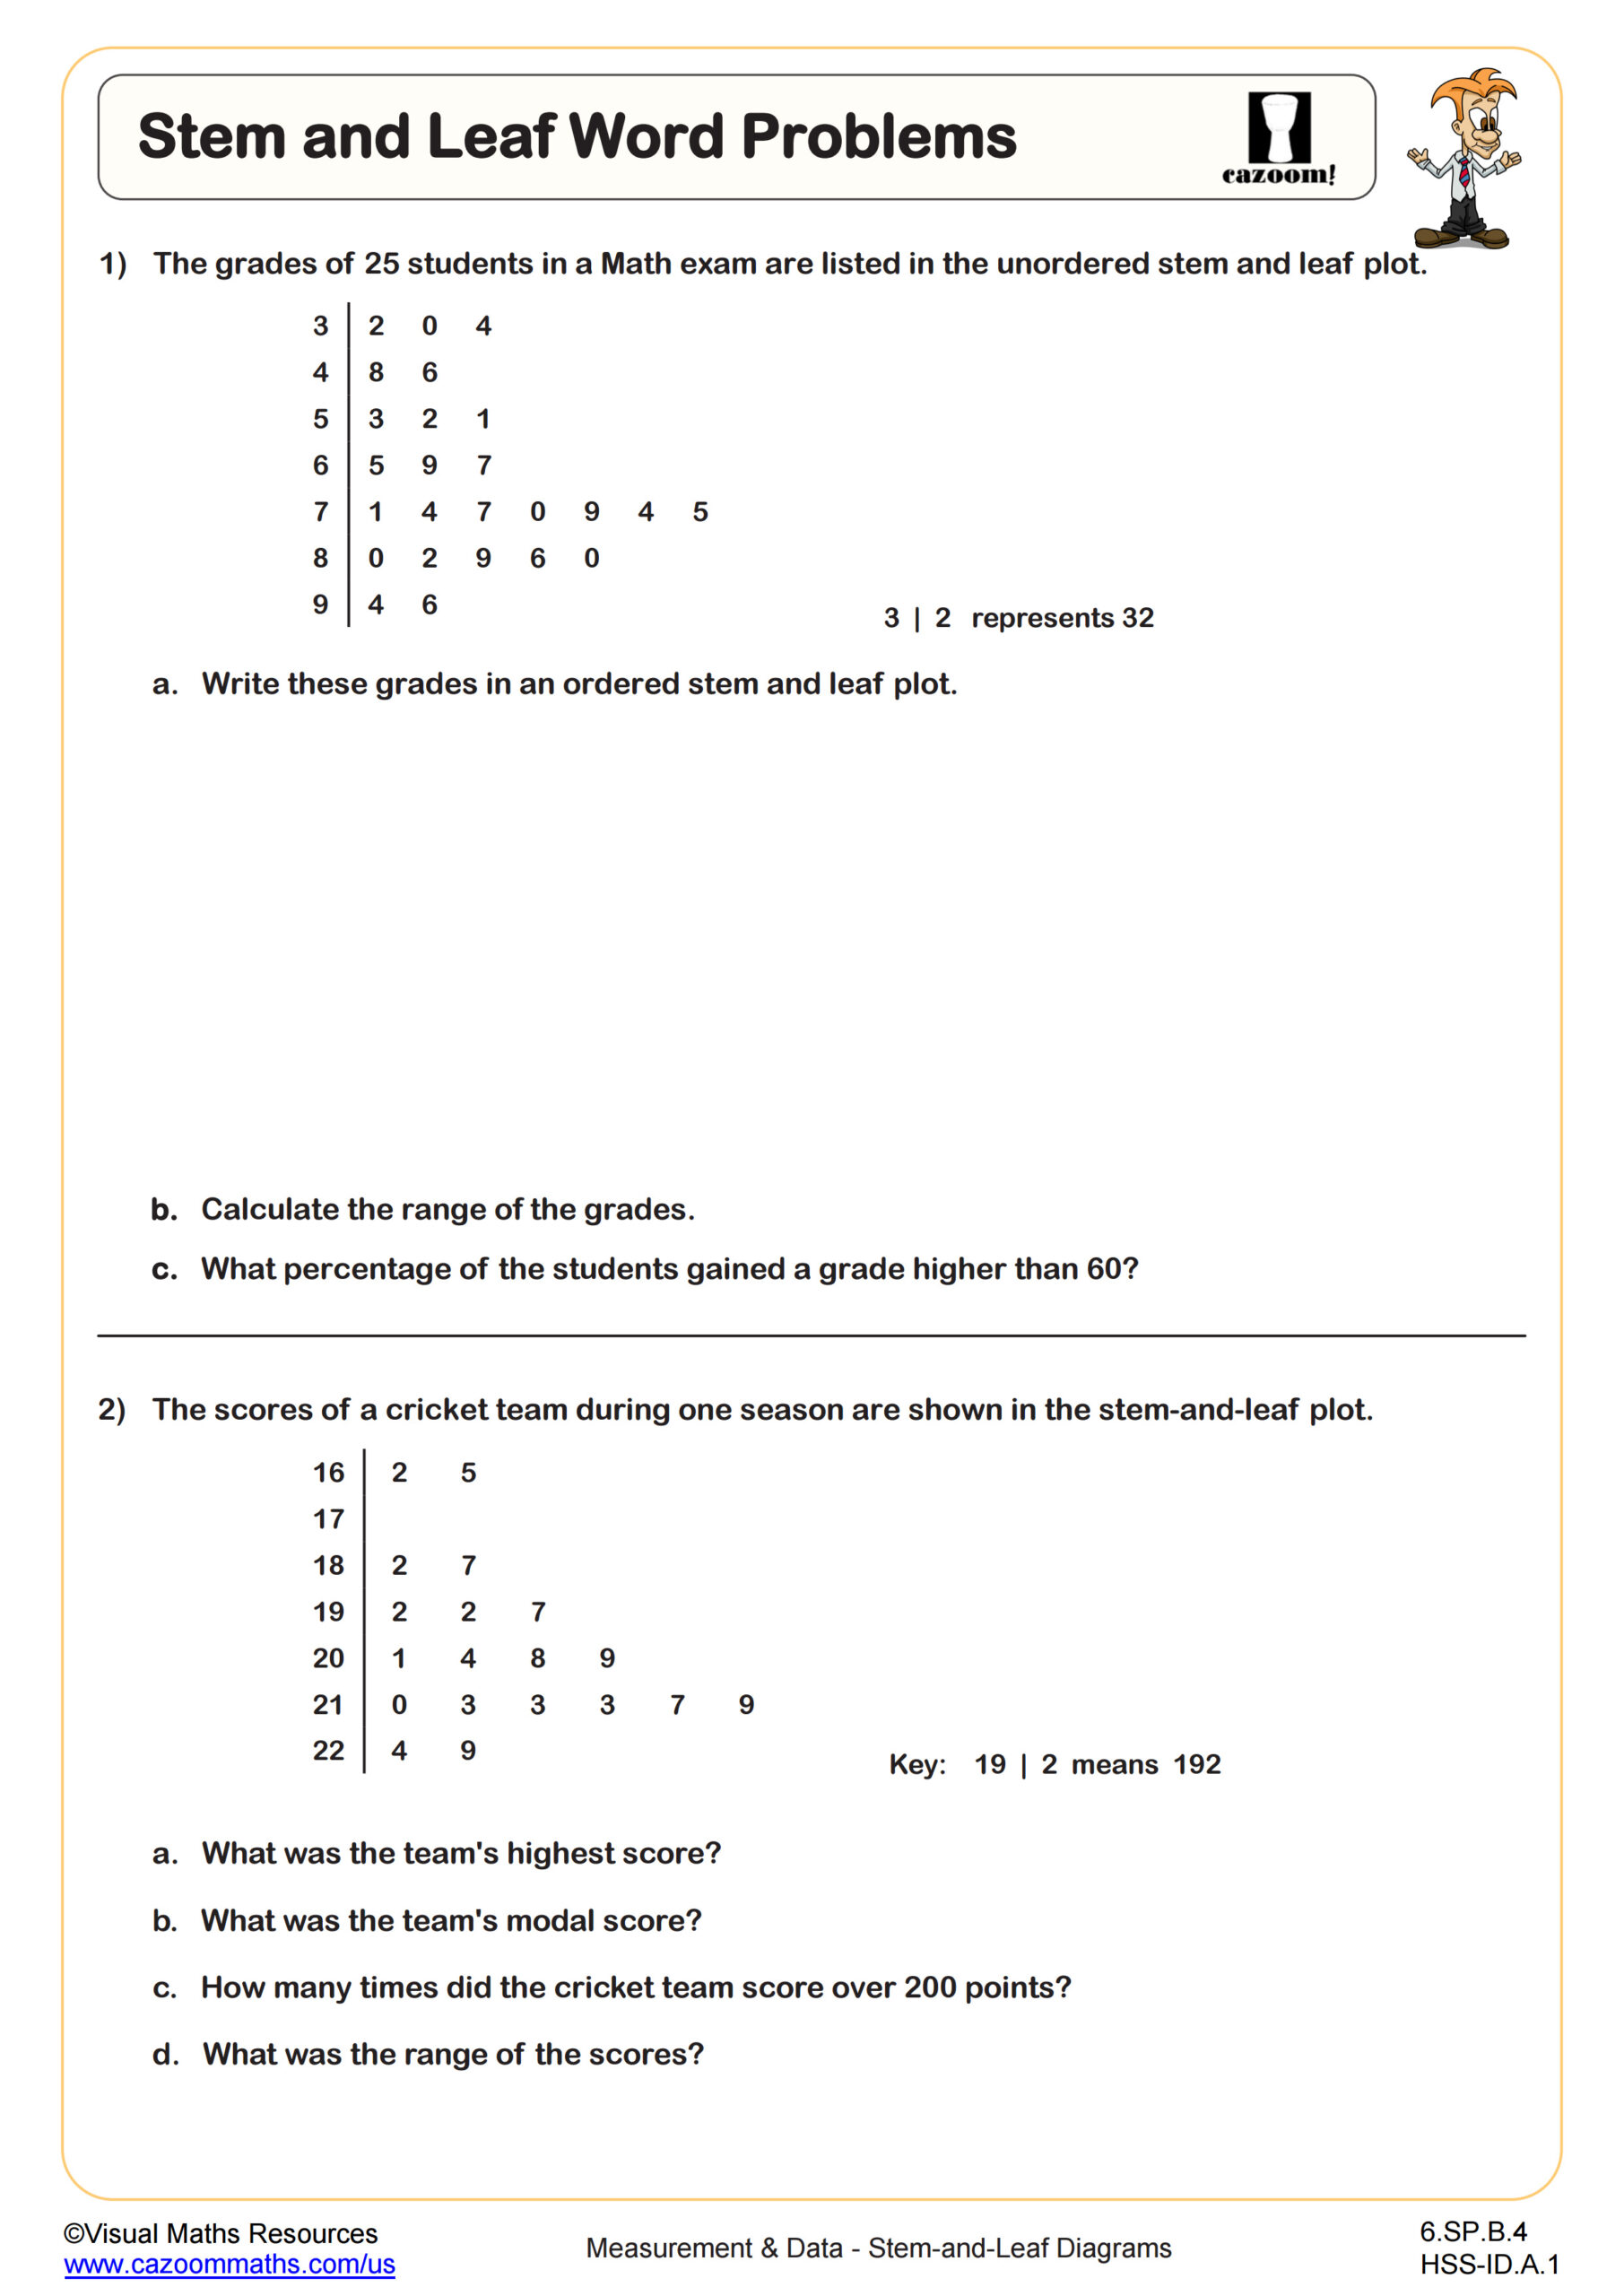
Stem and Leaf Word Problems
Grades: 6th Grade, Geometry
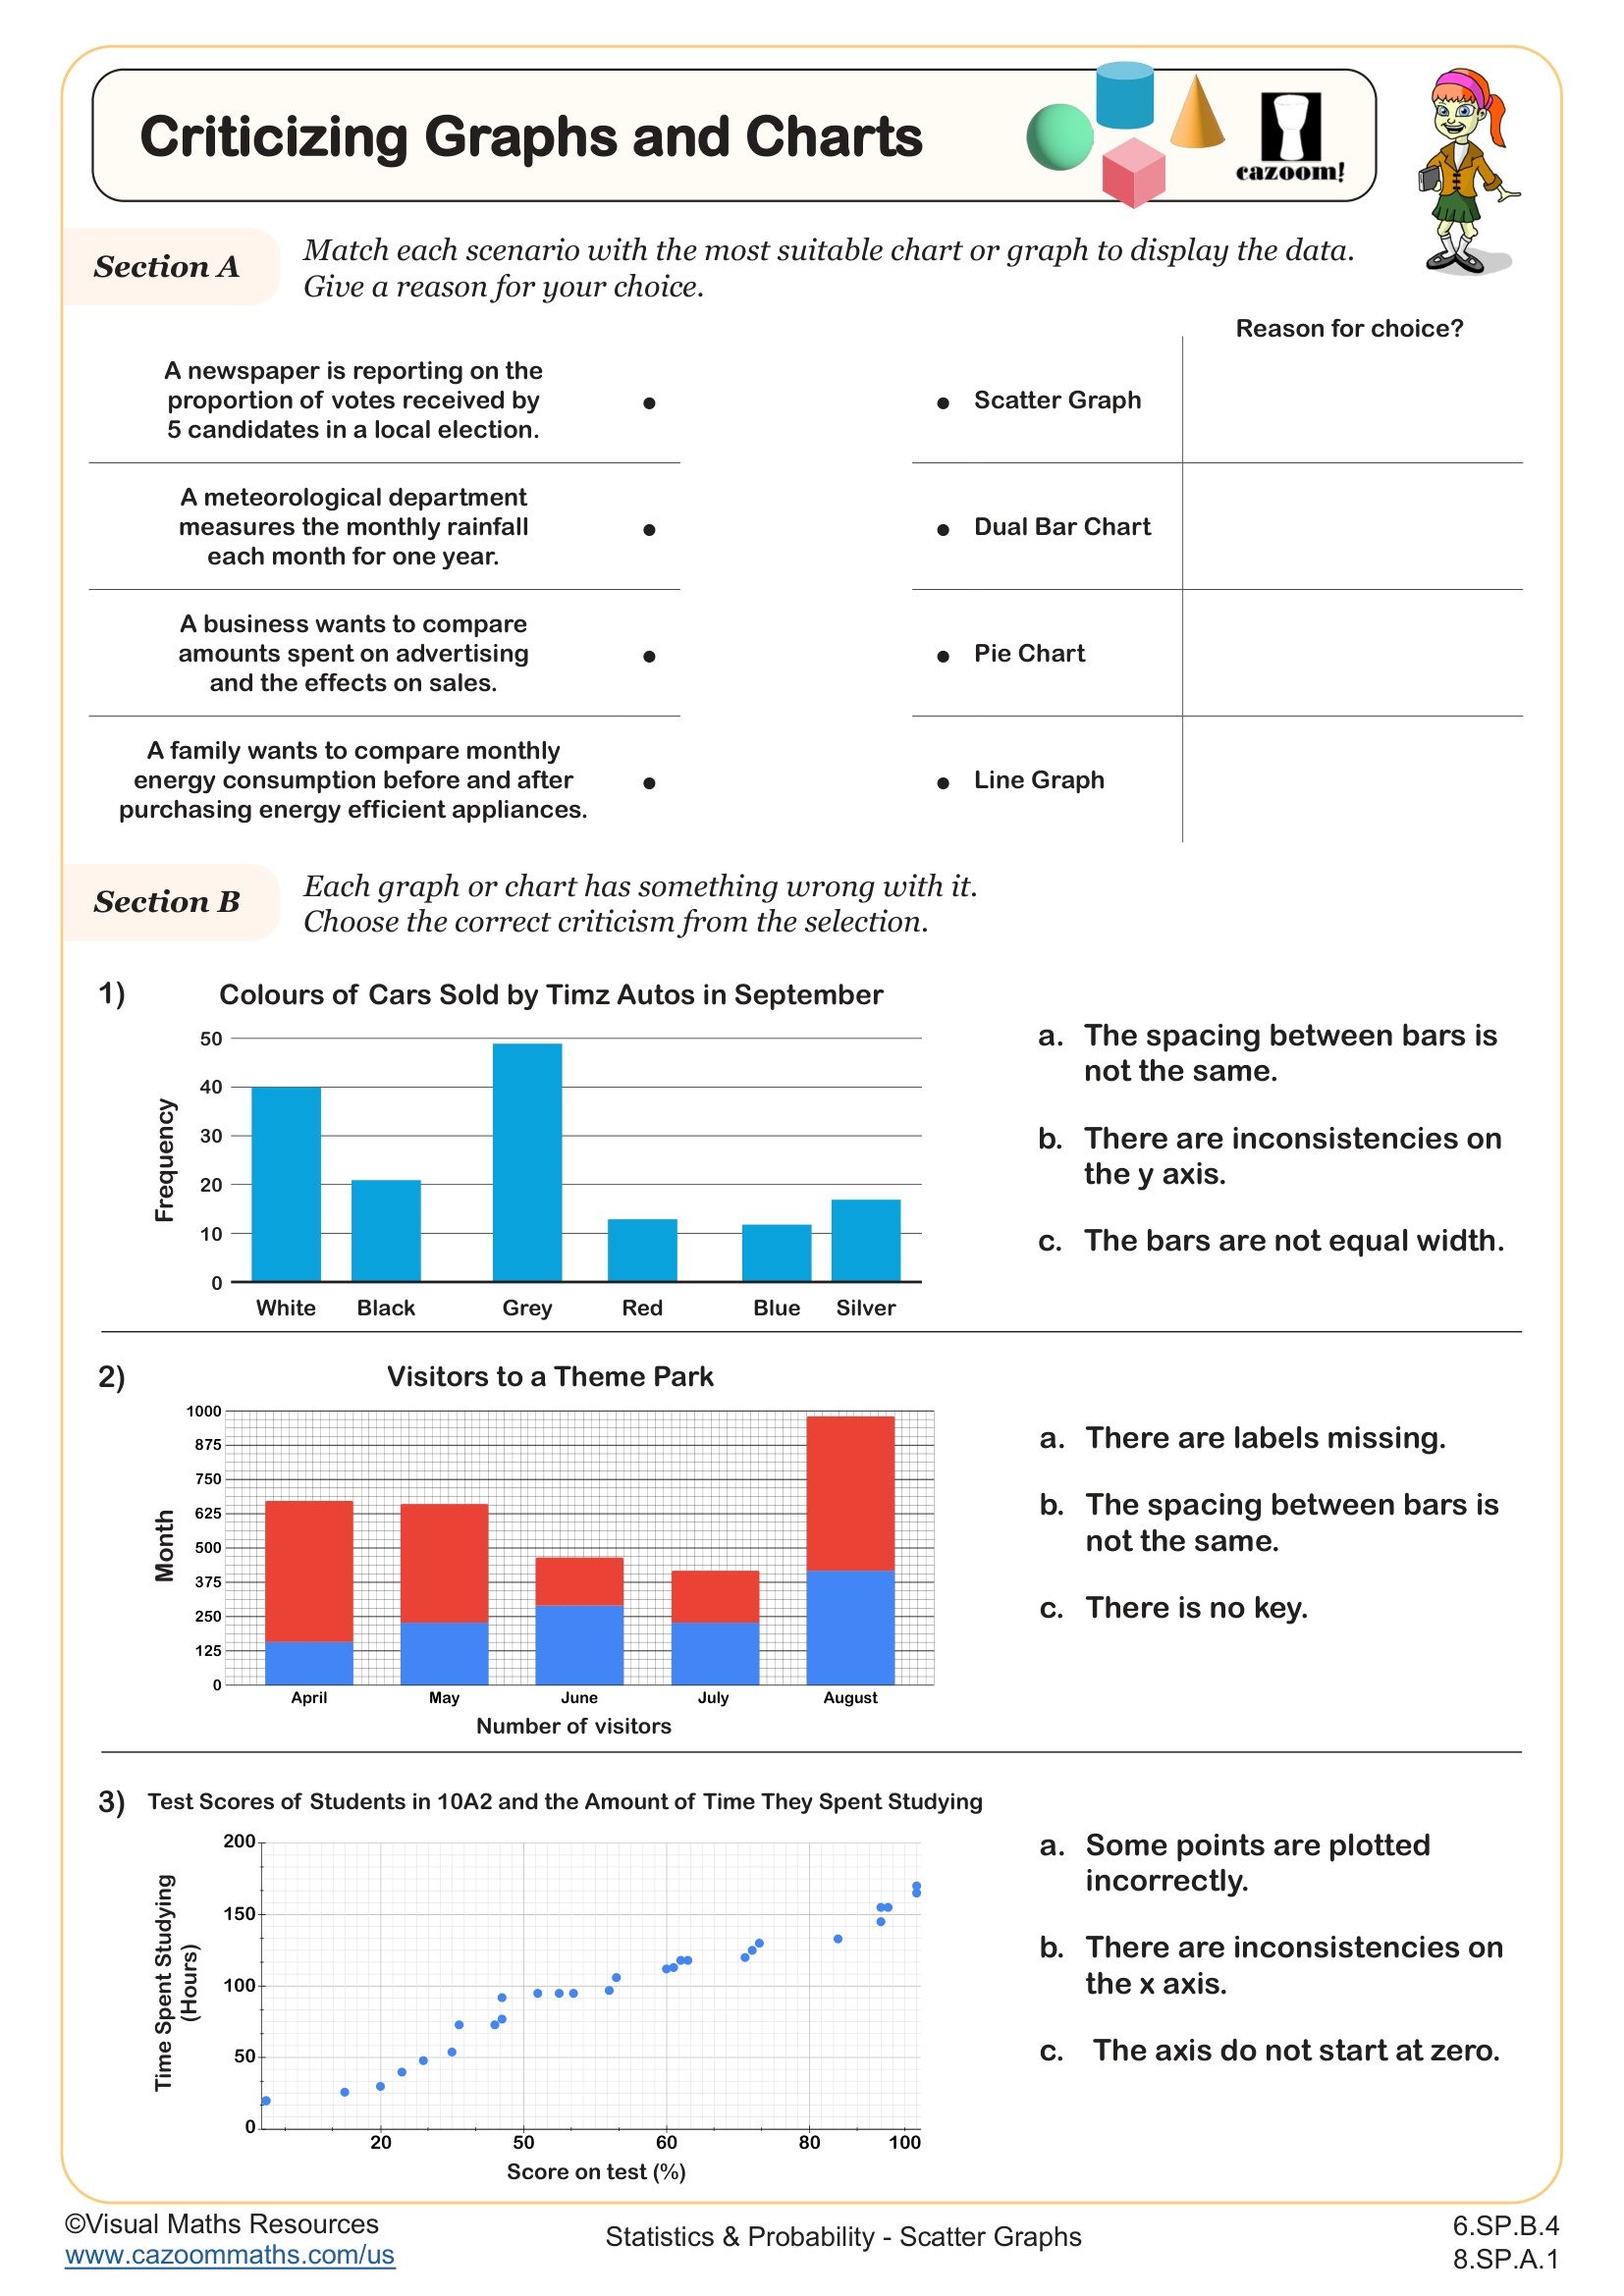
Criticising Graphs and Charts
Grades: 7th Grade, 8th Grade
All worksheets are created by the team of experienced teachers at Cazoom Math.