6.SP.B.5 Worksheets
Common Core State Standards 6.SP.B.5 Worksheets
Strand: Statistics and Probability
Objective: Summarize and describe distributions.
CCSS Description: Summarize numerical data sets in relation to their context, such as by: a. Reporting the number of observations. b. Describing the nature of the attribute under investigation, including how it was measured and its units of measurement. c. Giving quantitative measures of center (median and/or mean) and variability (interquartile range and/or mean absolute deviation), as well as describing any overall pattern and any striking deviations from the overall pattern with reference to the context in which the data were gathered. d. Relating the choice of measures of center and variability to the shape of the data distribution and the context in which the data were gathered.
Cazoom Math is a leading provider of Math Worksheets and used by over 50,000 teachers and parents around the world. Here you can find a set of math worksheets aligned to the common core standard 6.SP.B.5. These worksheets are perfect for learners to develop critical math skills.
You can click on the images below to find out more about each math worksheet, and download and print the resource.
We have a great range of resources for students in 6th Grade. Check out our 6th Grade Math Worksheets page for more details.
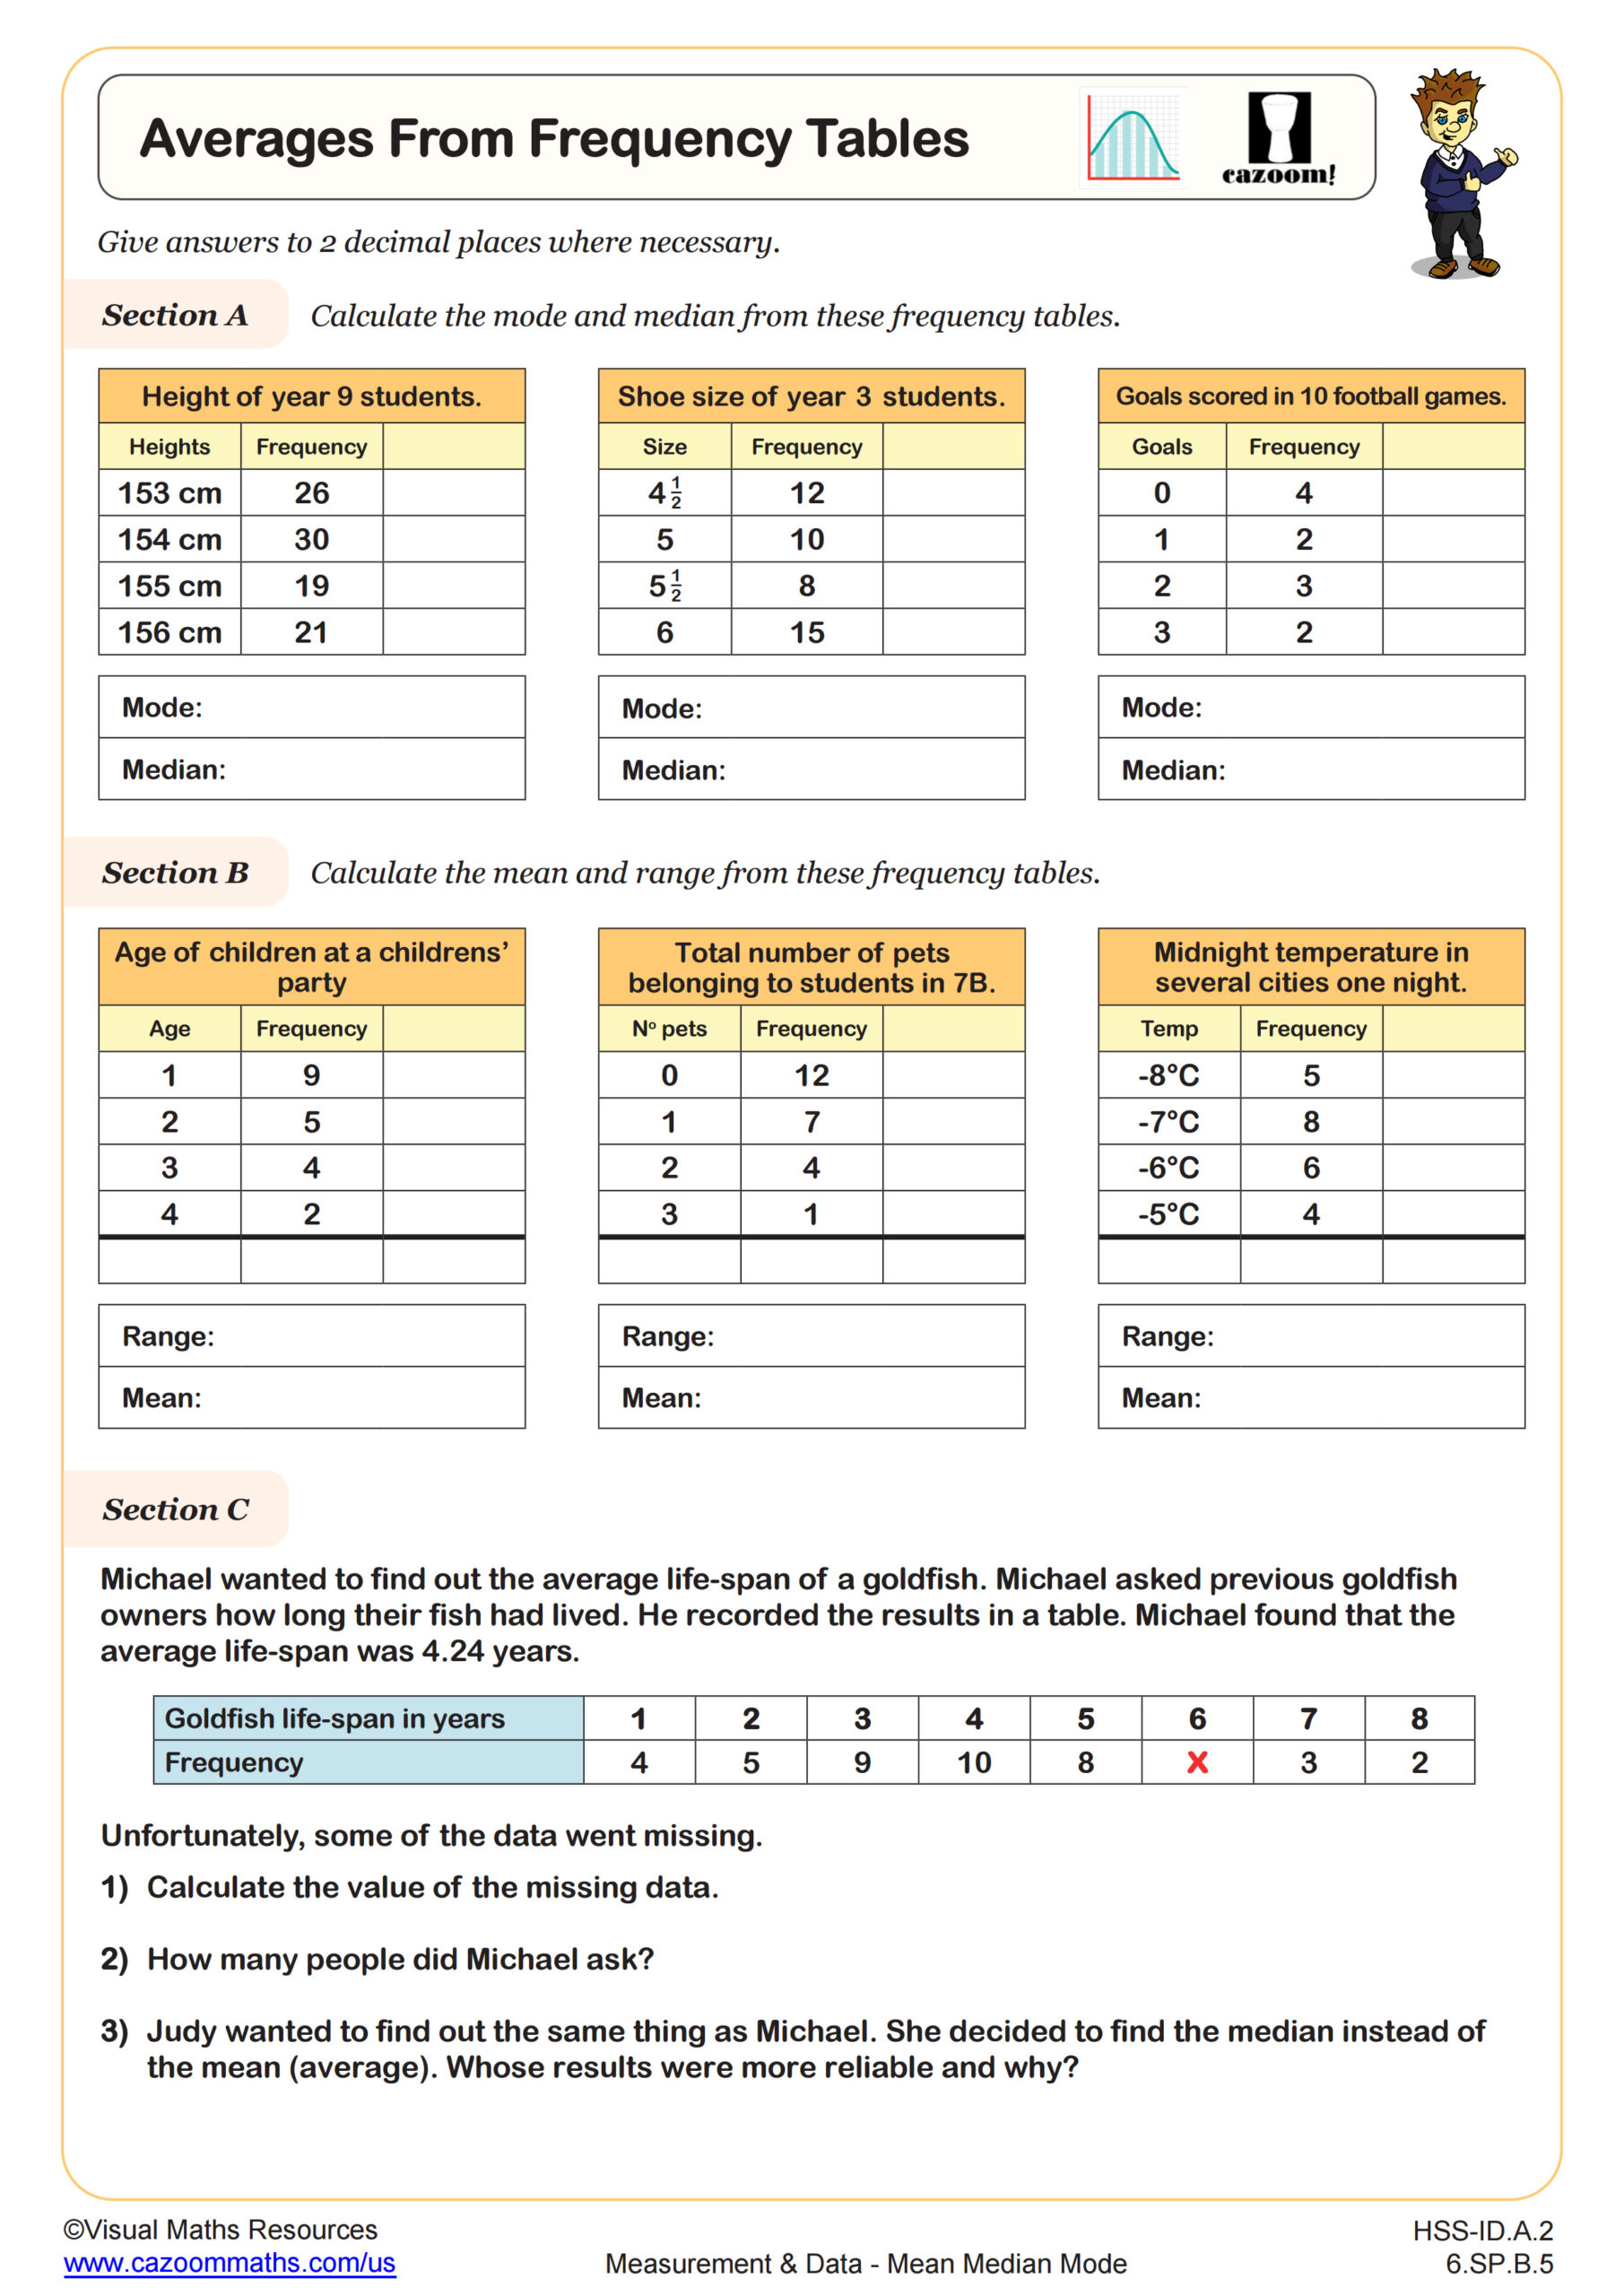
Averages from Frequency Tables
Grades: 6th Grade, Algebra I
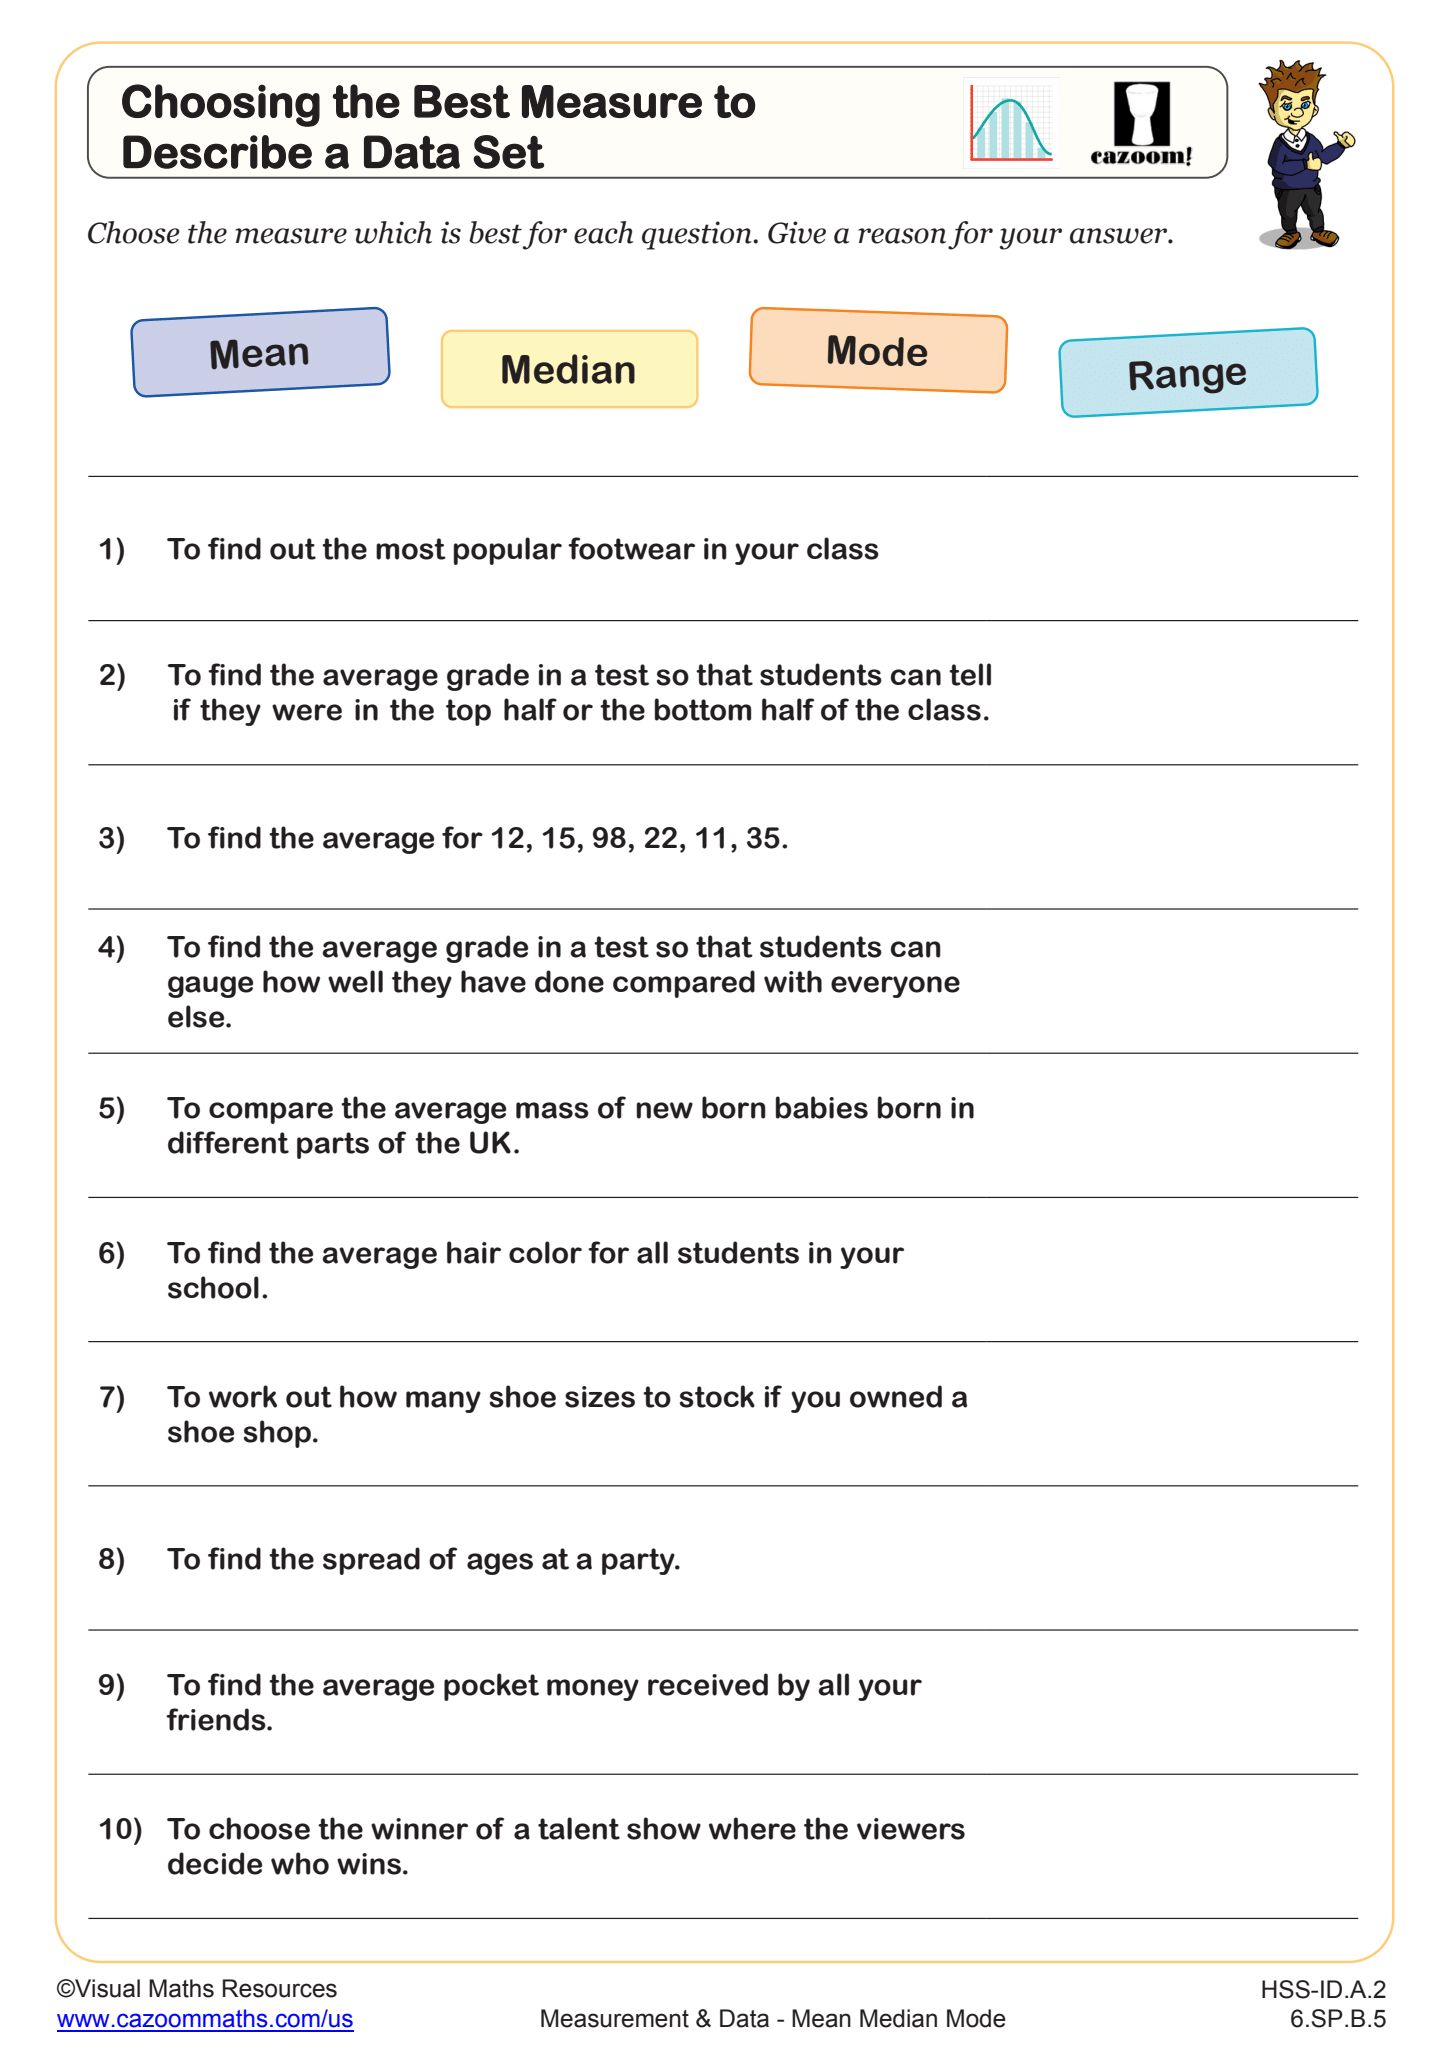
Choosing the Best Measure to Describe a Data Set
Grades: 6th Grade, Algebra I
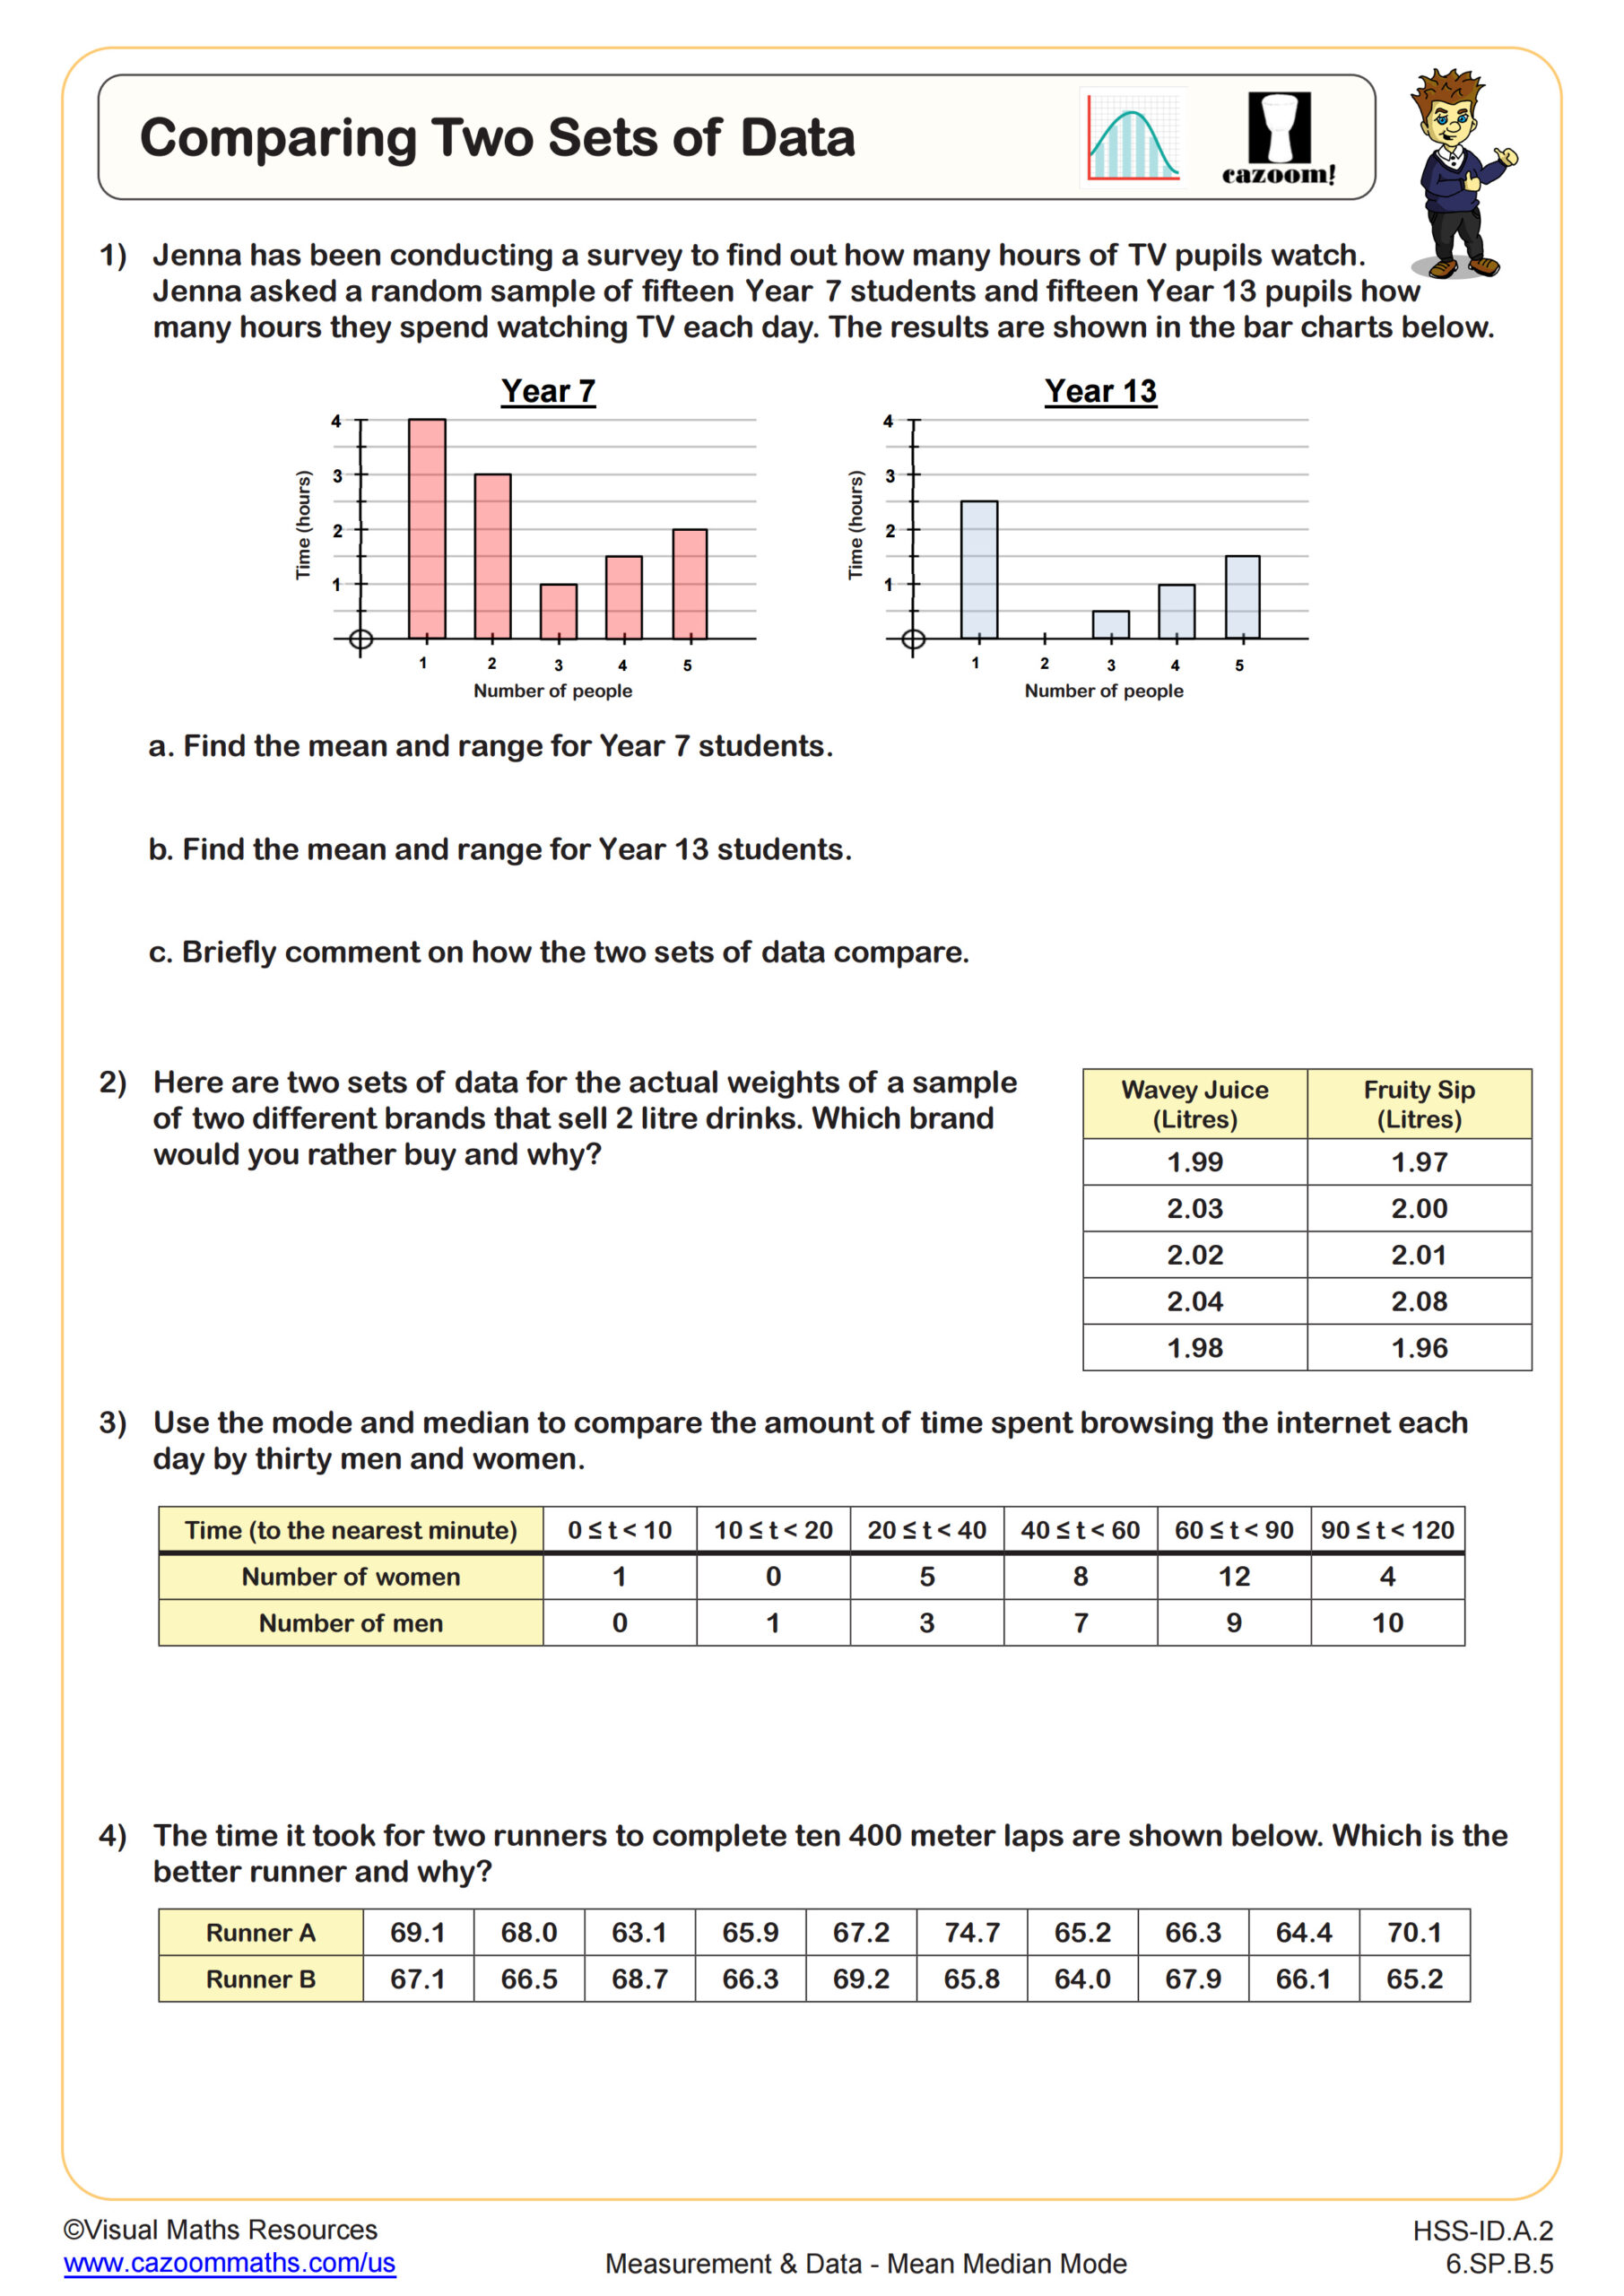
Comparing Two Sets of Data
Grades: 6th Grade, Algebra I
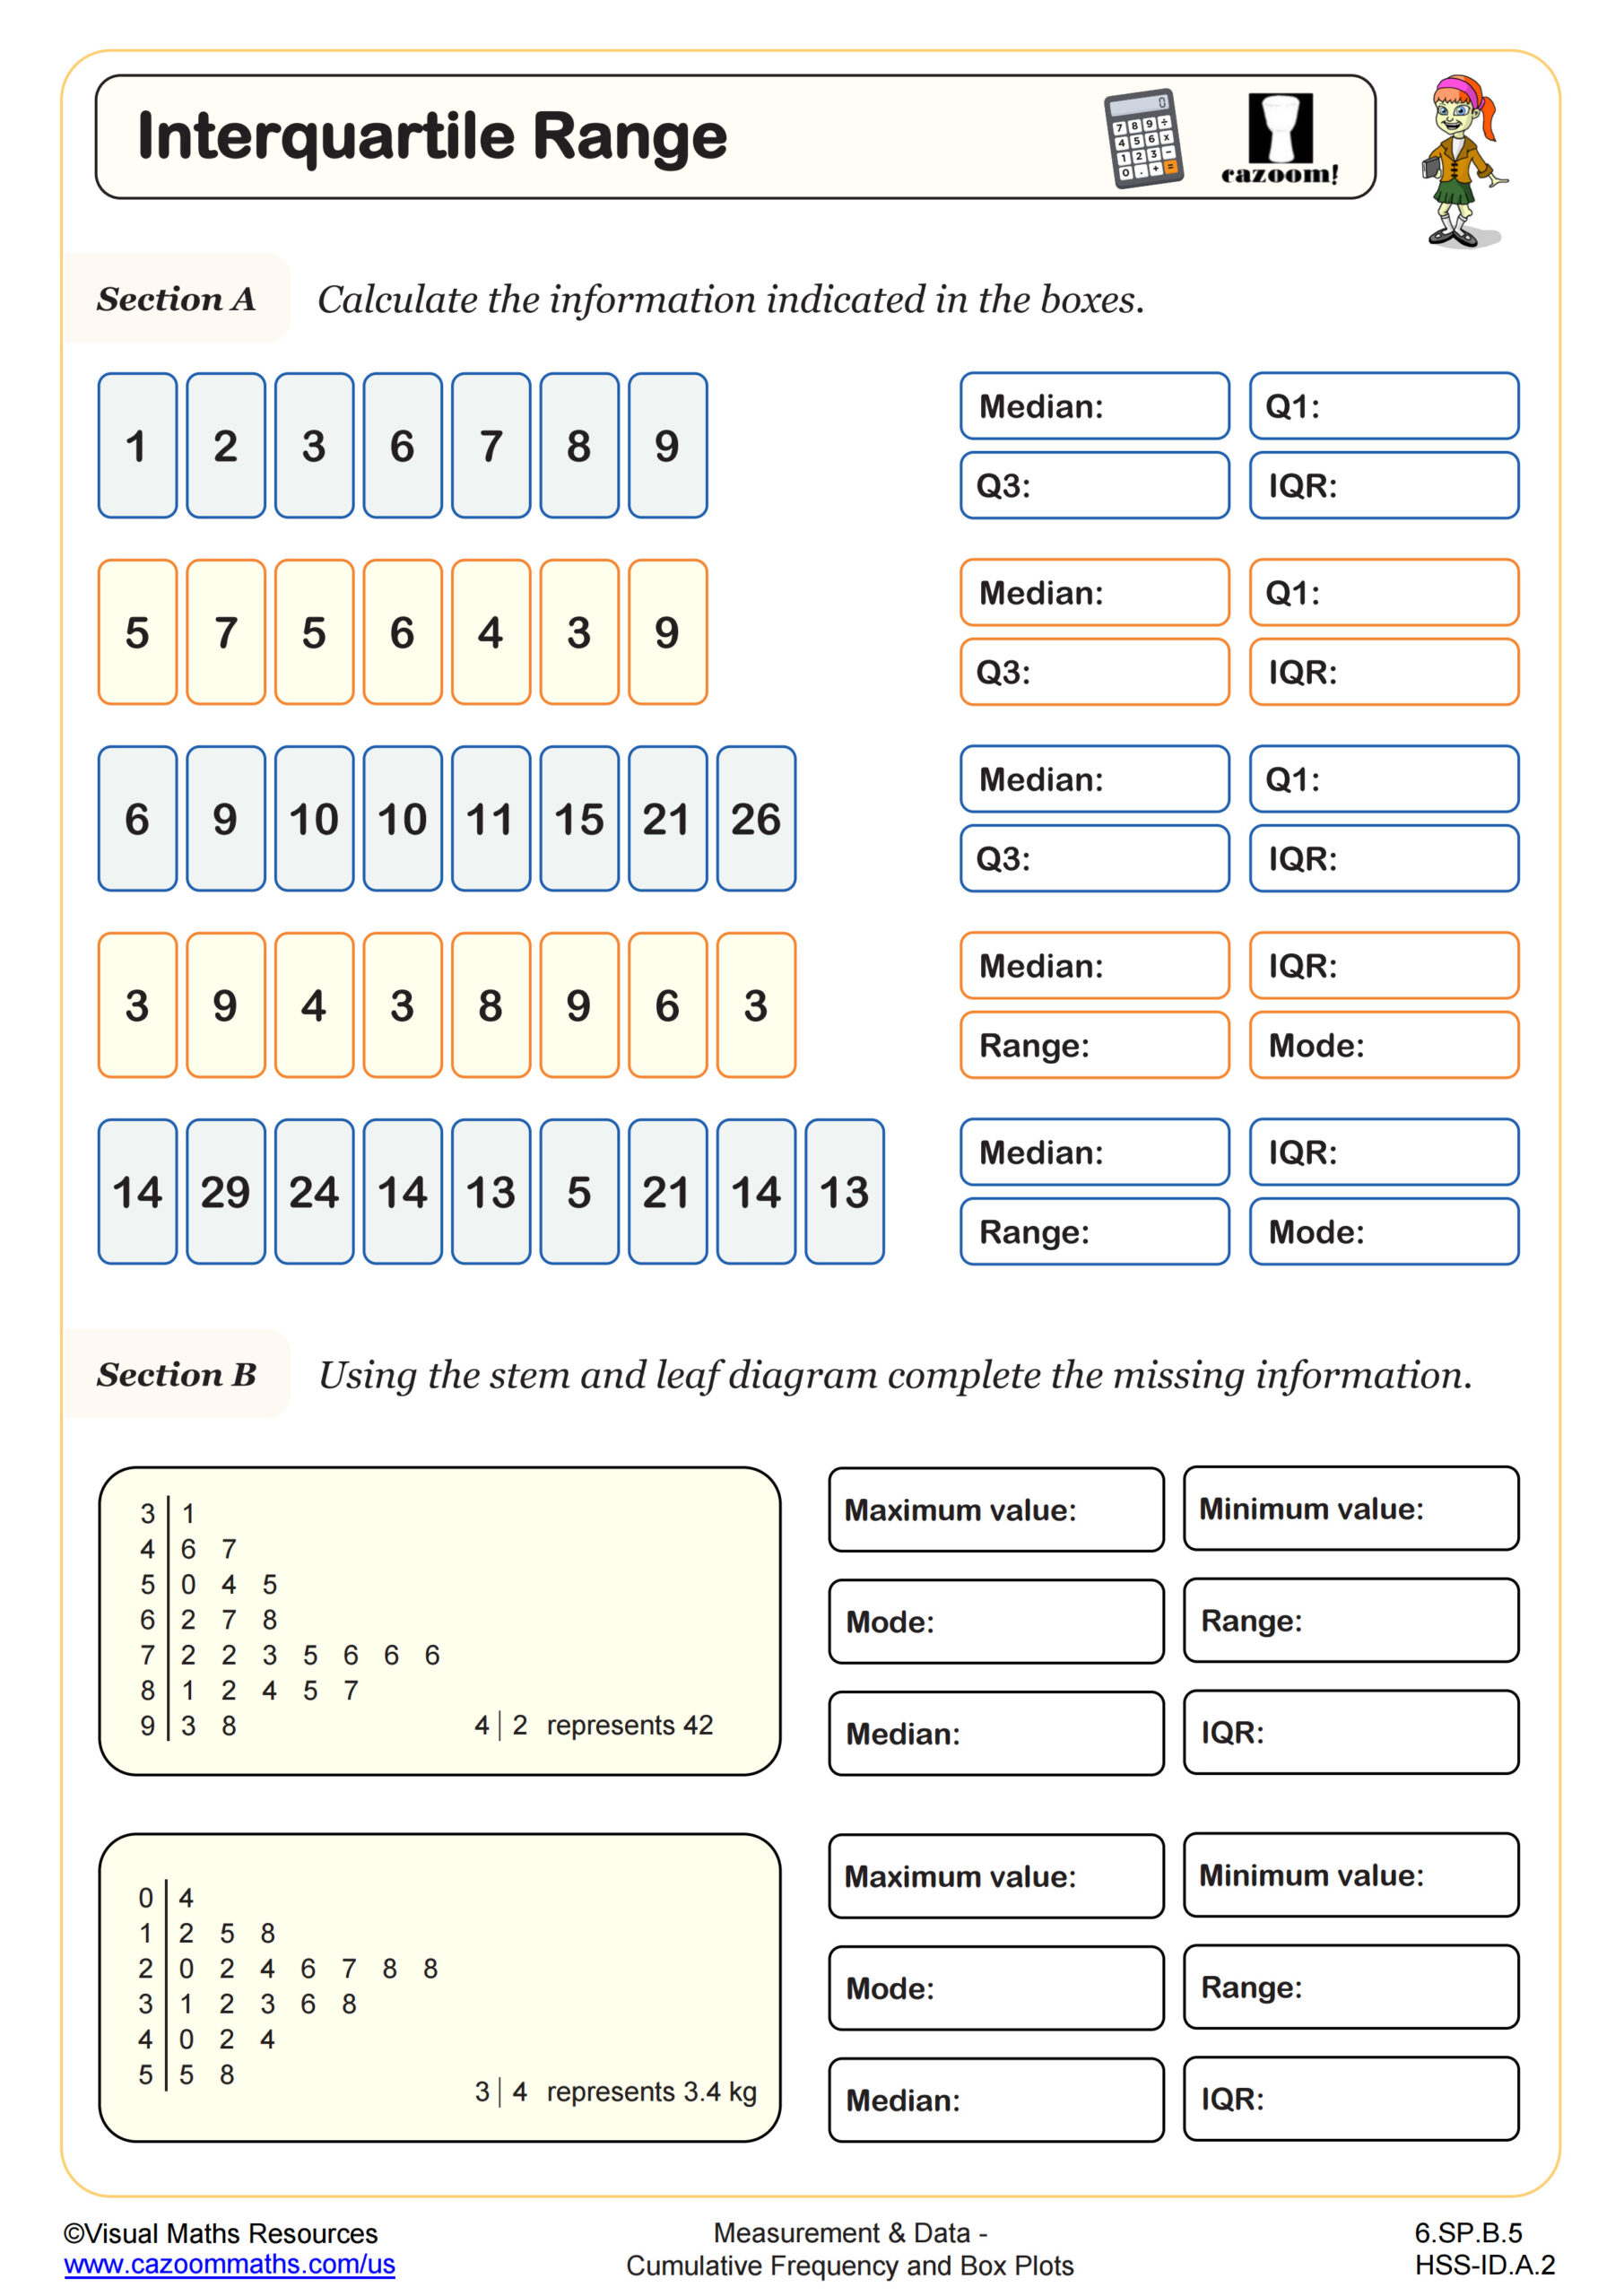
Interquartile Range
Grades: 6th Grade, Algebra I
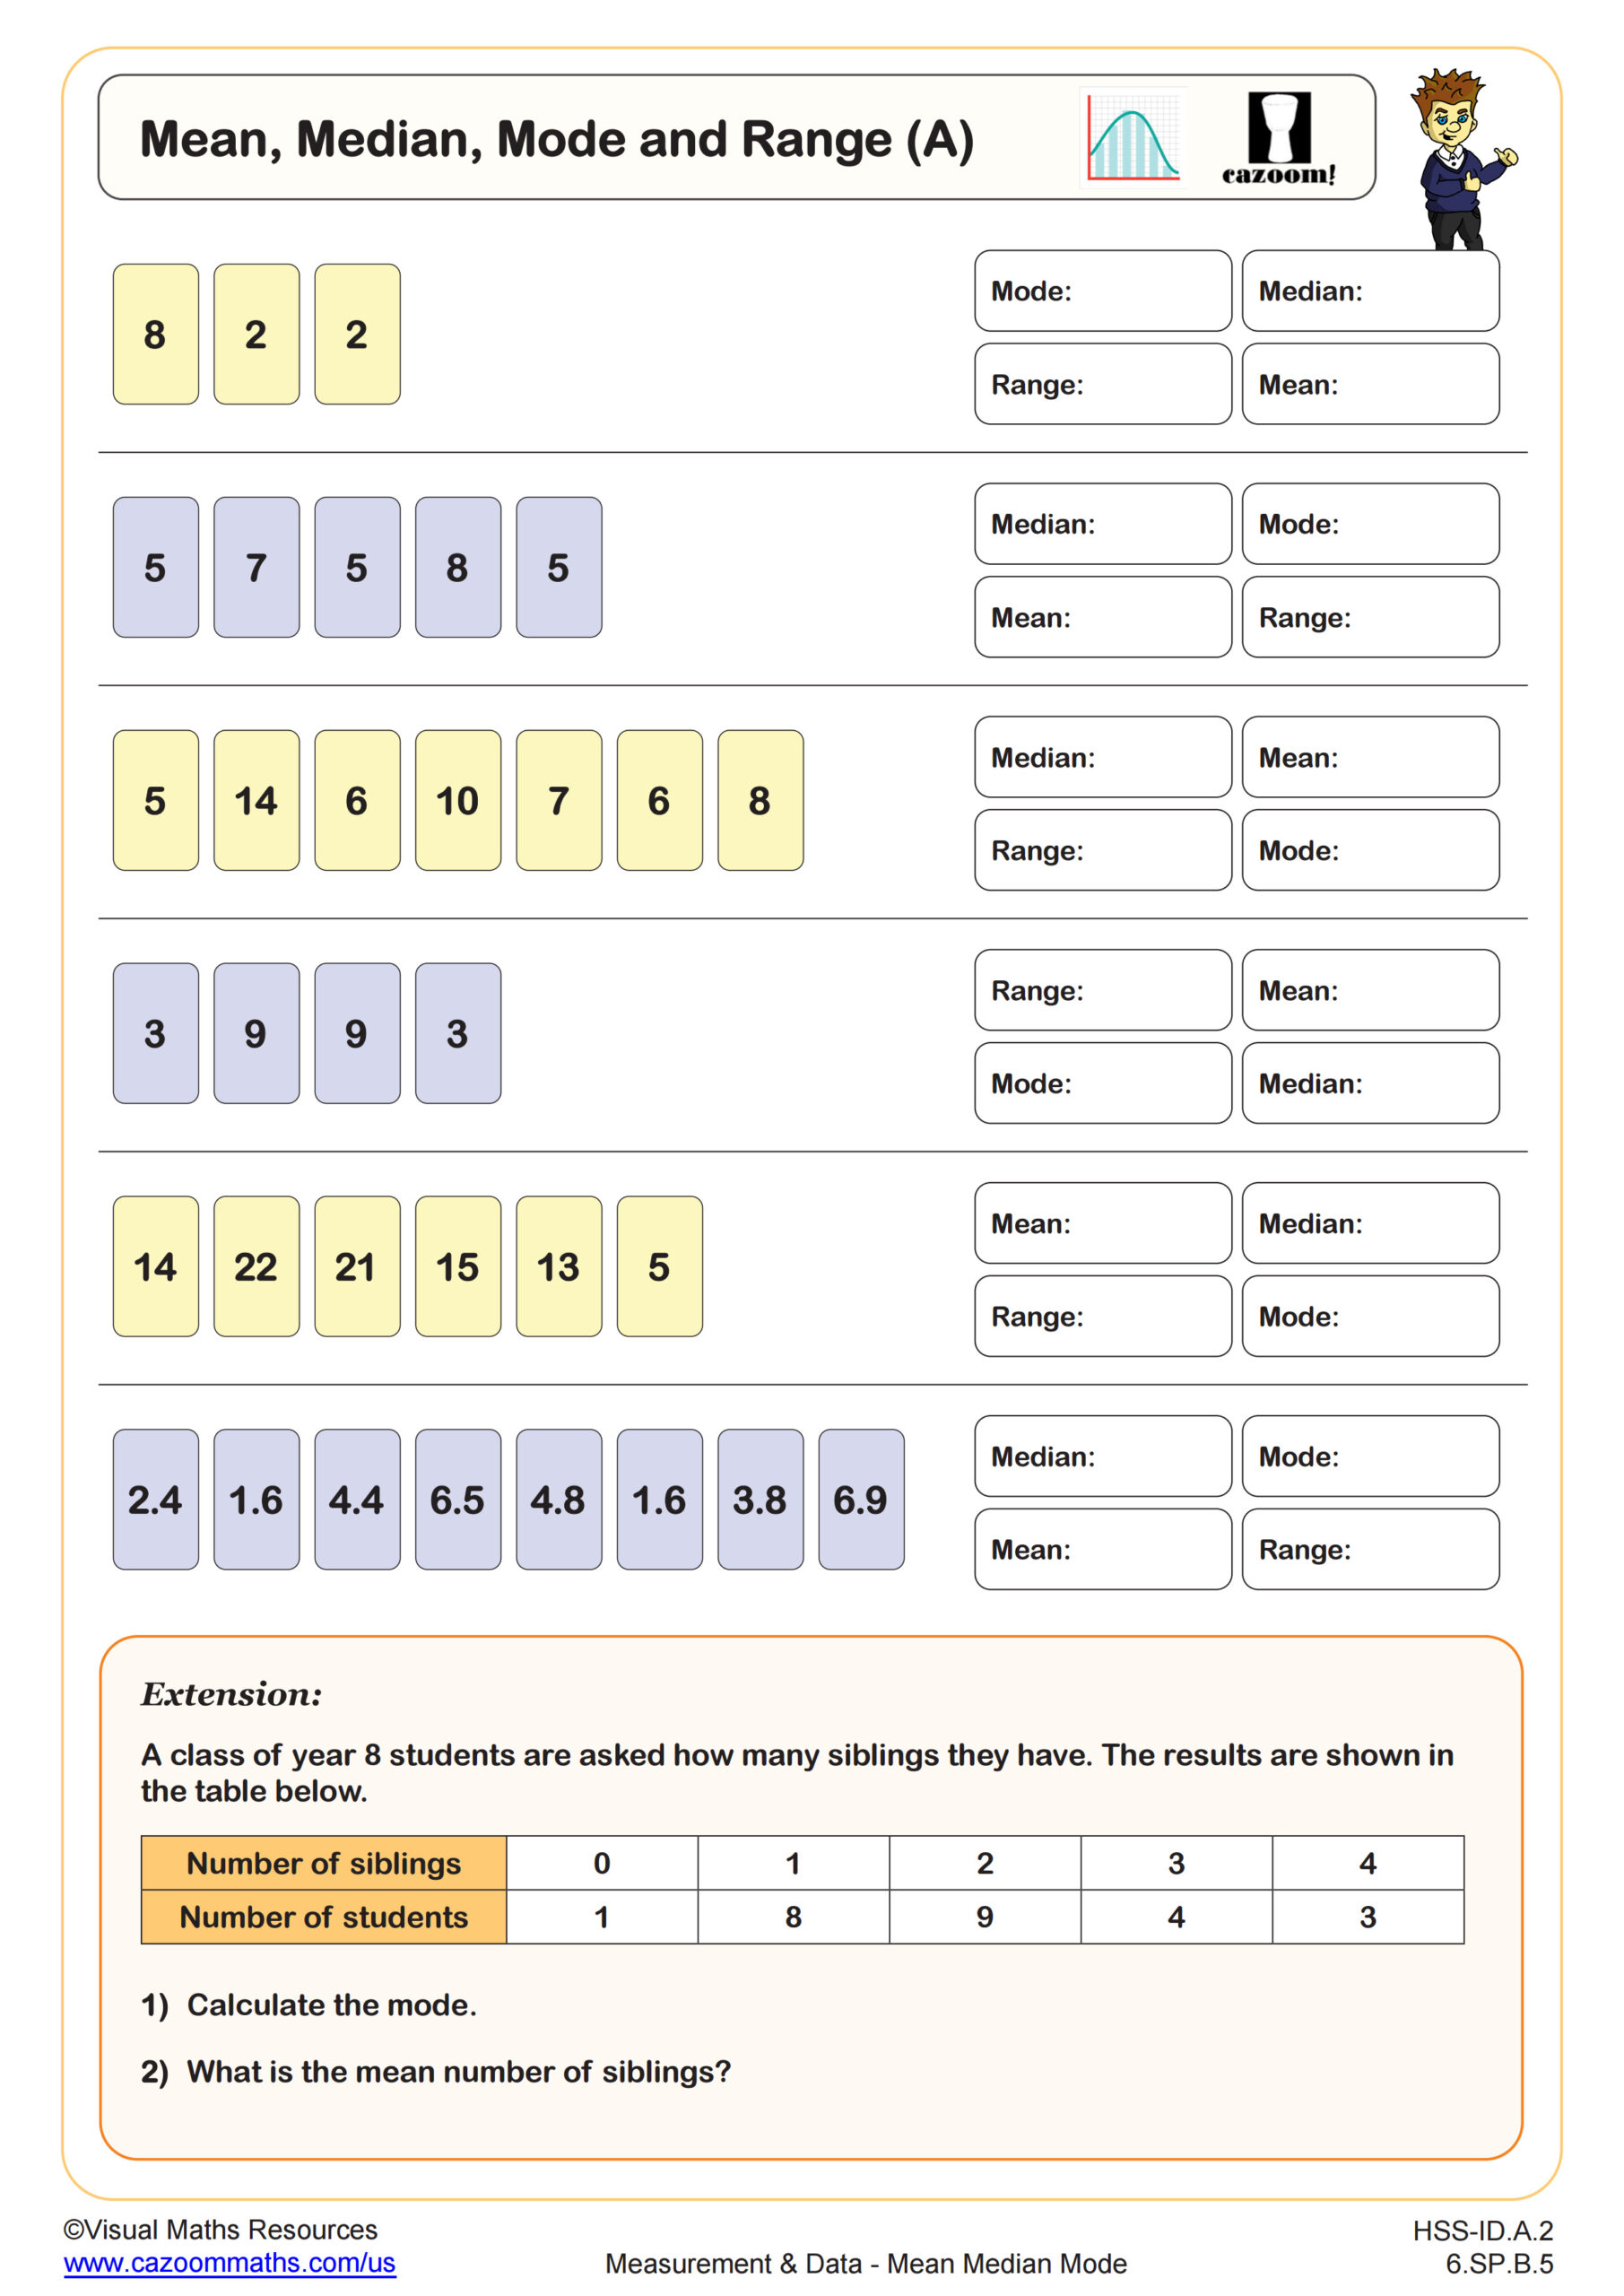
Mean, Median, Mode and Range (A)
Grades: 6th Grade, Algebra I
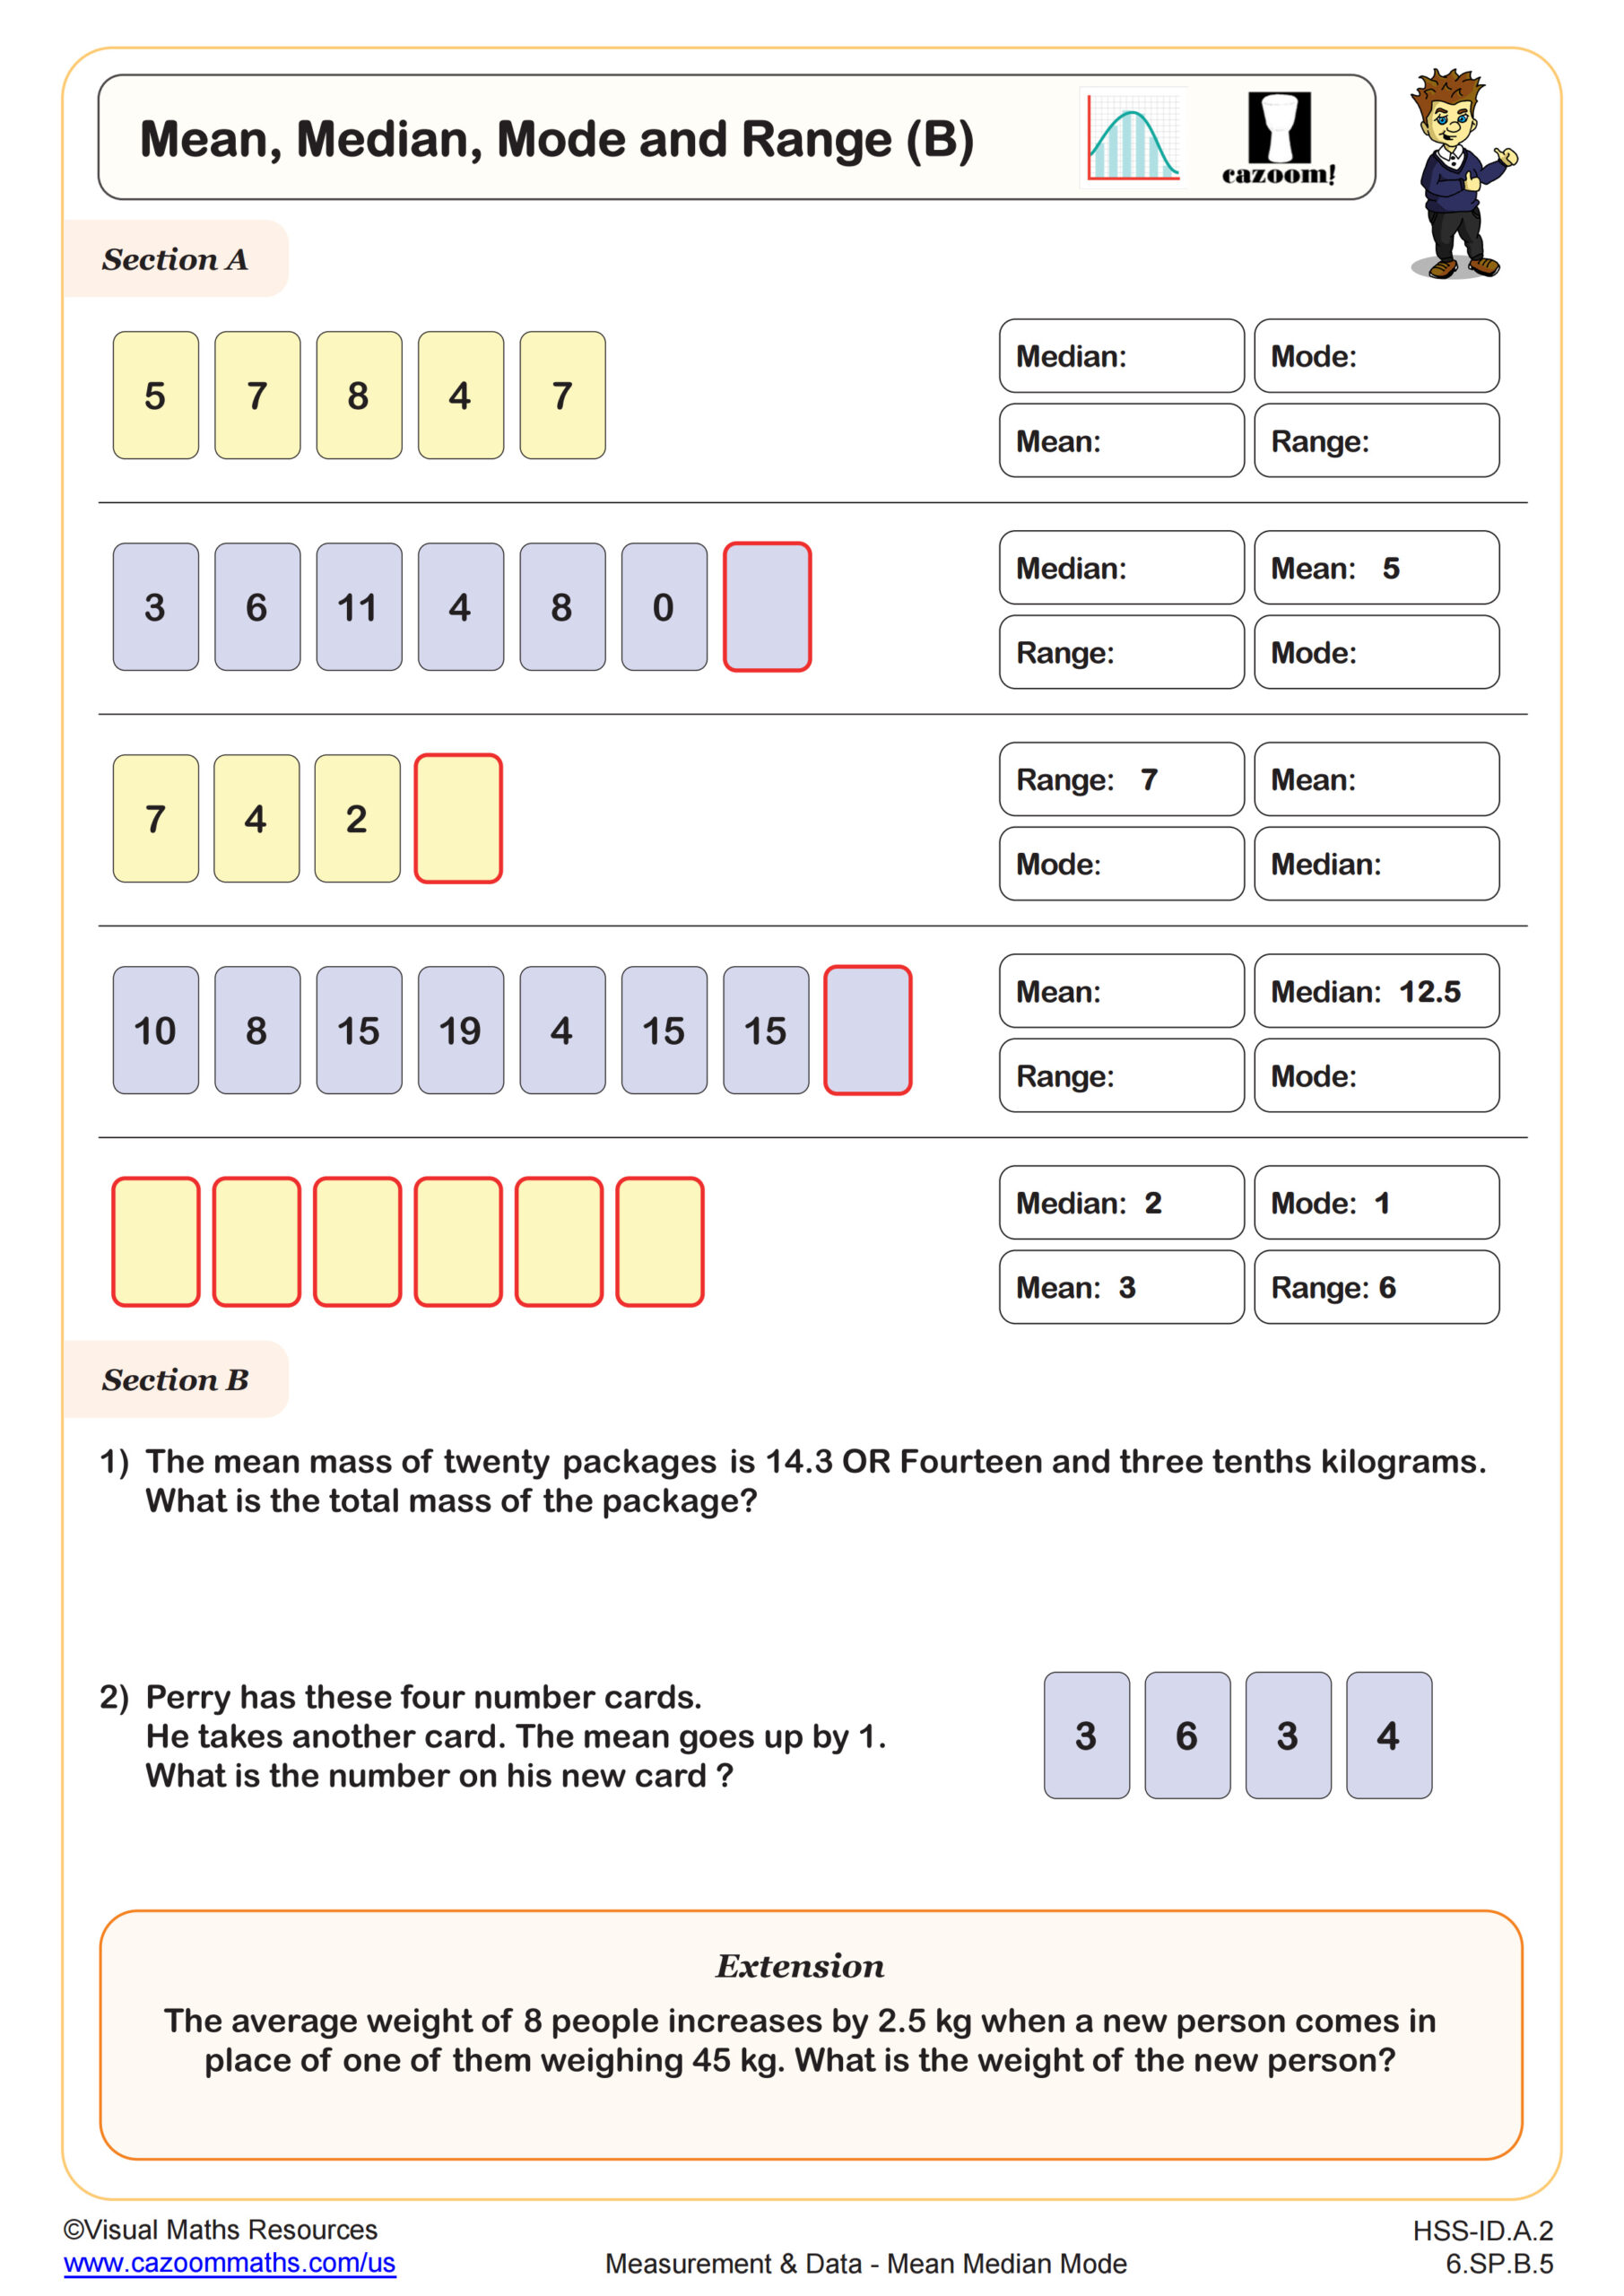
Mean, Median, Mode and Range (B)
Grades: 6th Grade, Algebra I
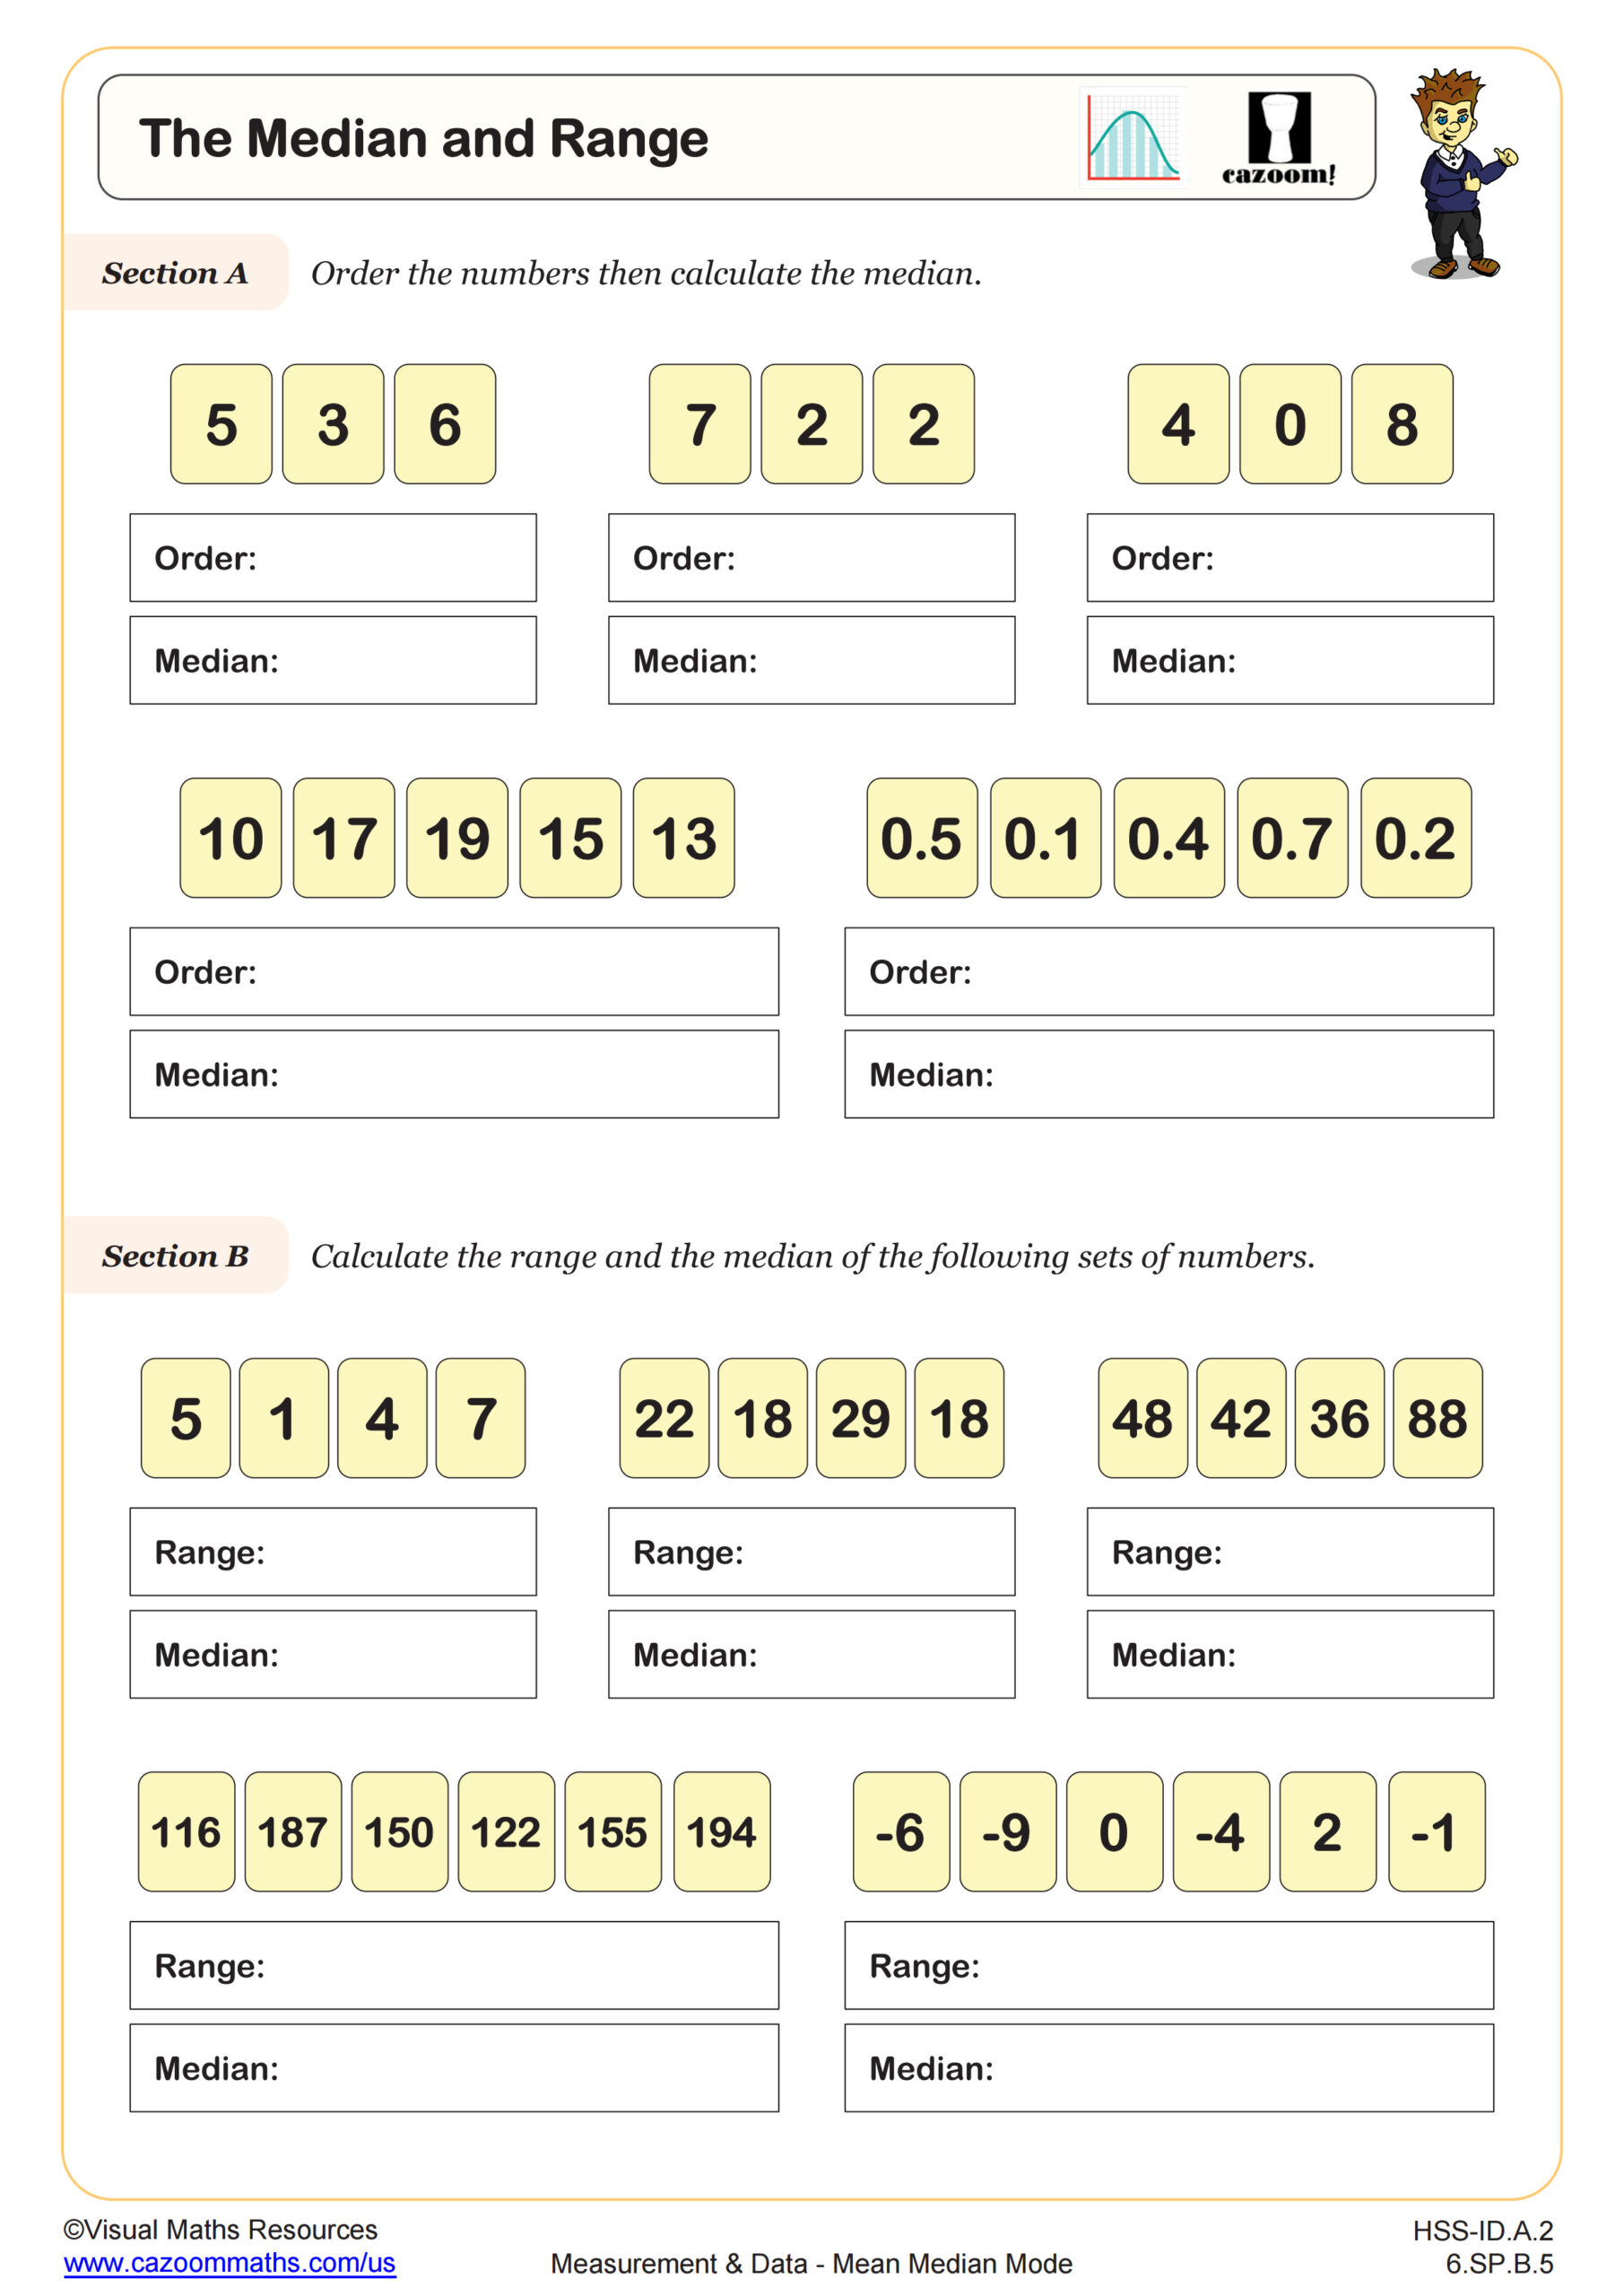
Median and Range
Grades: 6th Grade, Algebra I
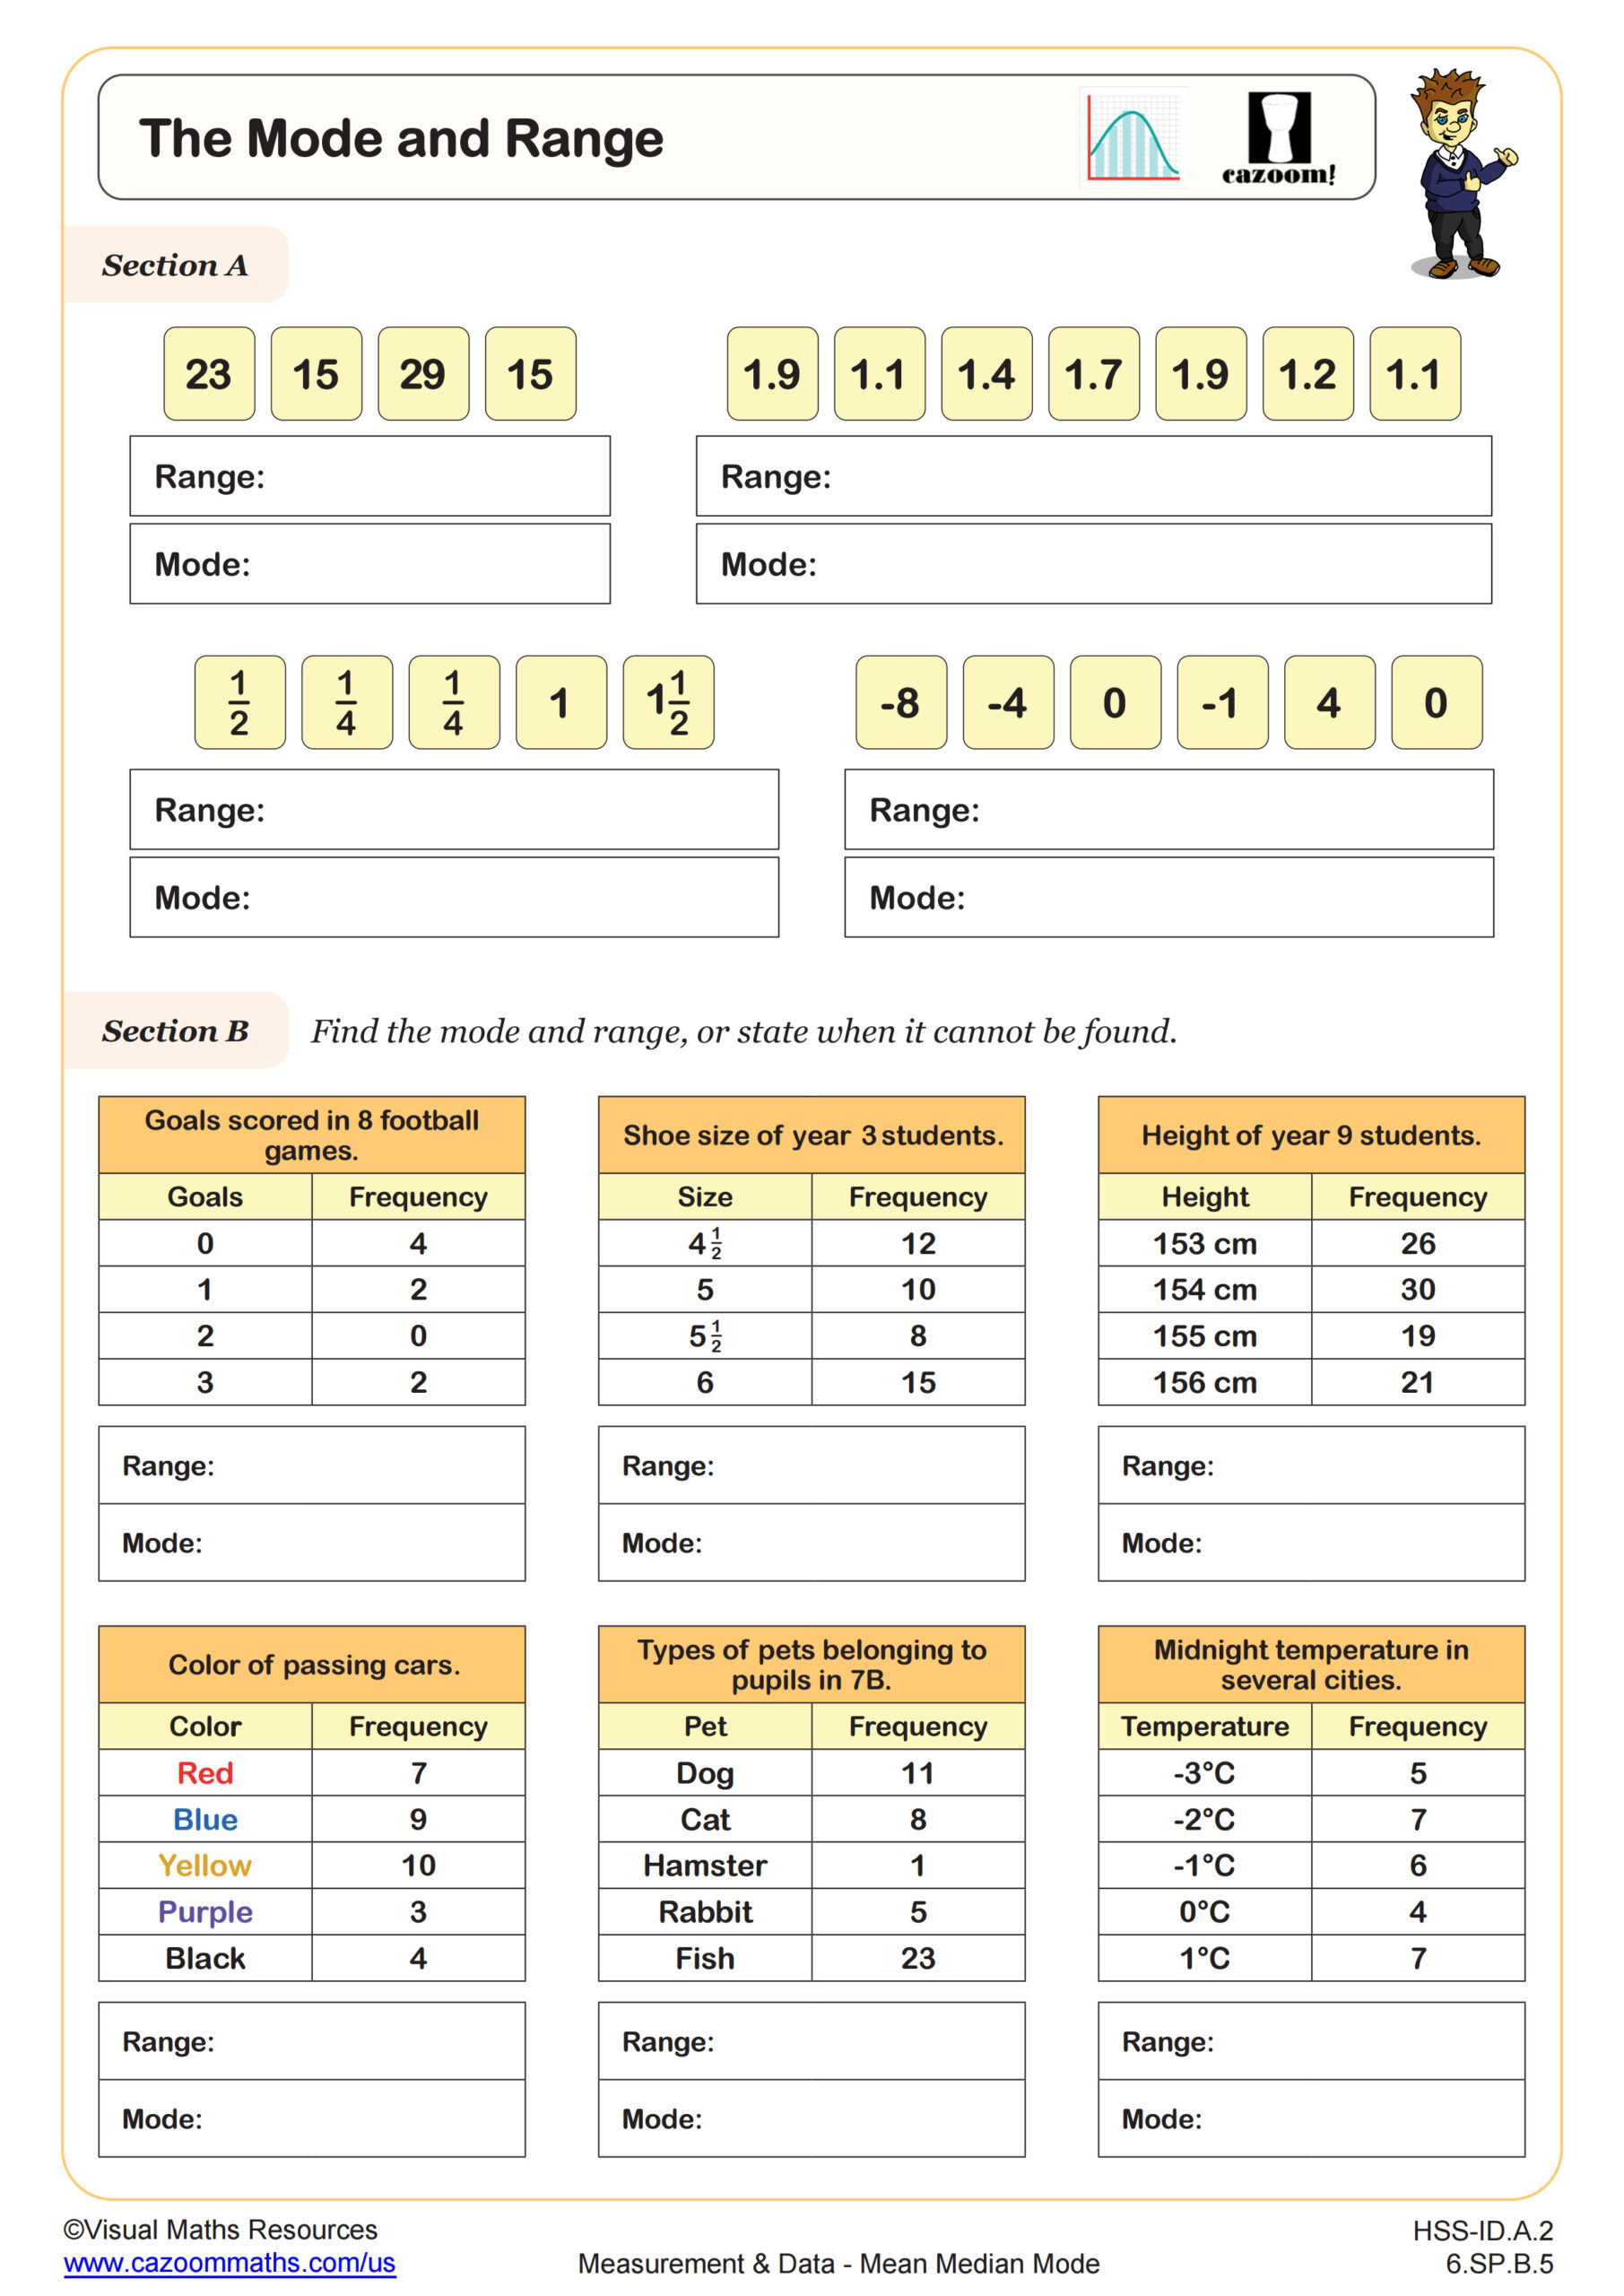
Mode and Range
Grades: 6th Grade, Algebra I
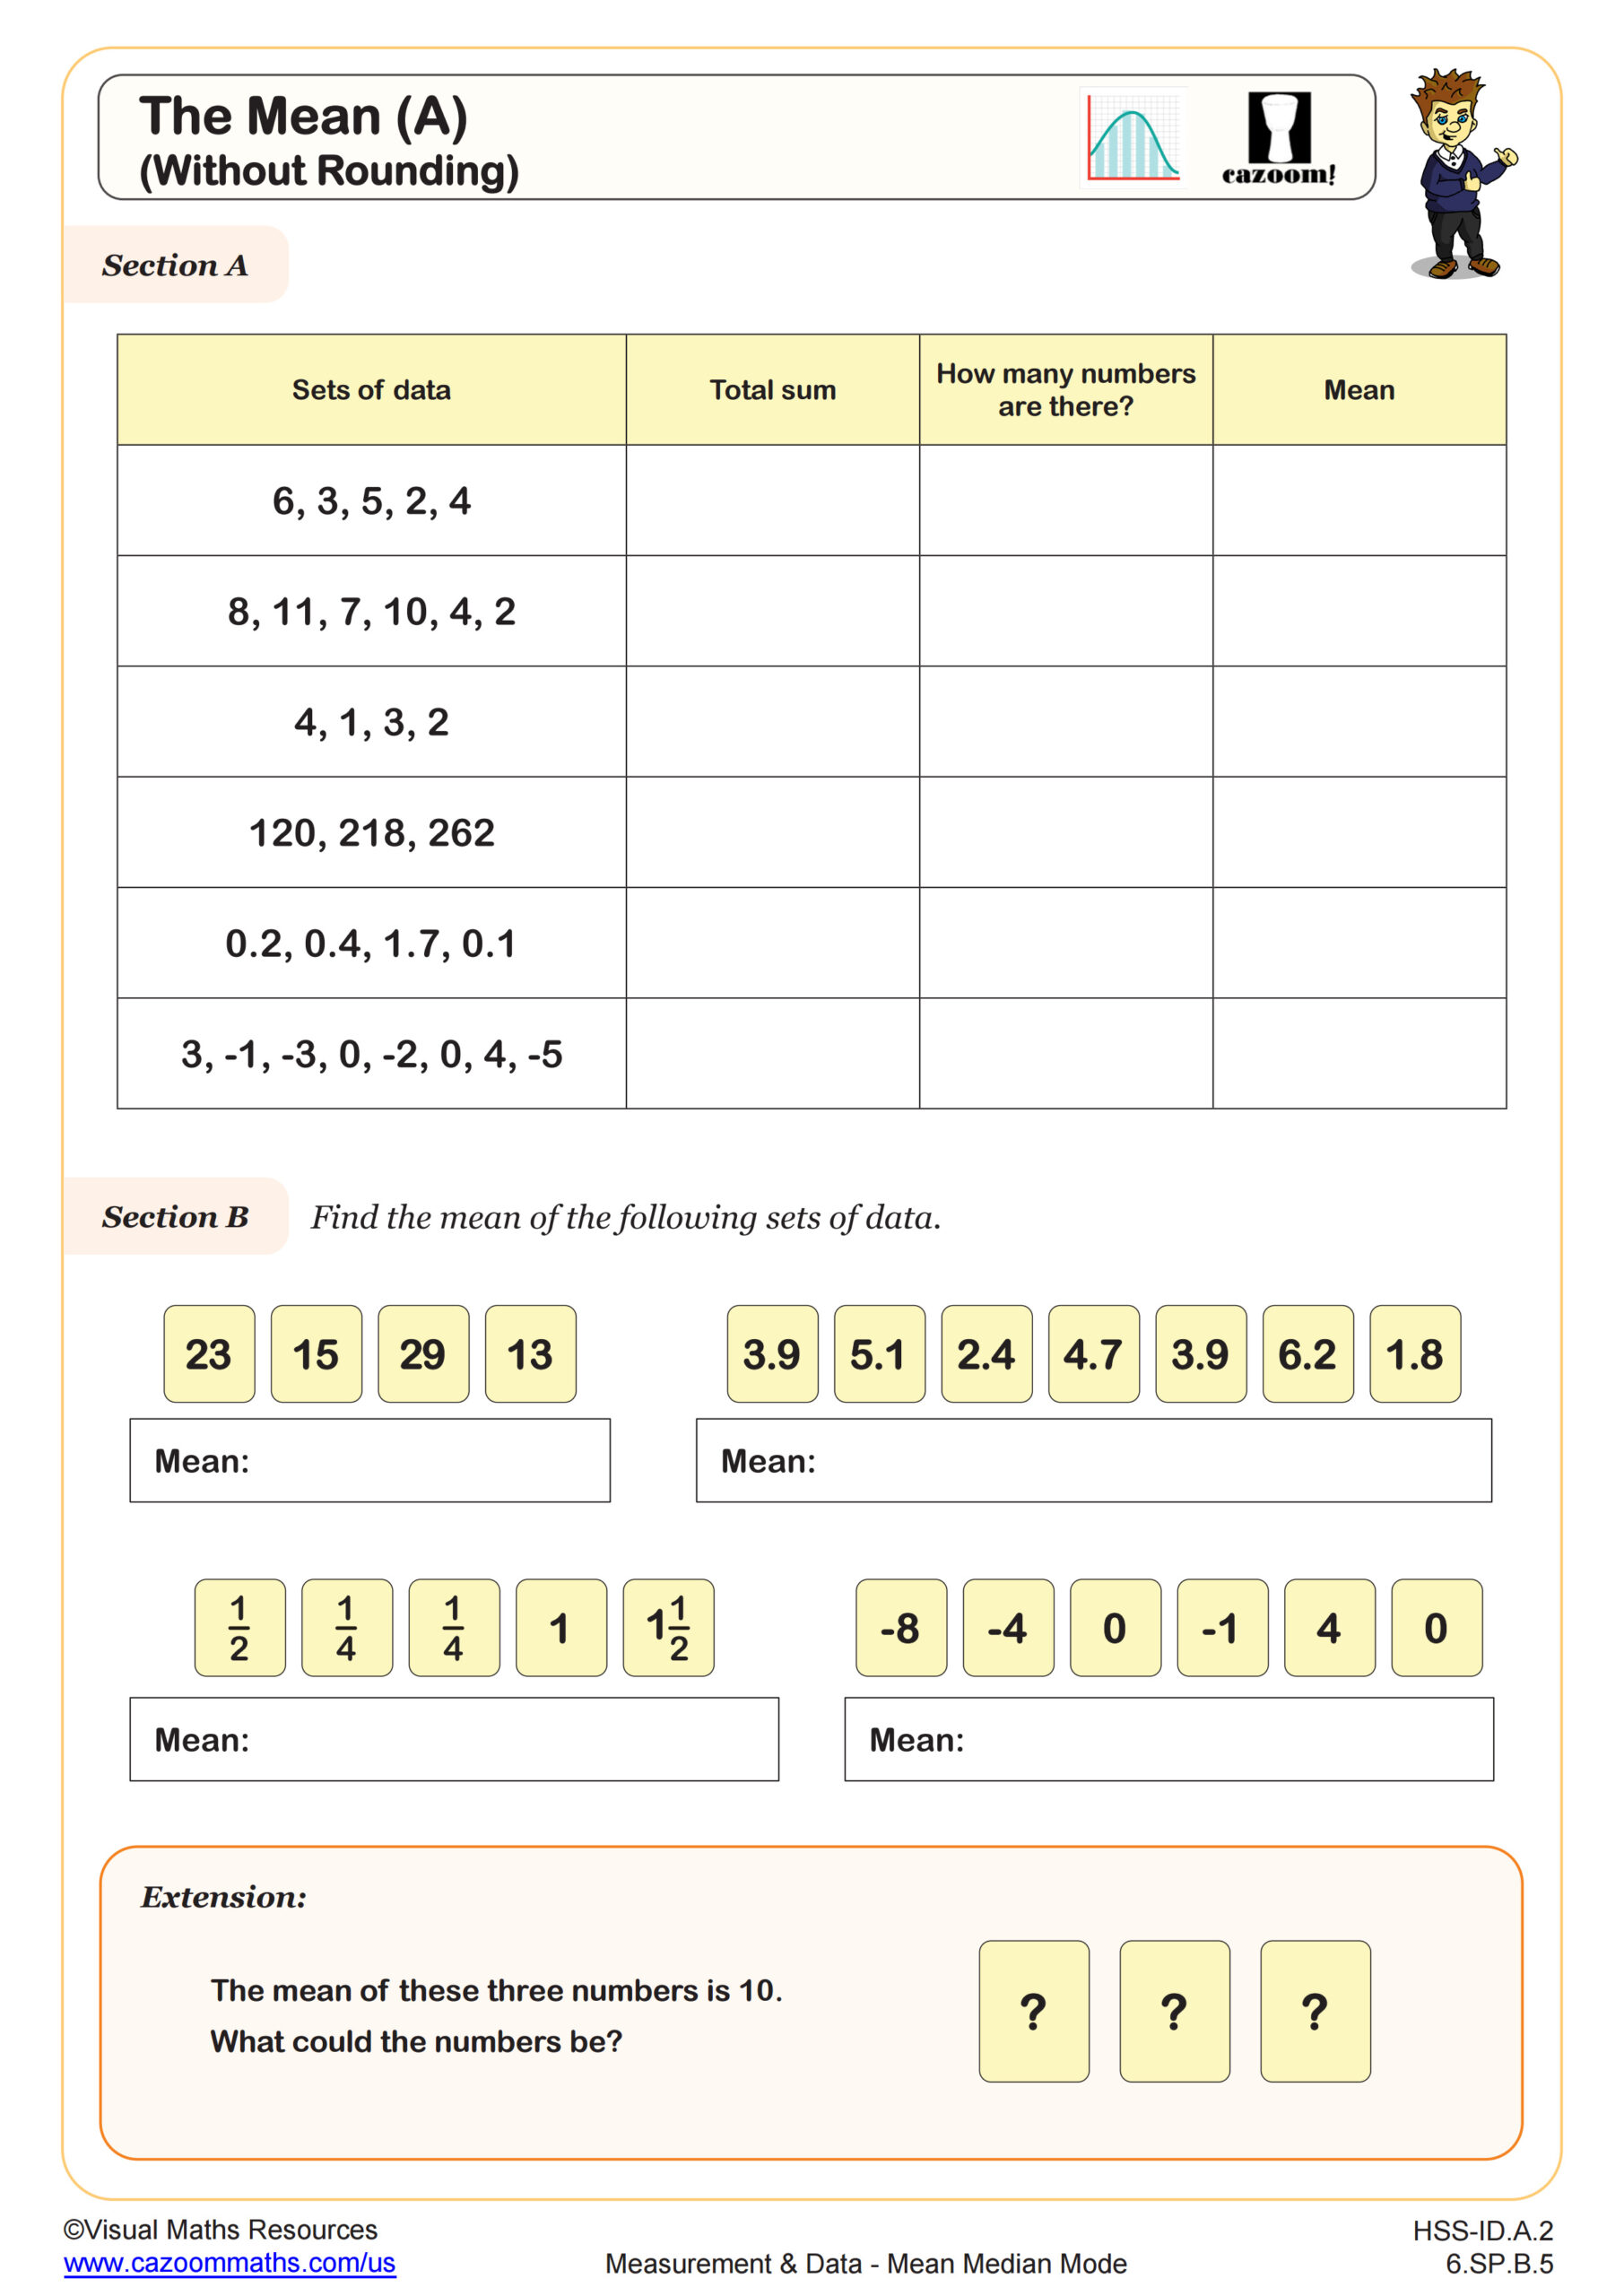
The Mean (A)
Grades: 6th Grade, Algebra I
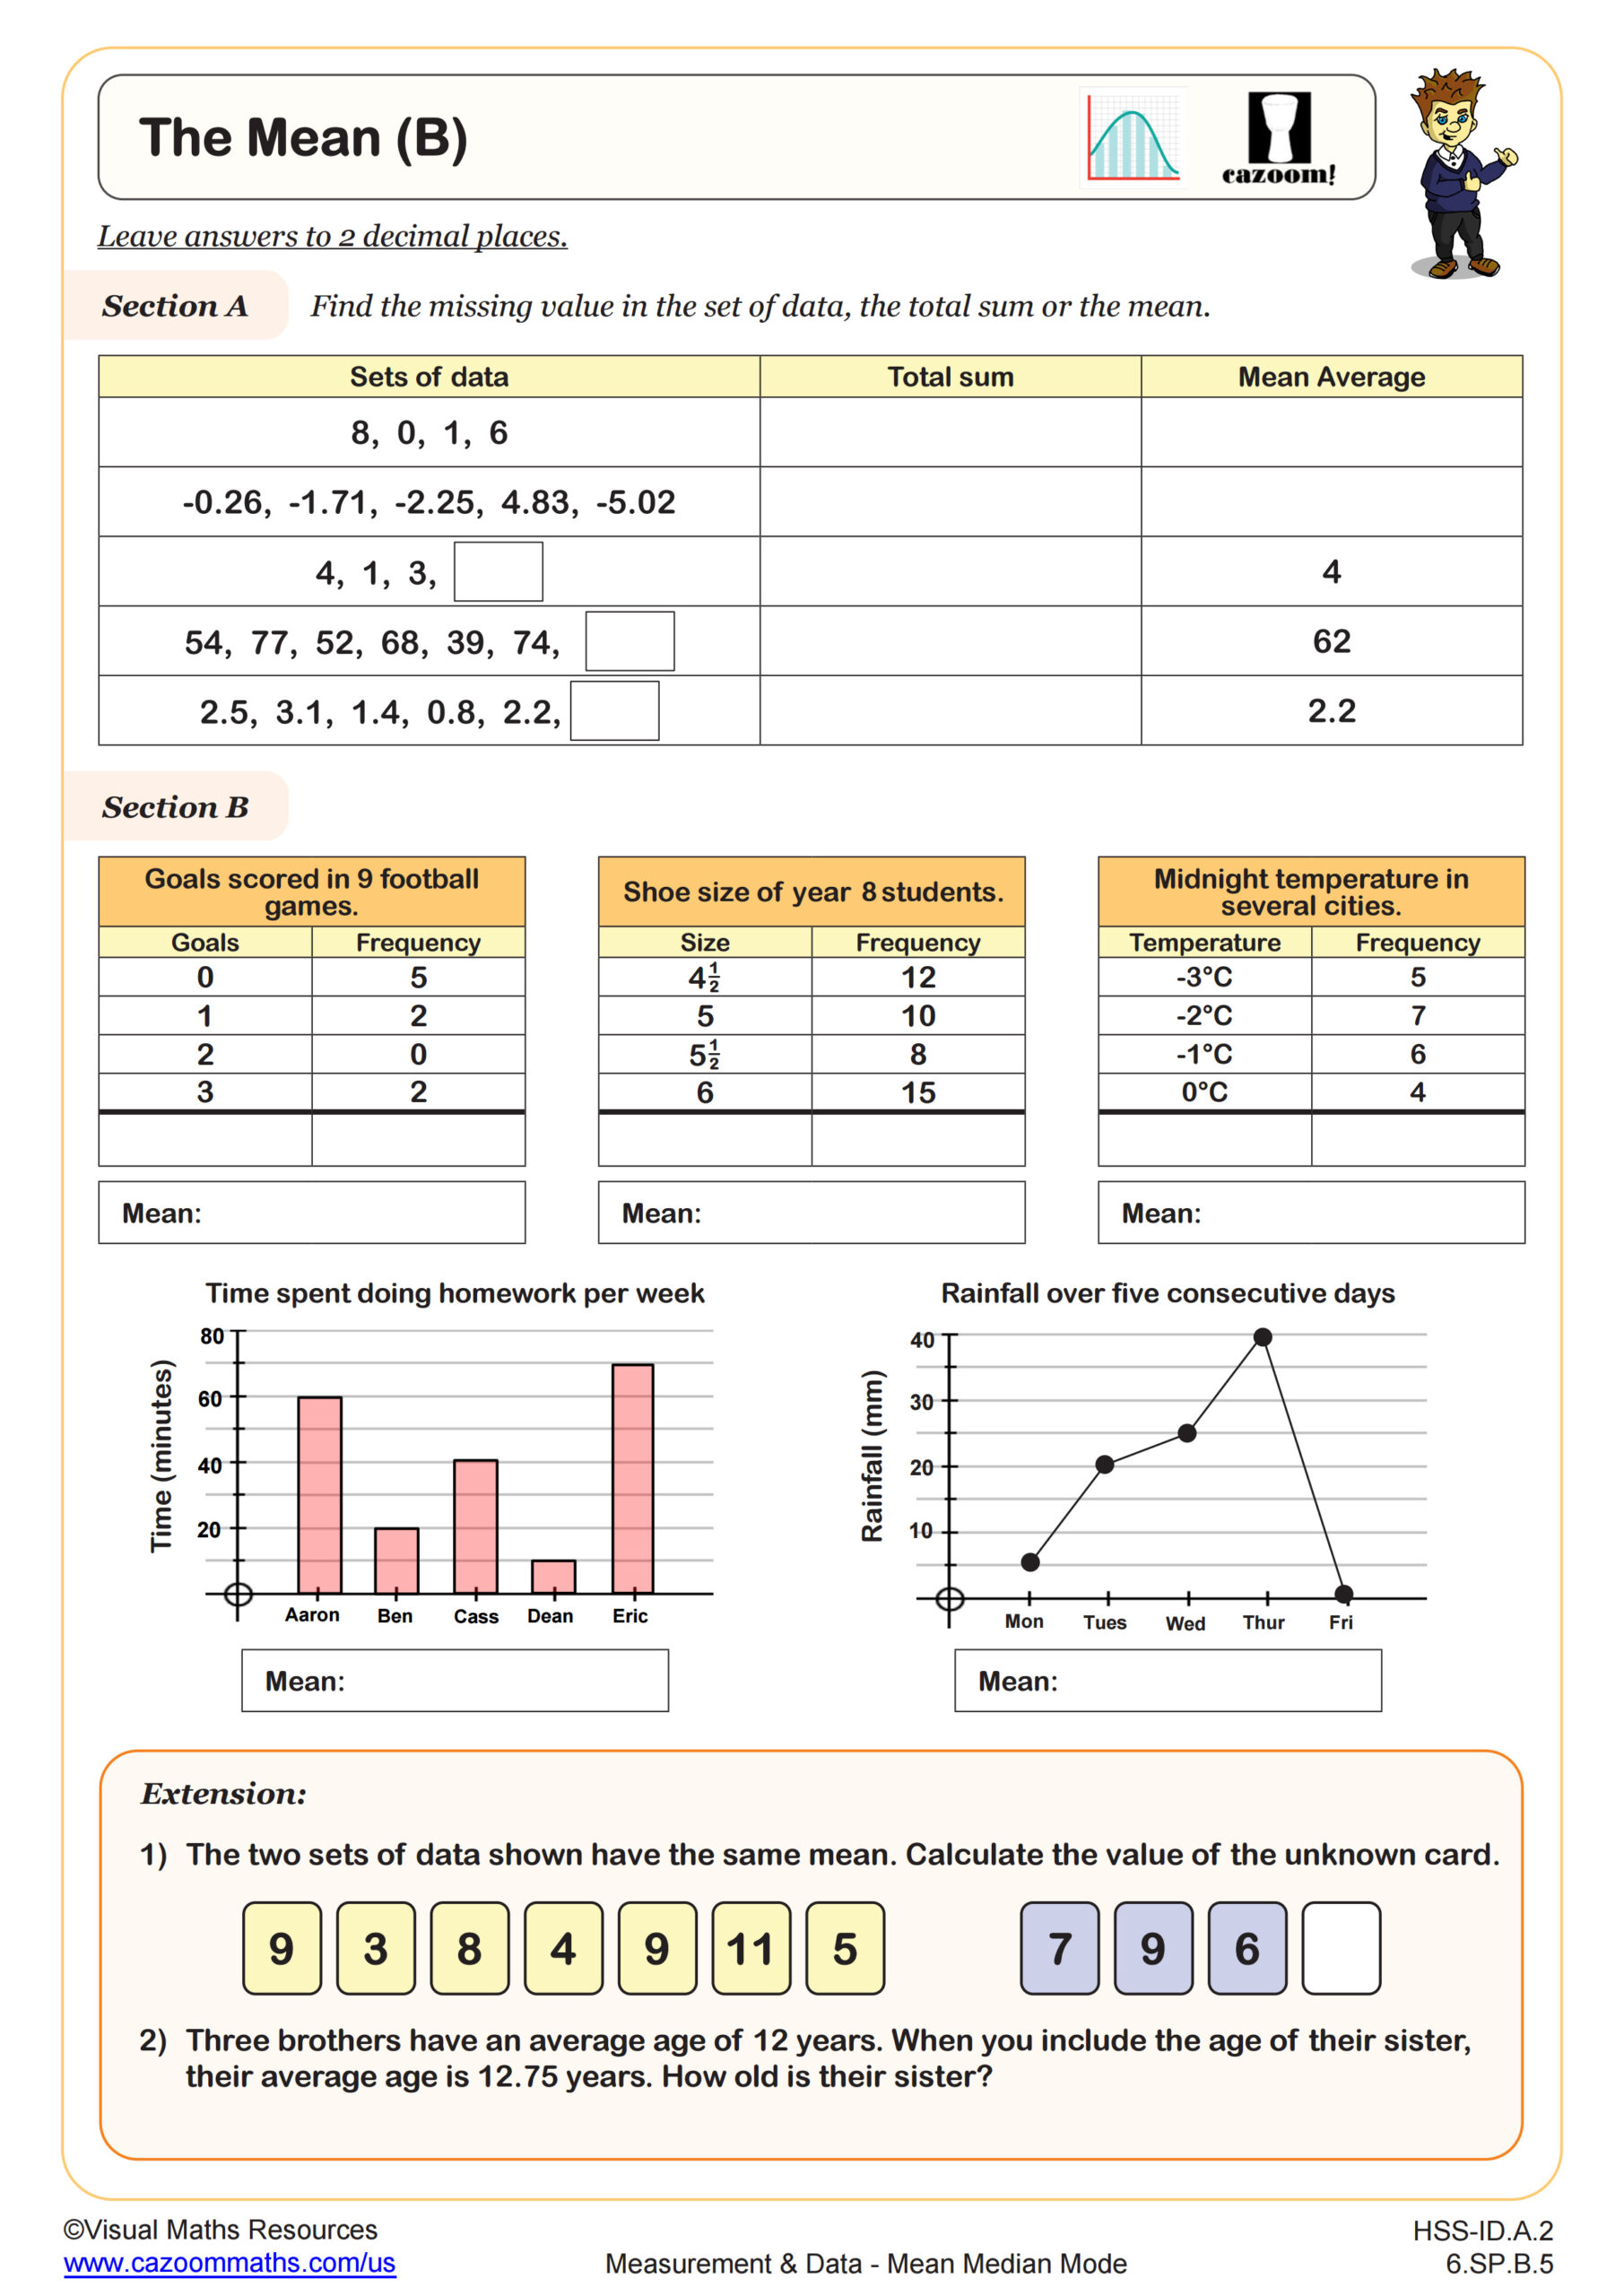
The Mean (B)
Grades: 6th Grade, Algebra I
All worksheets are created by the team of experienced teachers at Cazoom Math.