6th Grade Measurement and Data Worksheets
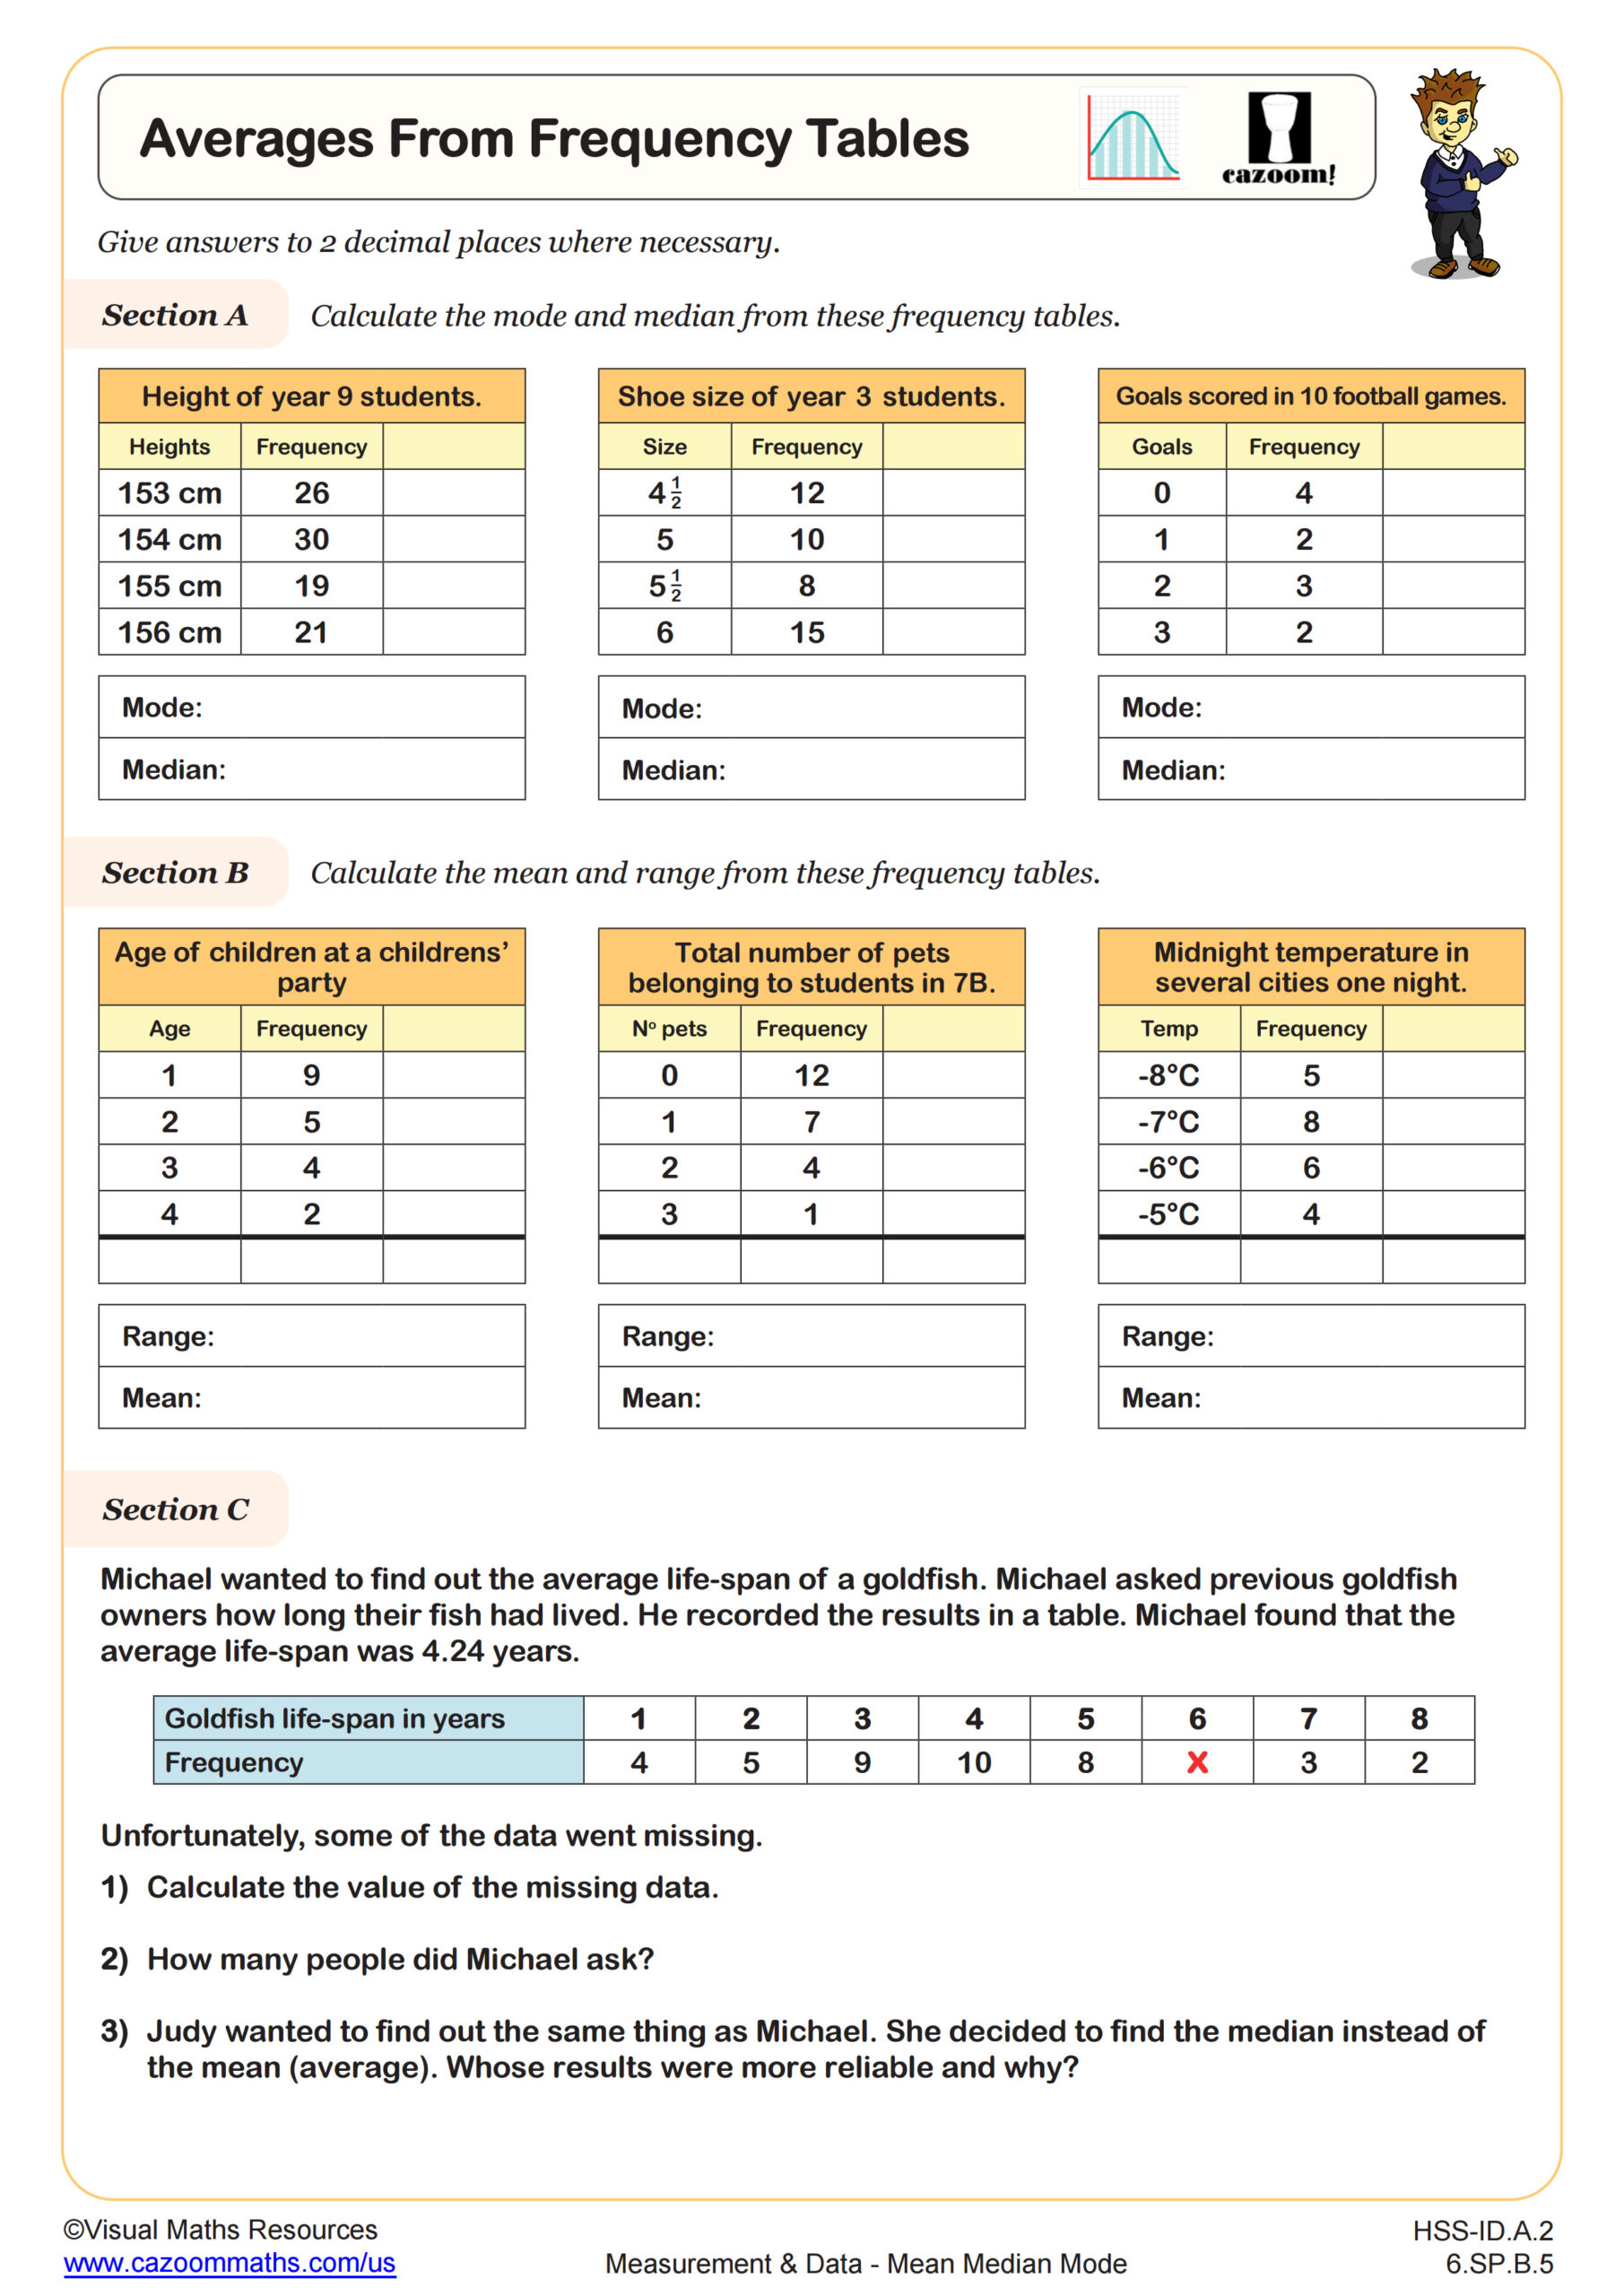
Averages from Frequency Tables
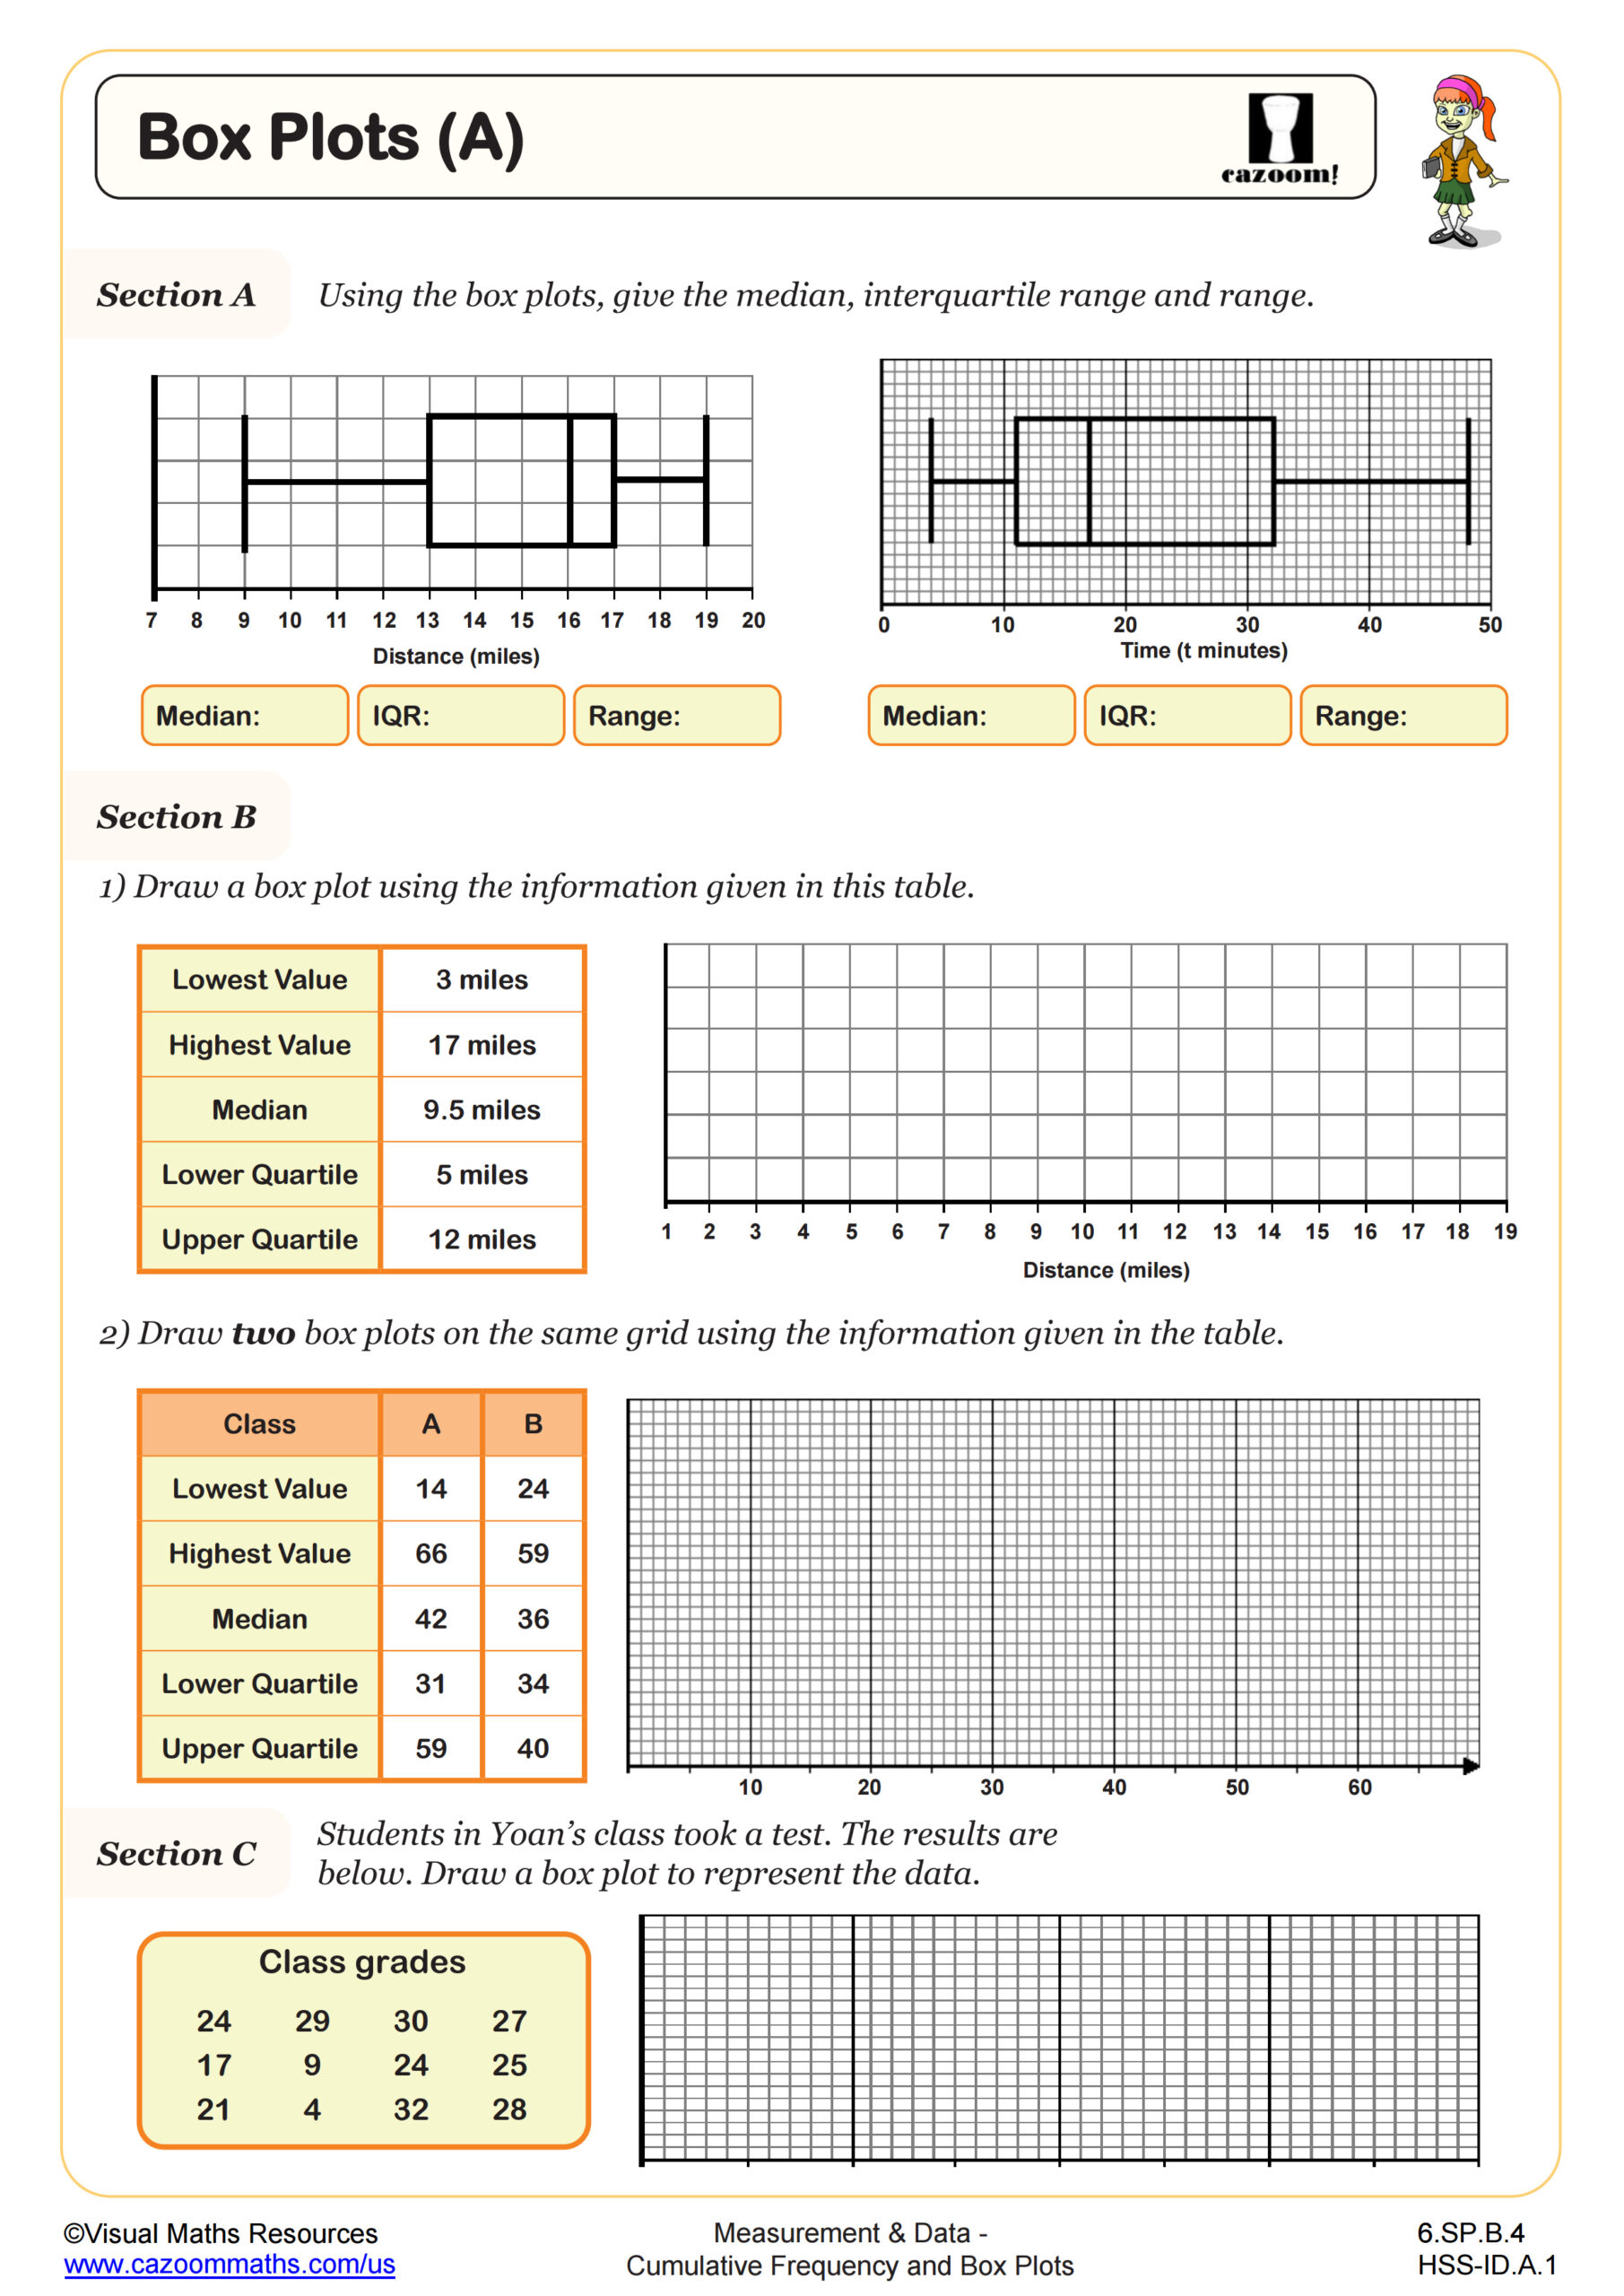
Box Plots (A)
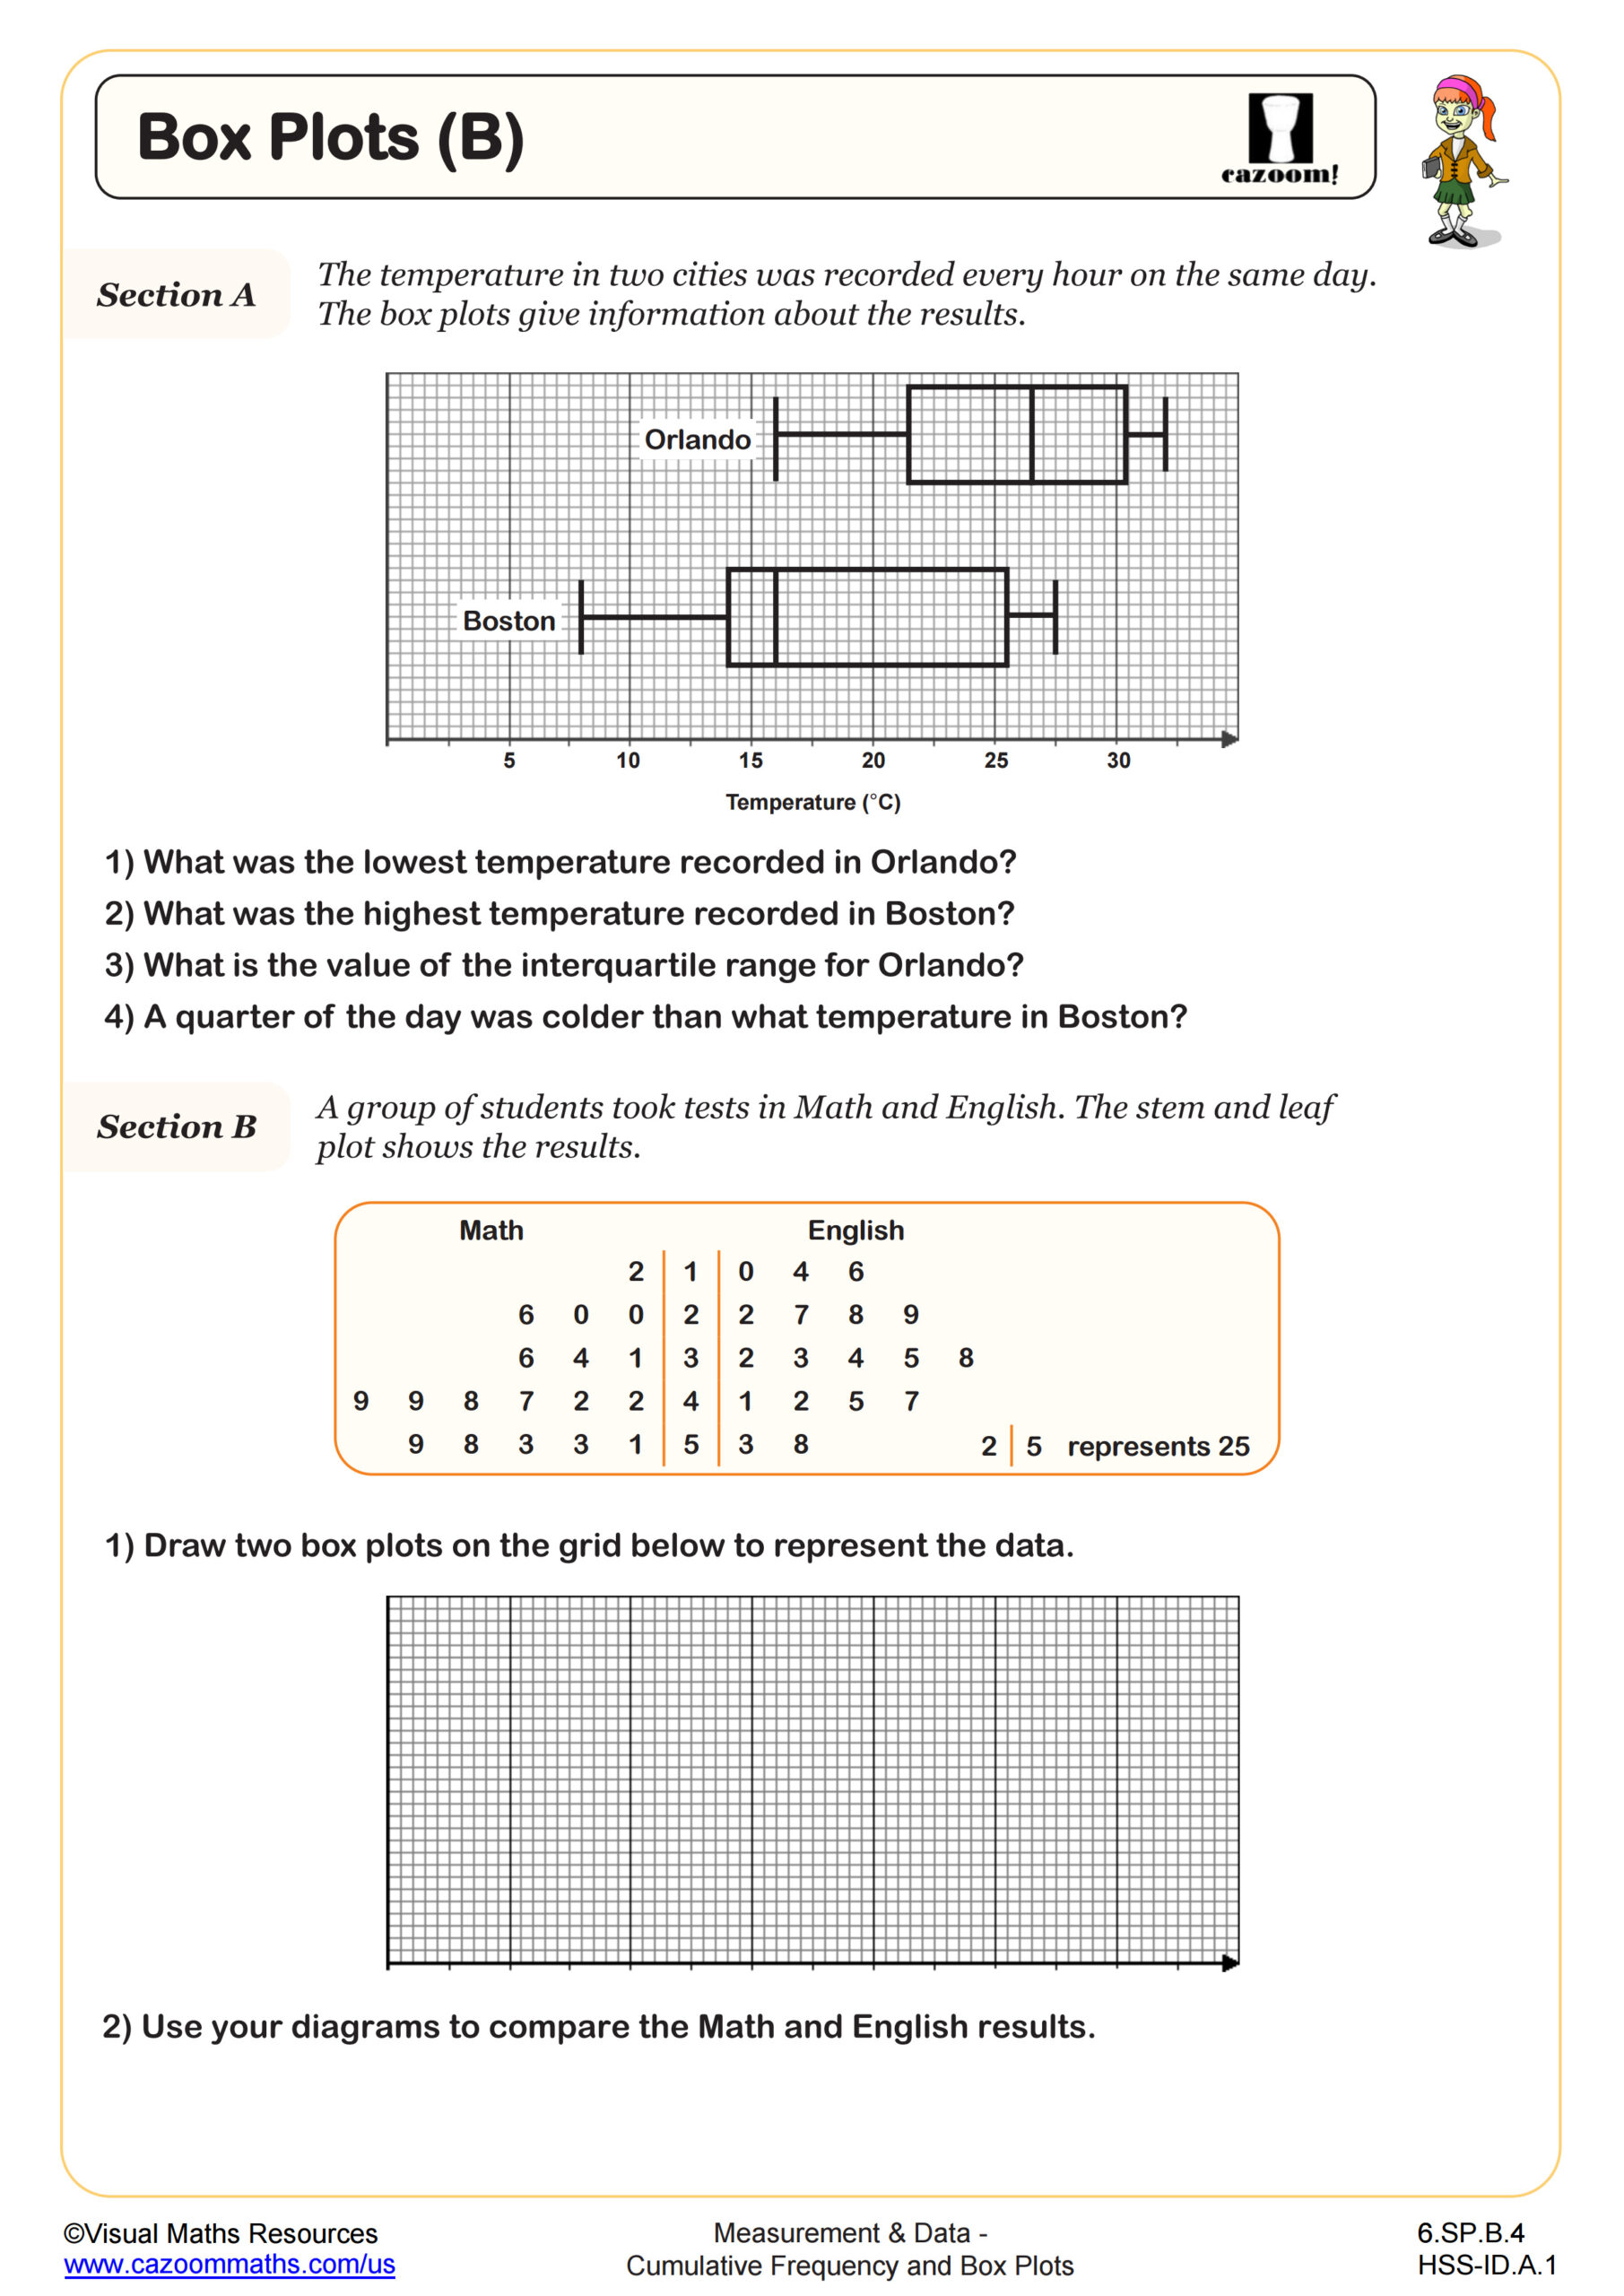
Box Plots (B)
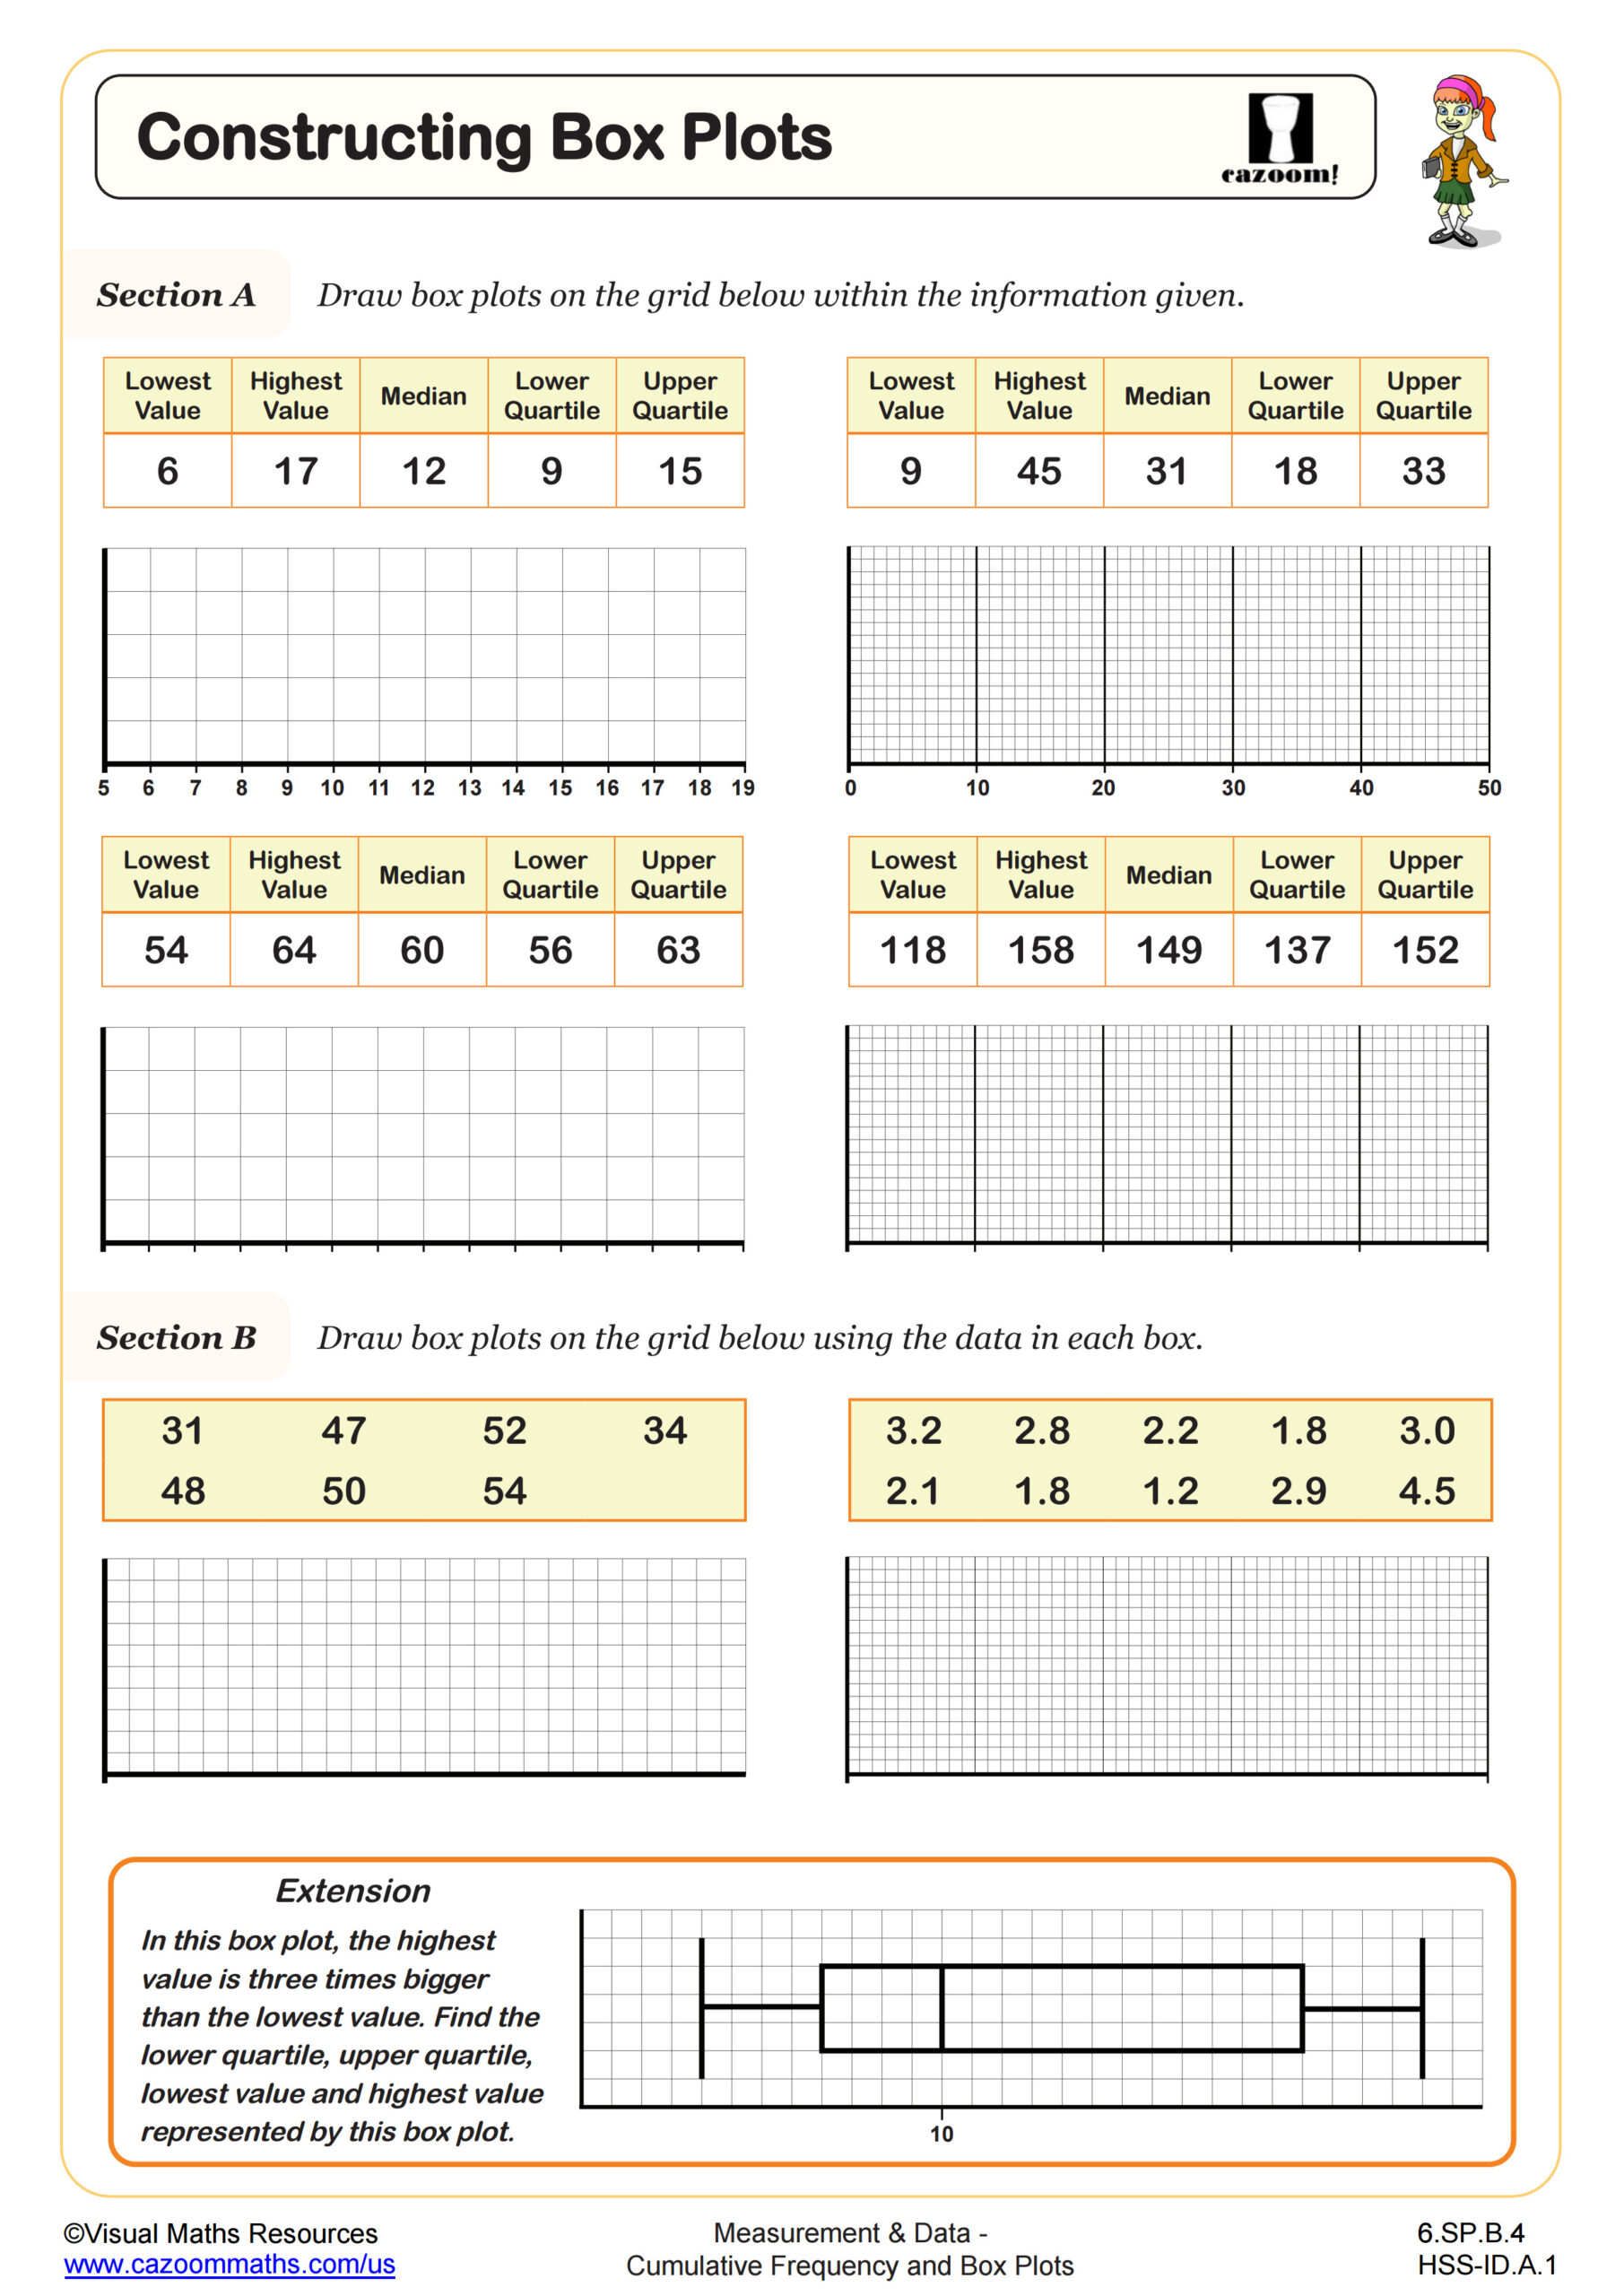
Constructing Box Plots
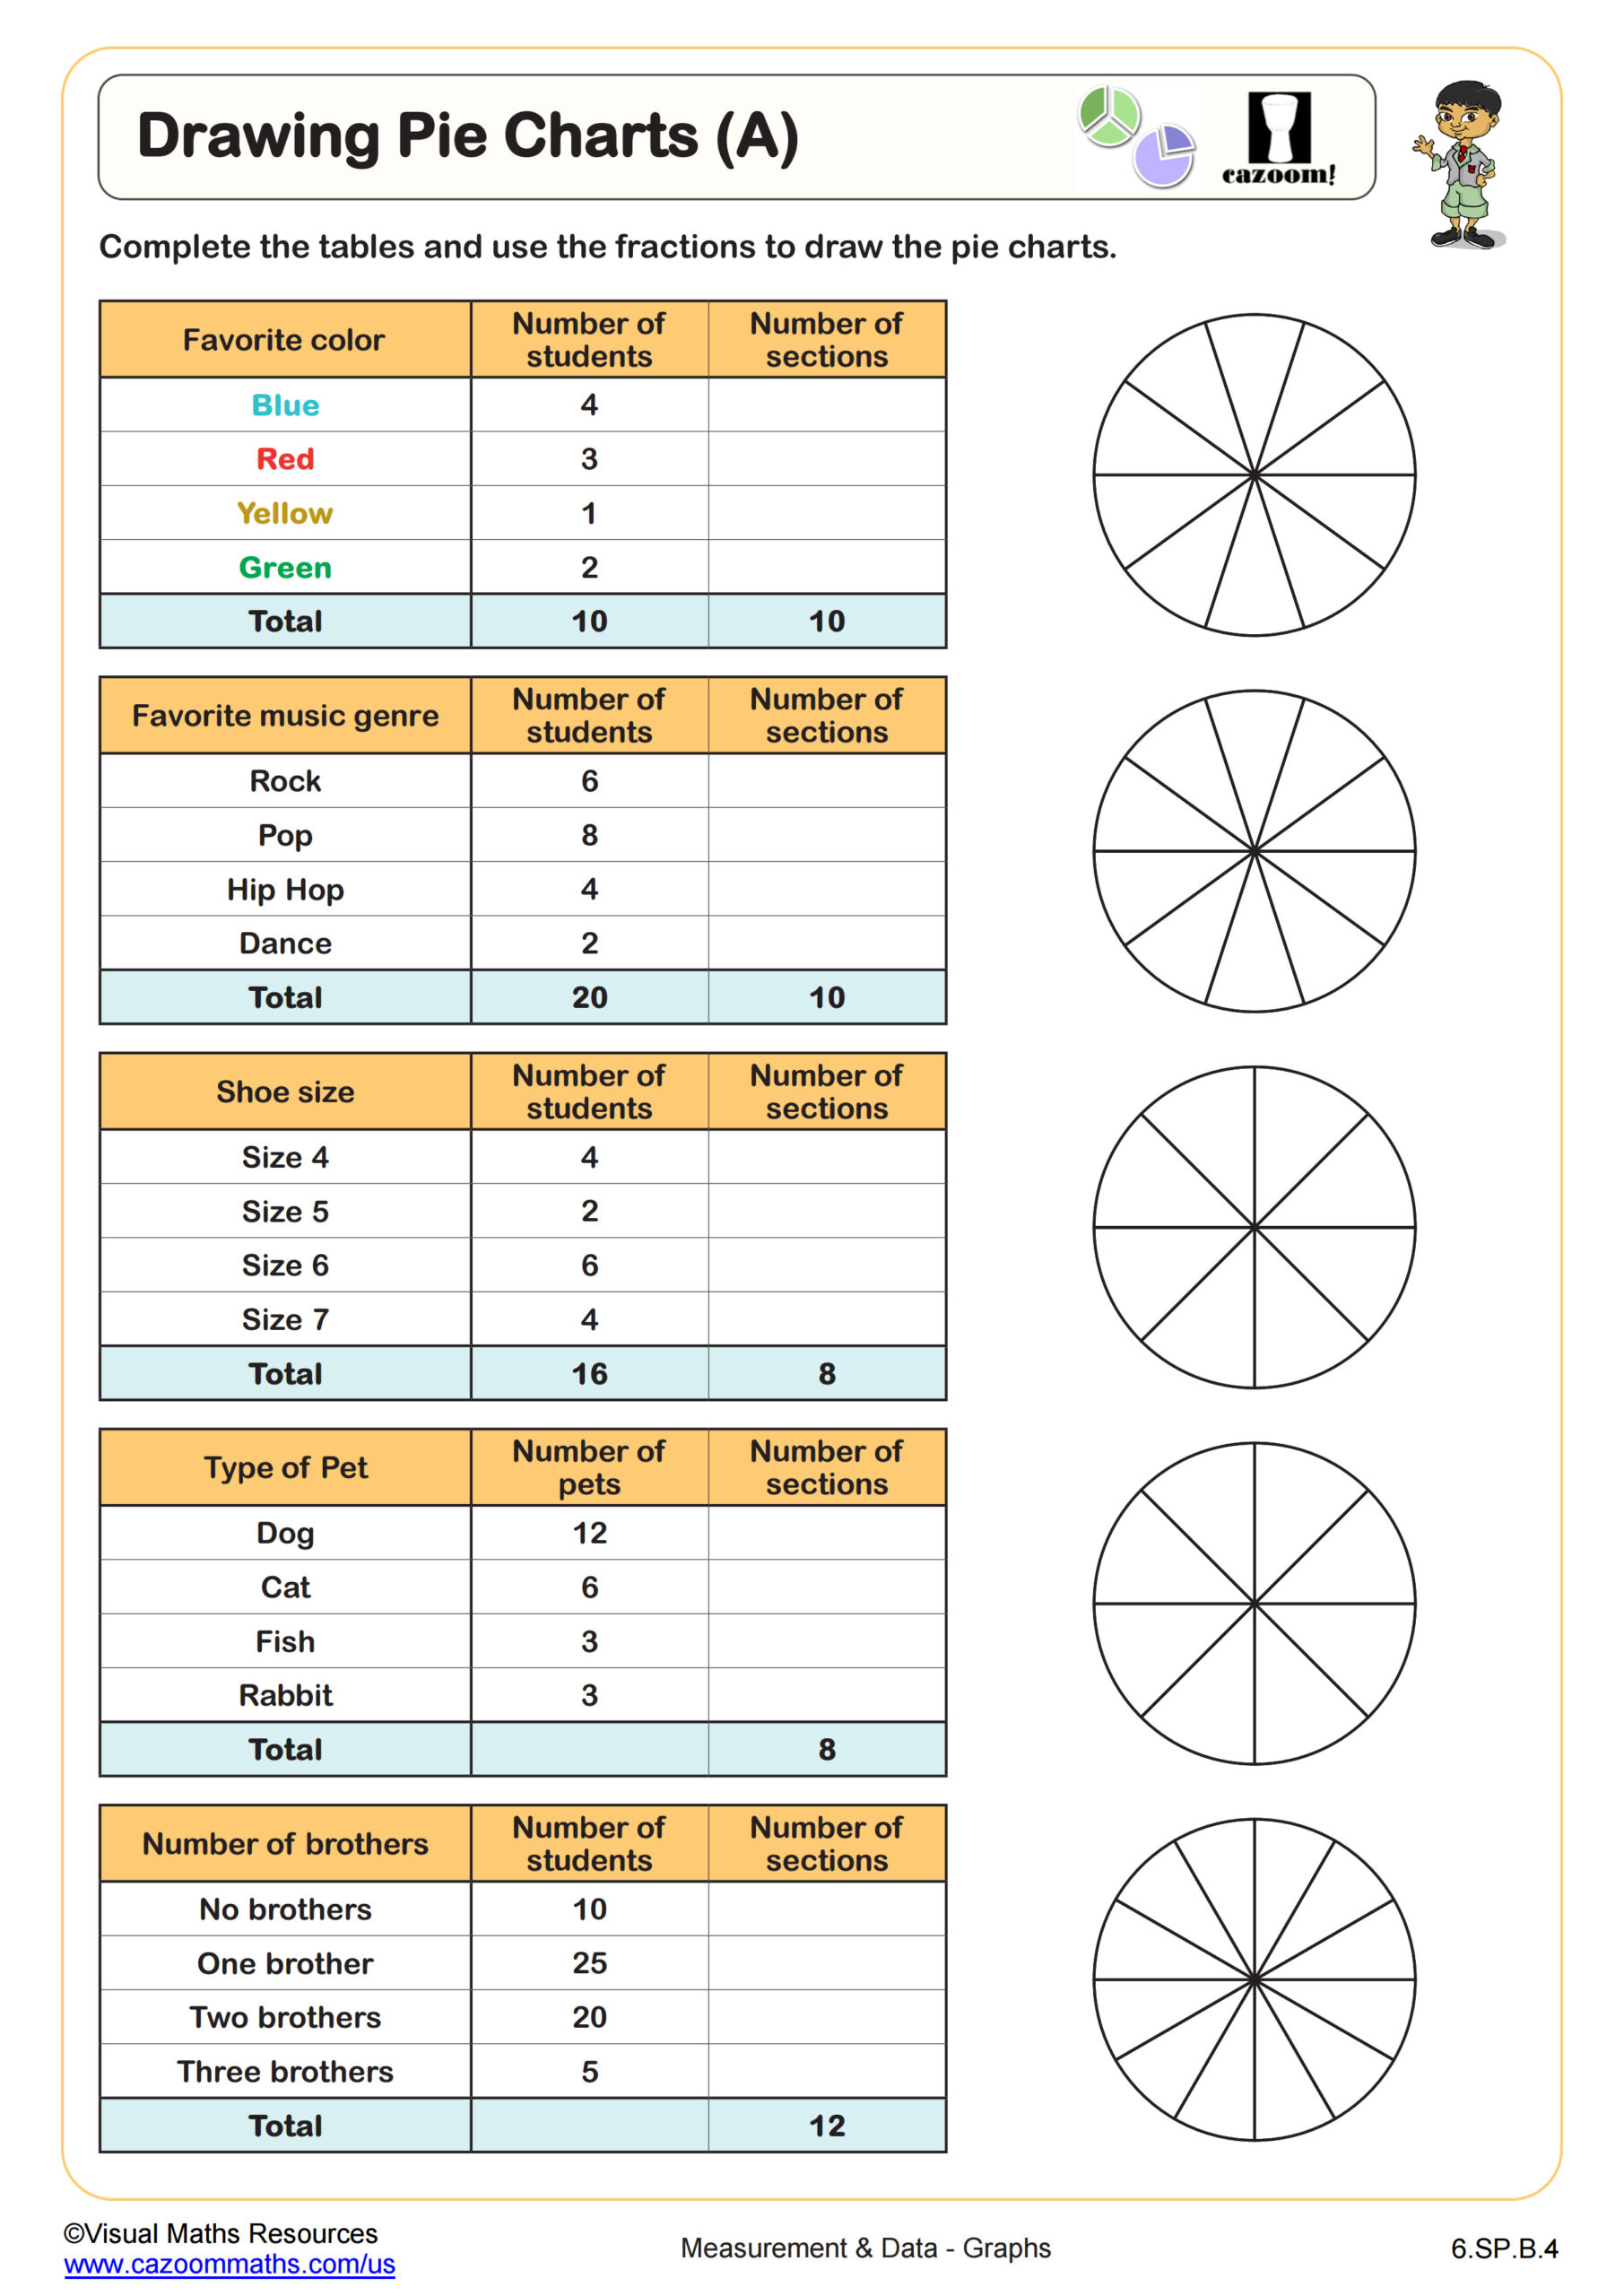
Drawing Pie Charts (A)
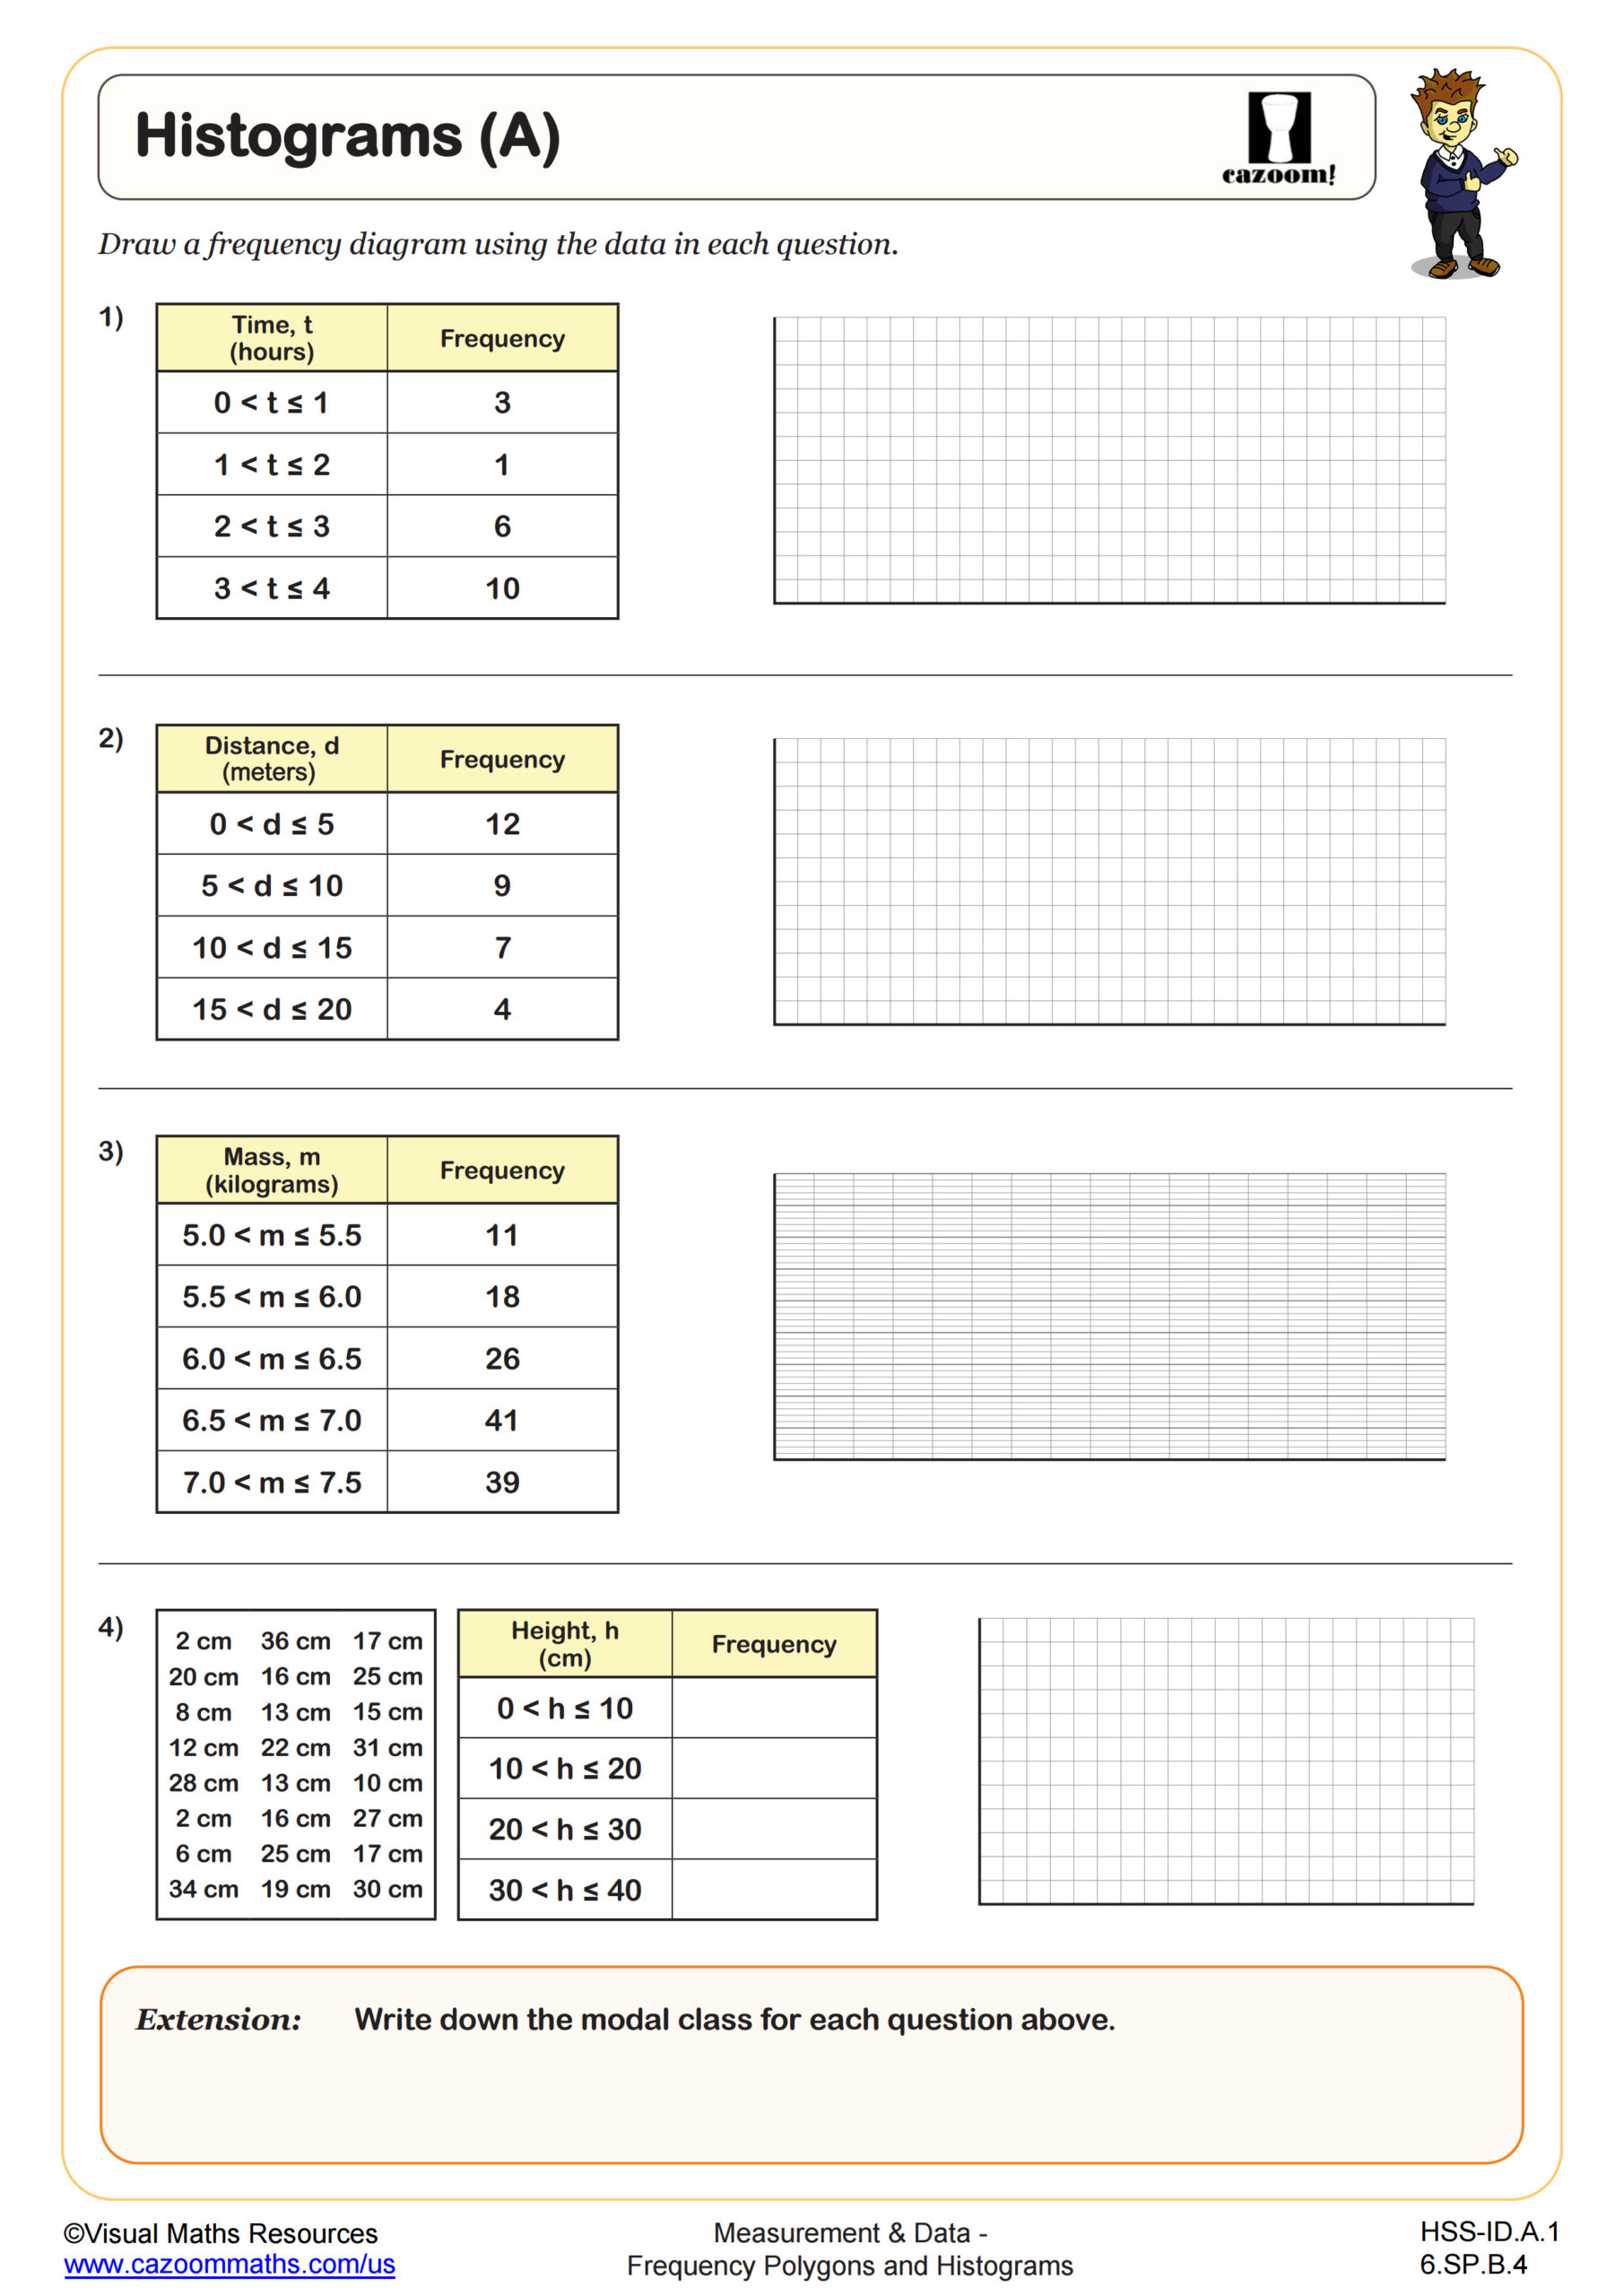
Histograms (A)
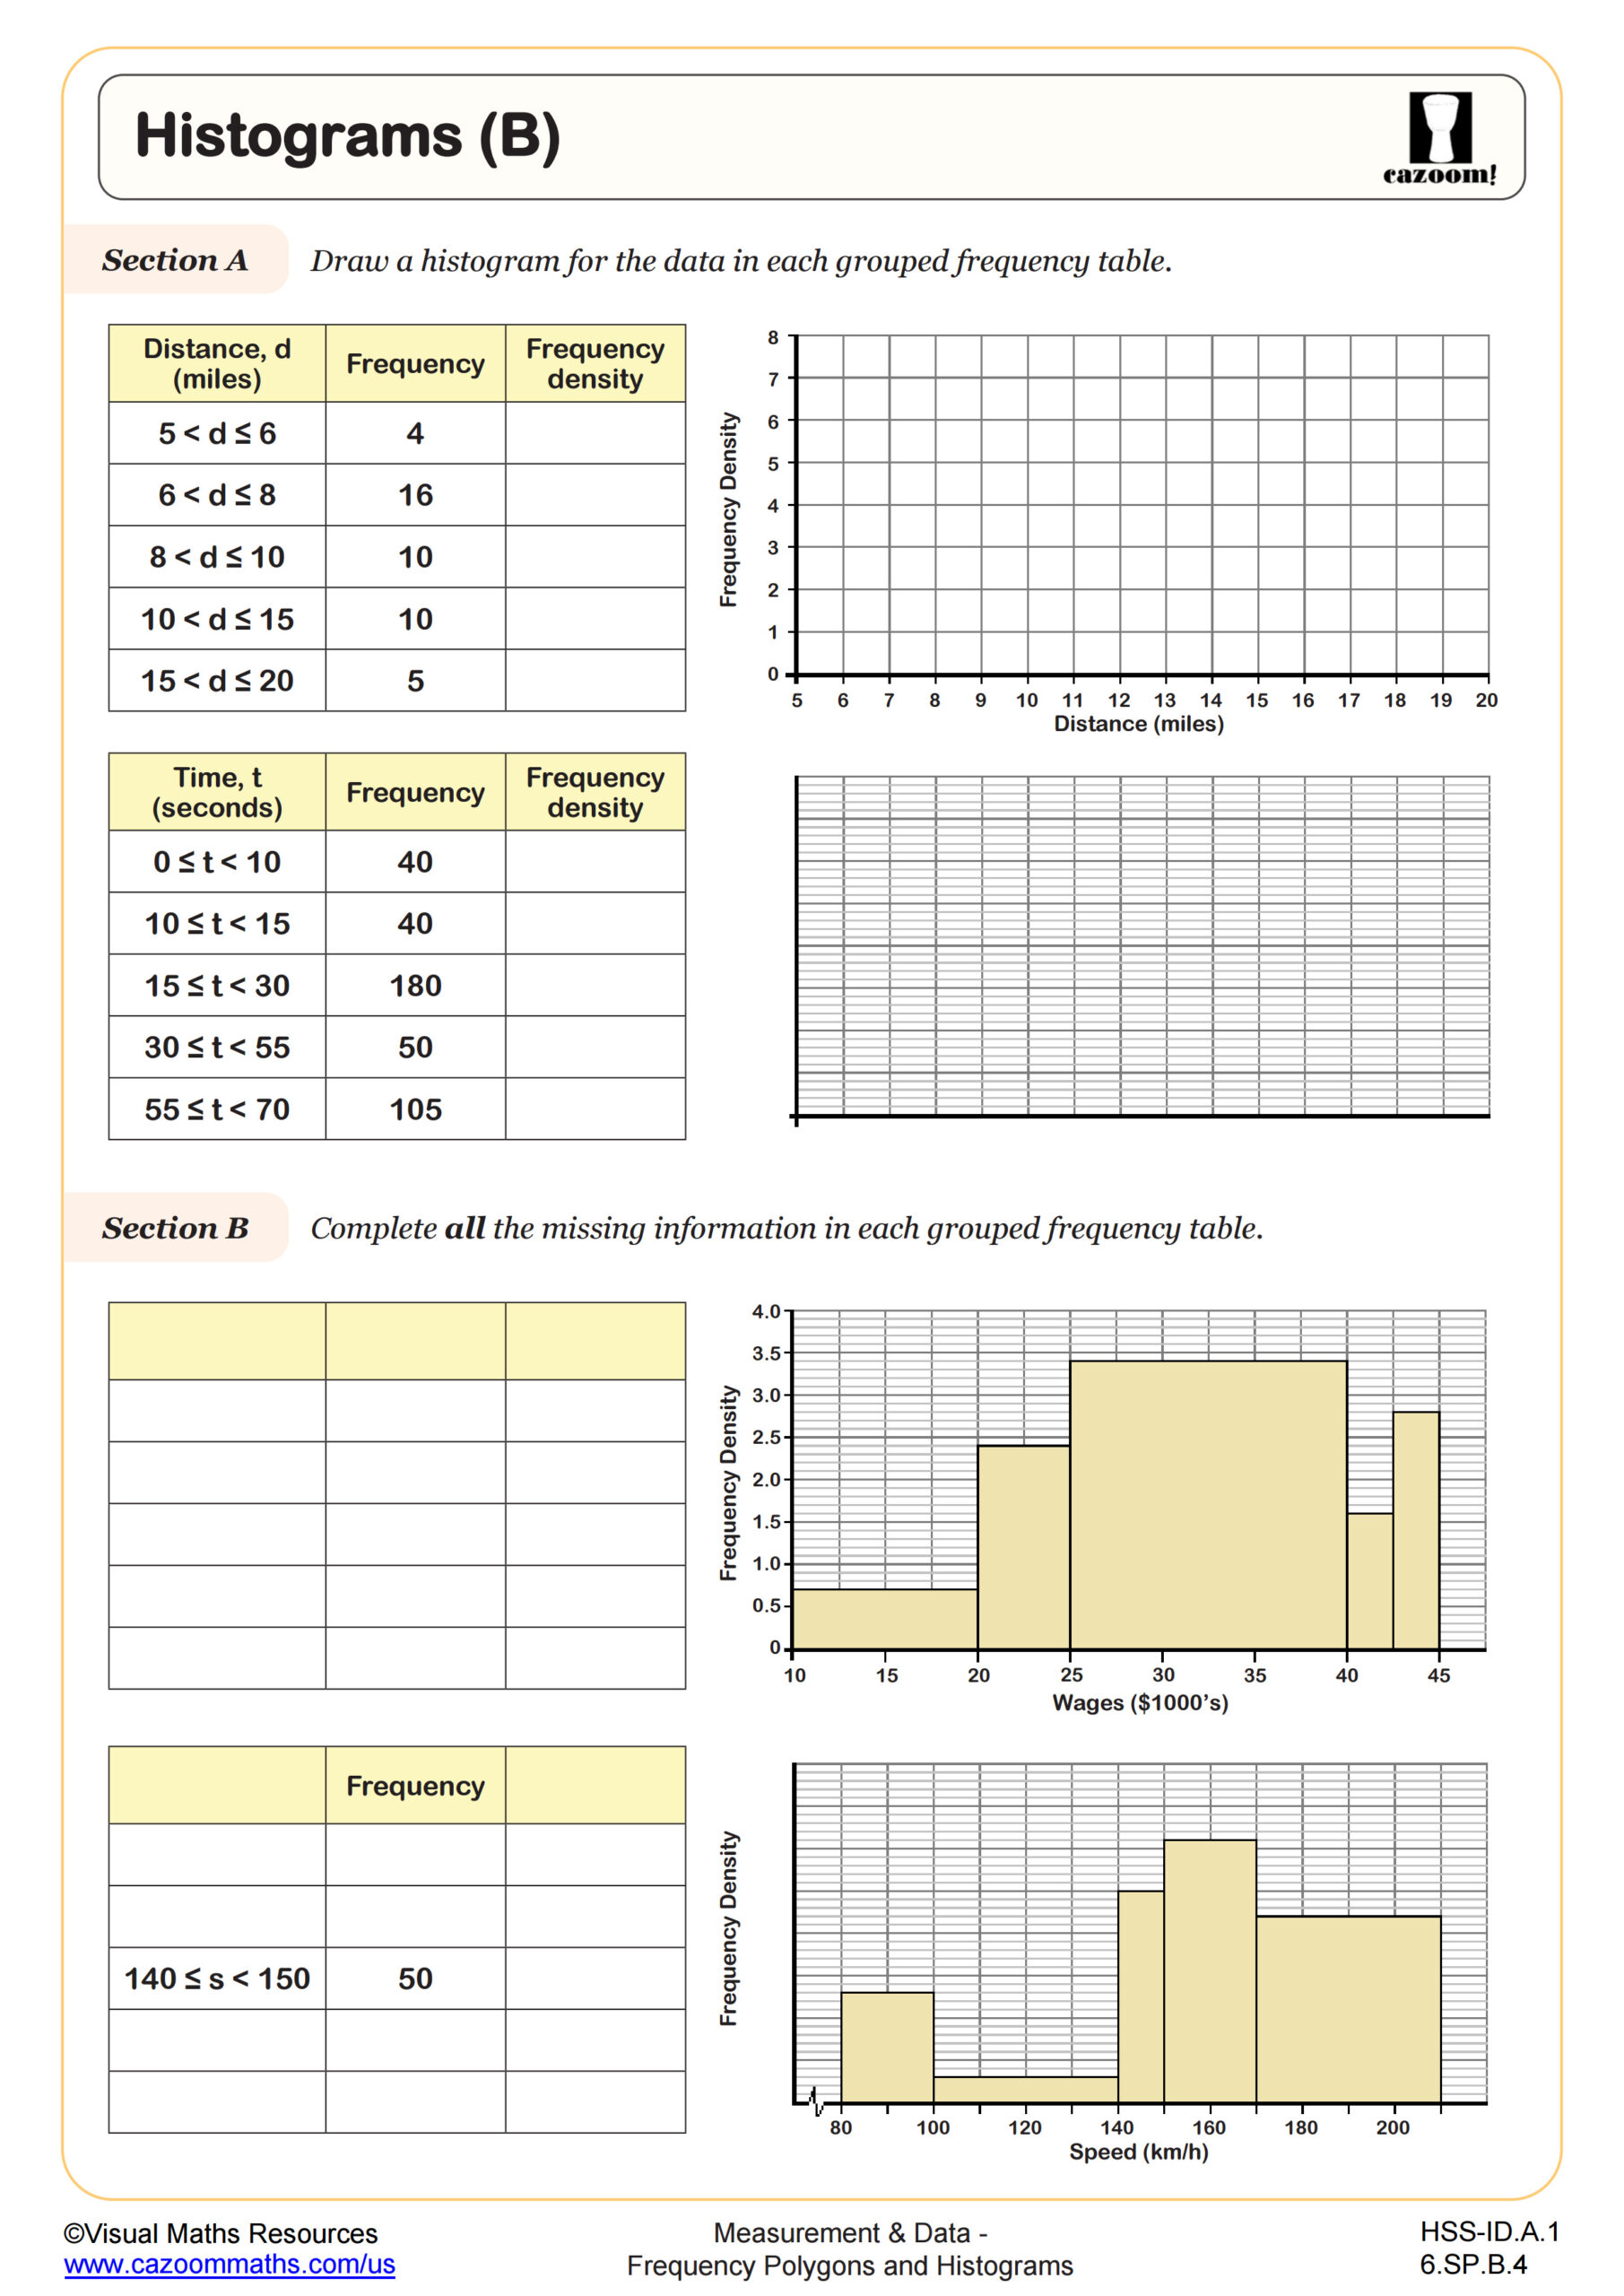
Histograms (B)
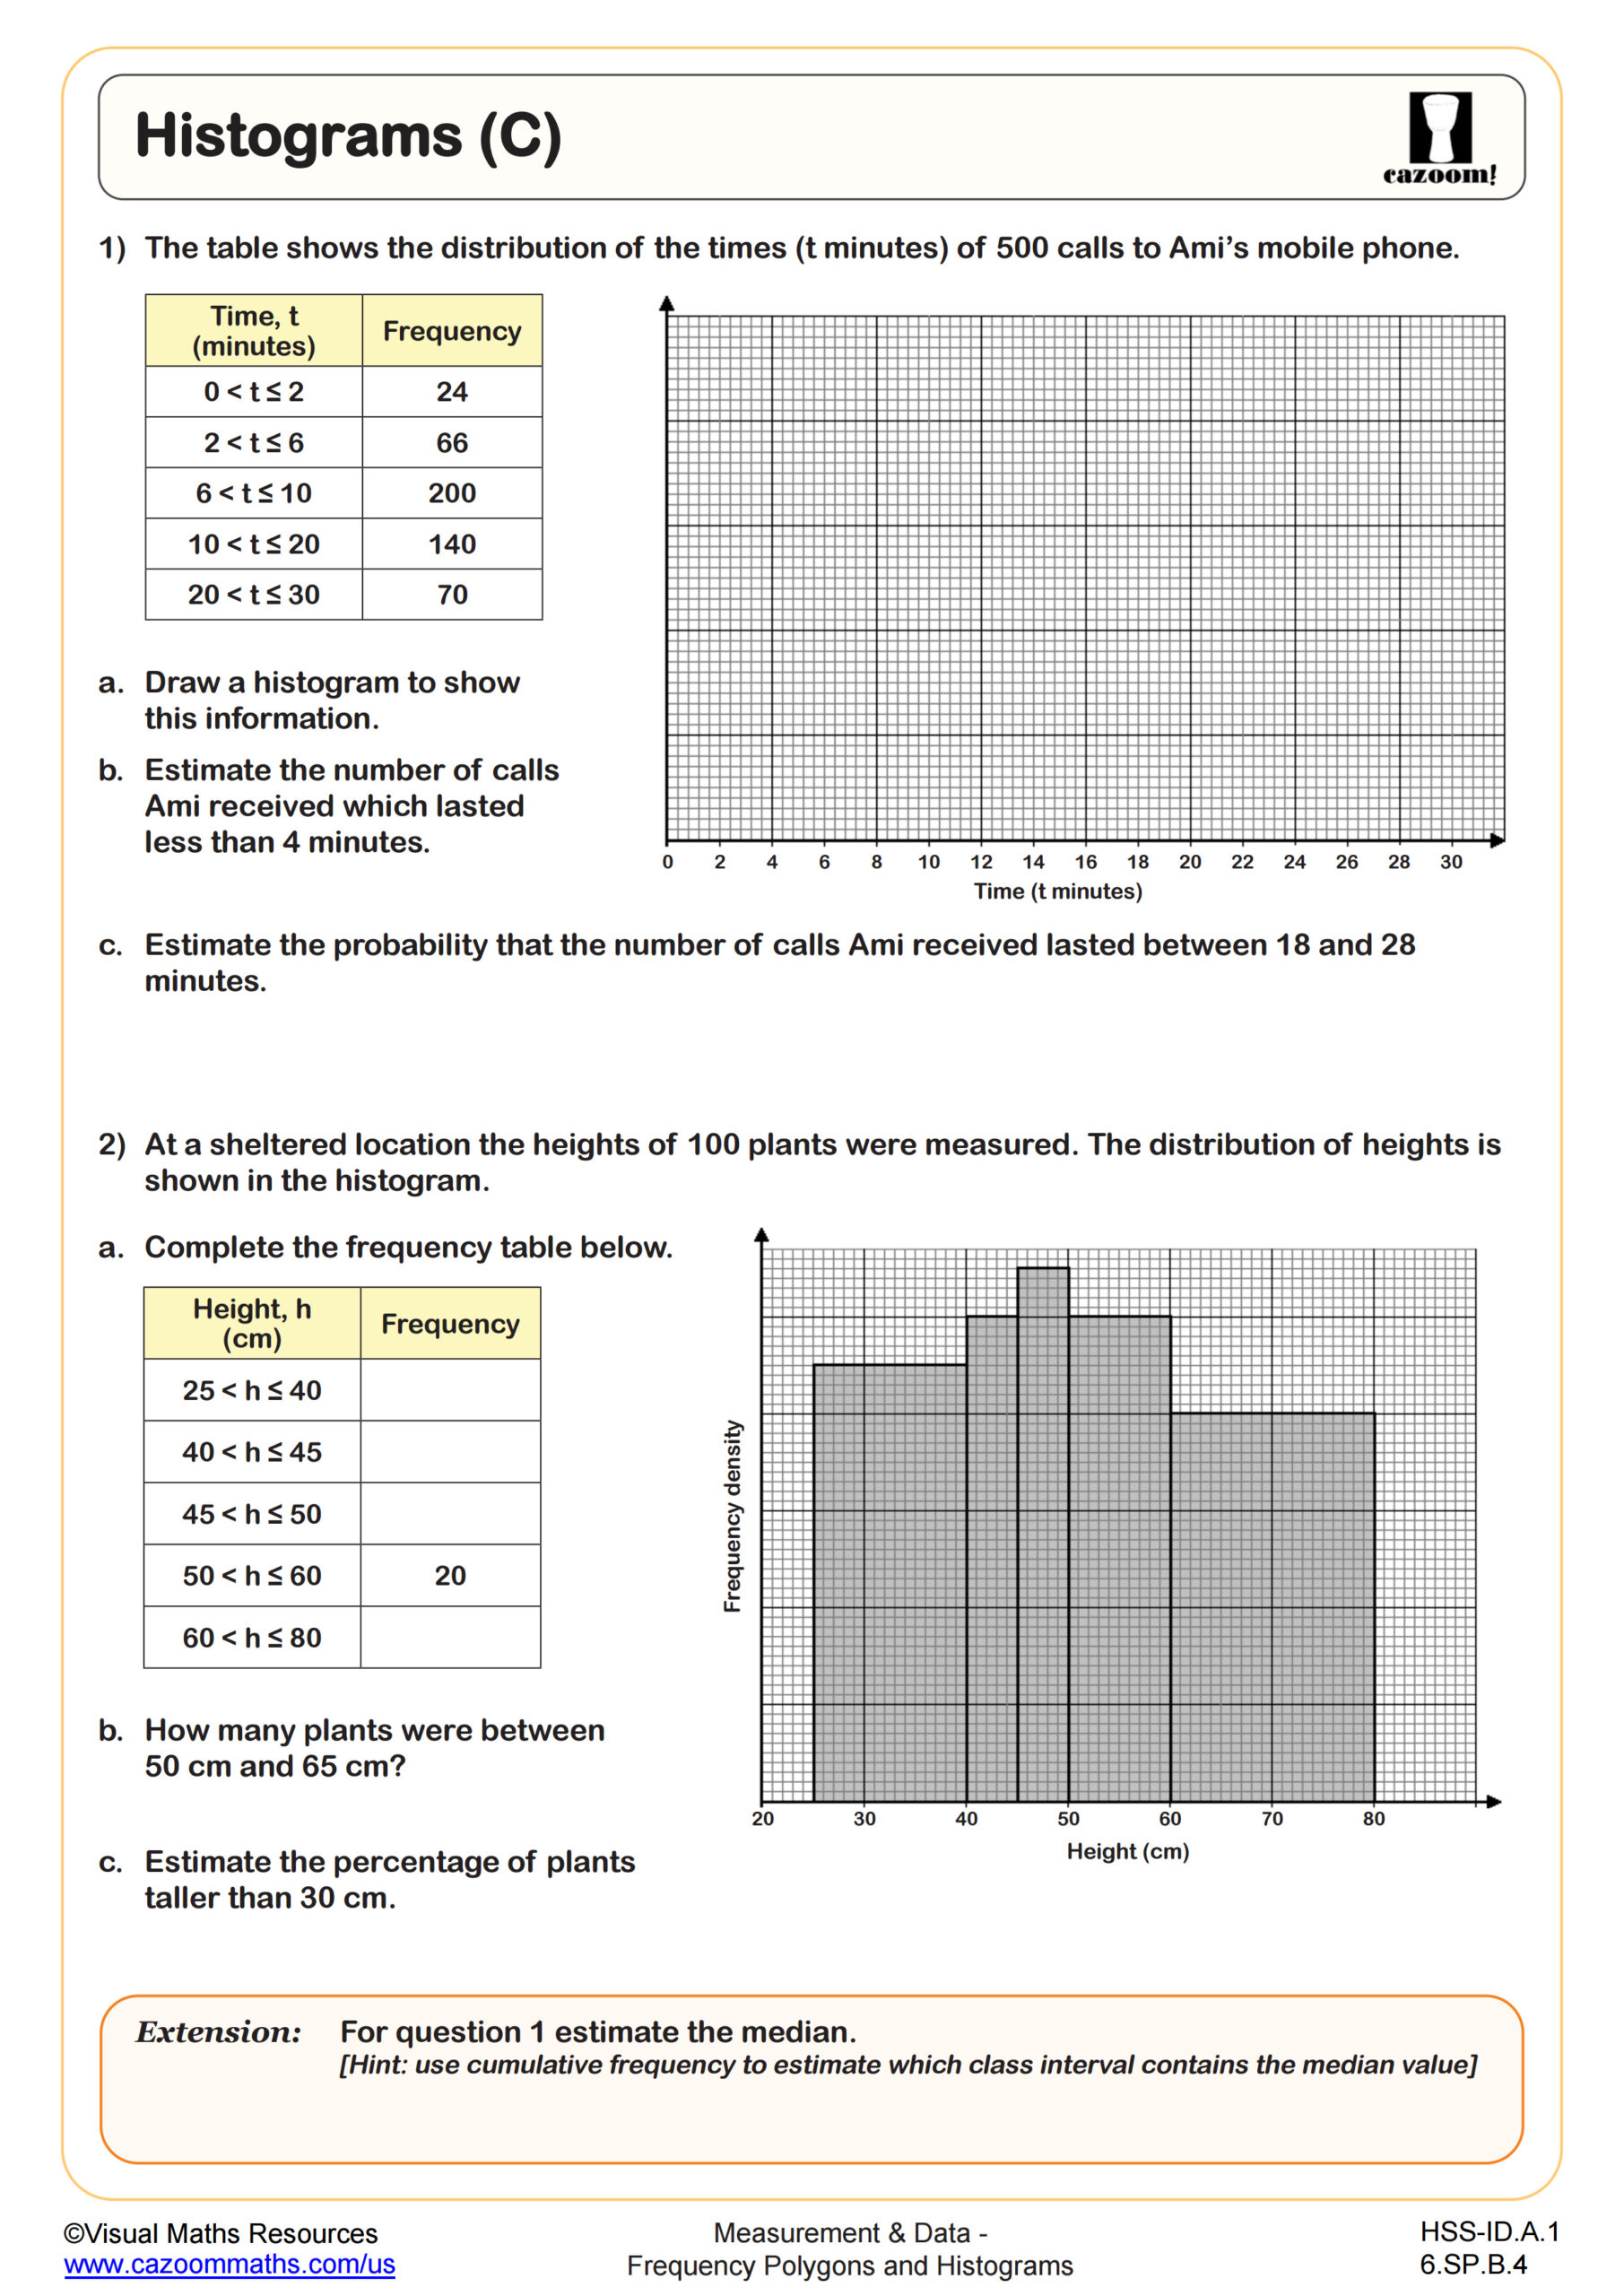
Histograms (C)
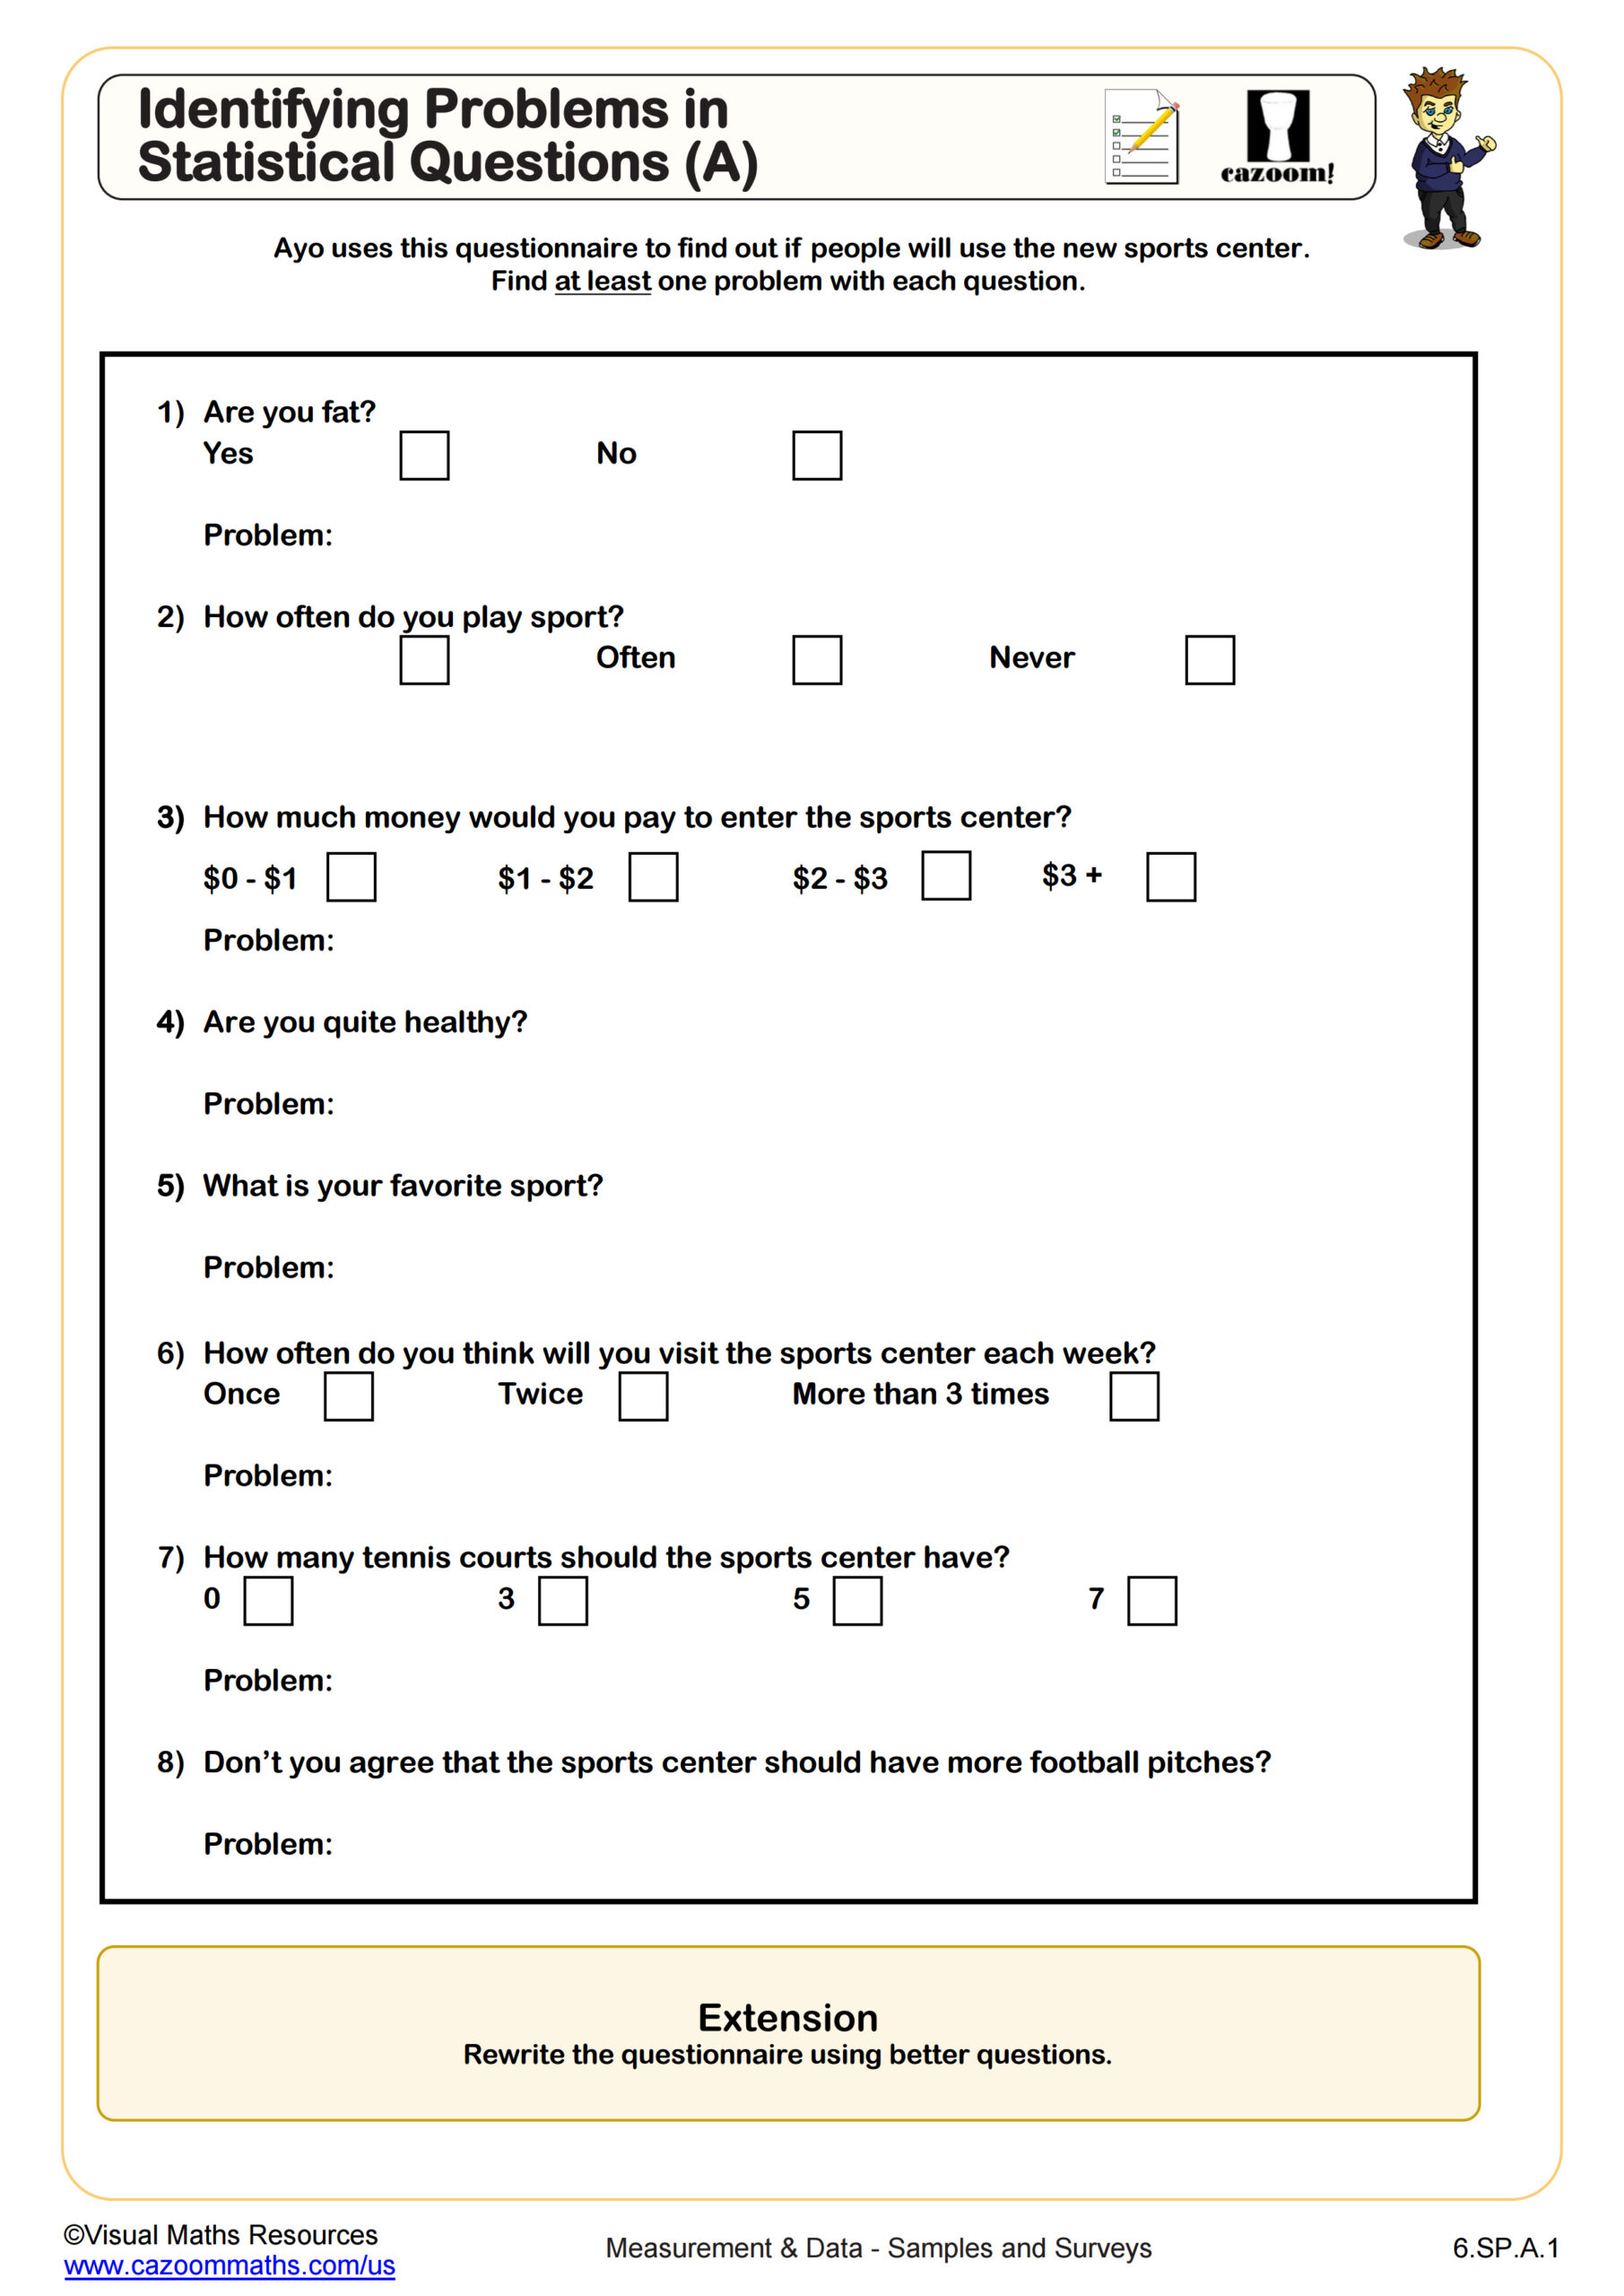
Identifying Problems in Statistical Questions (A)
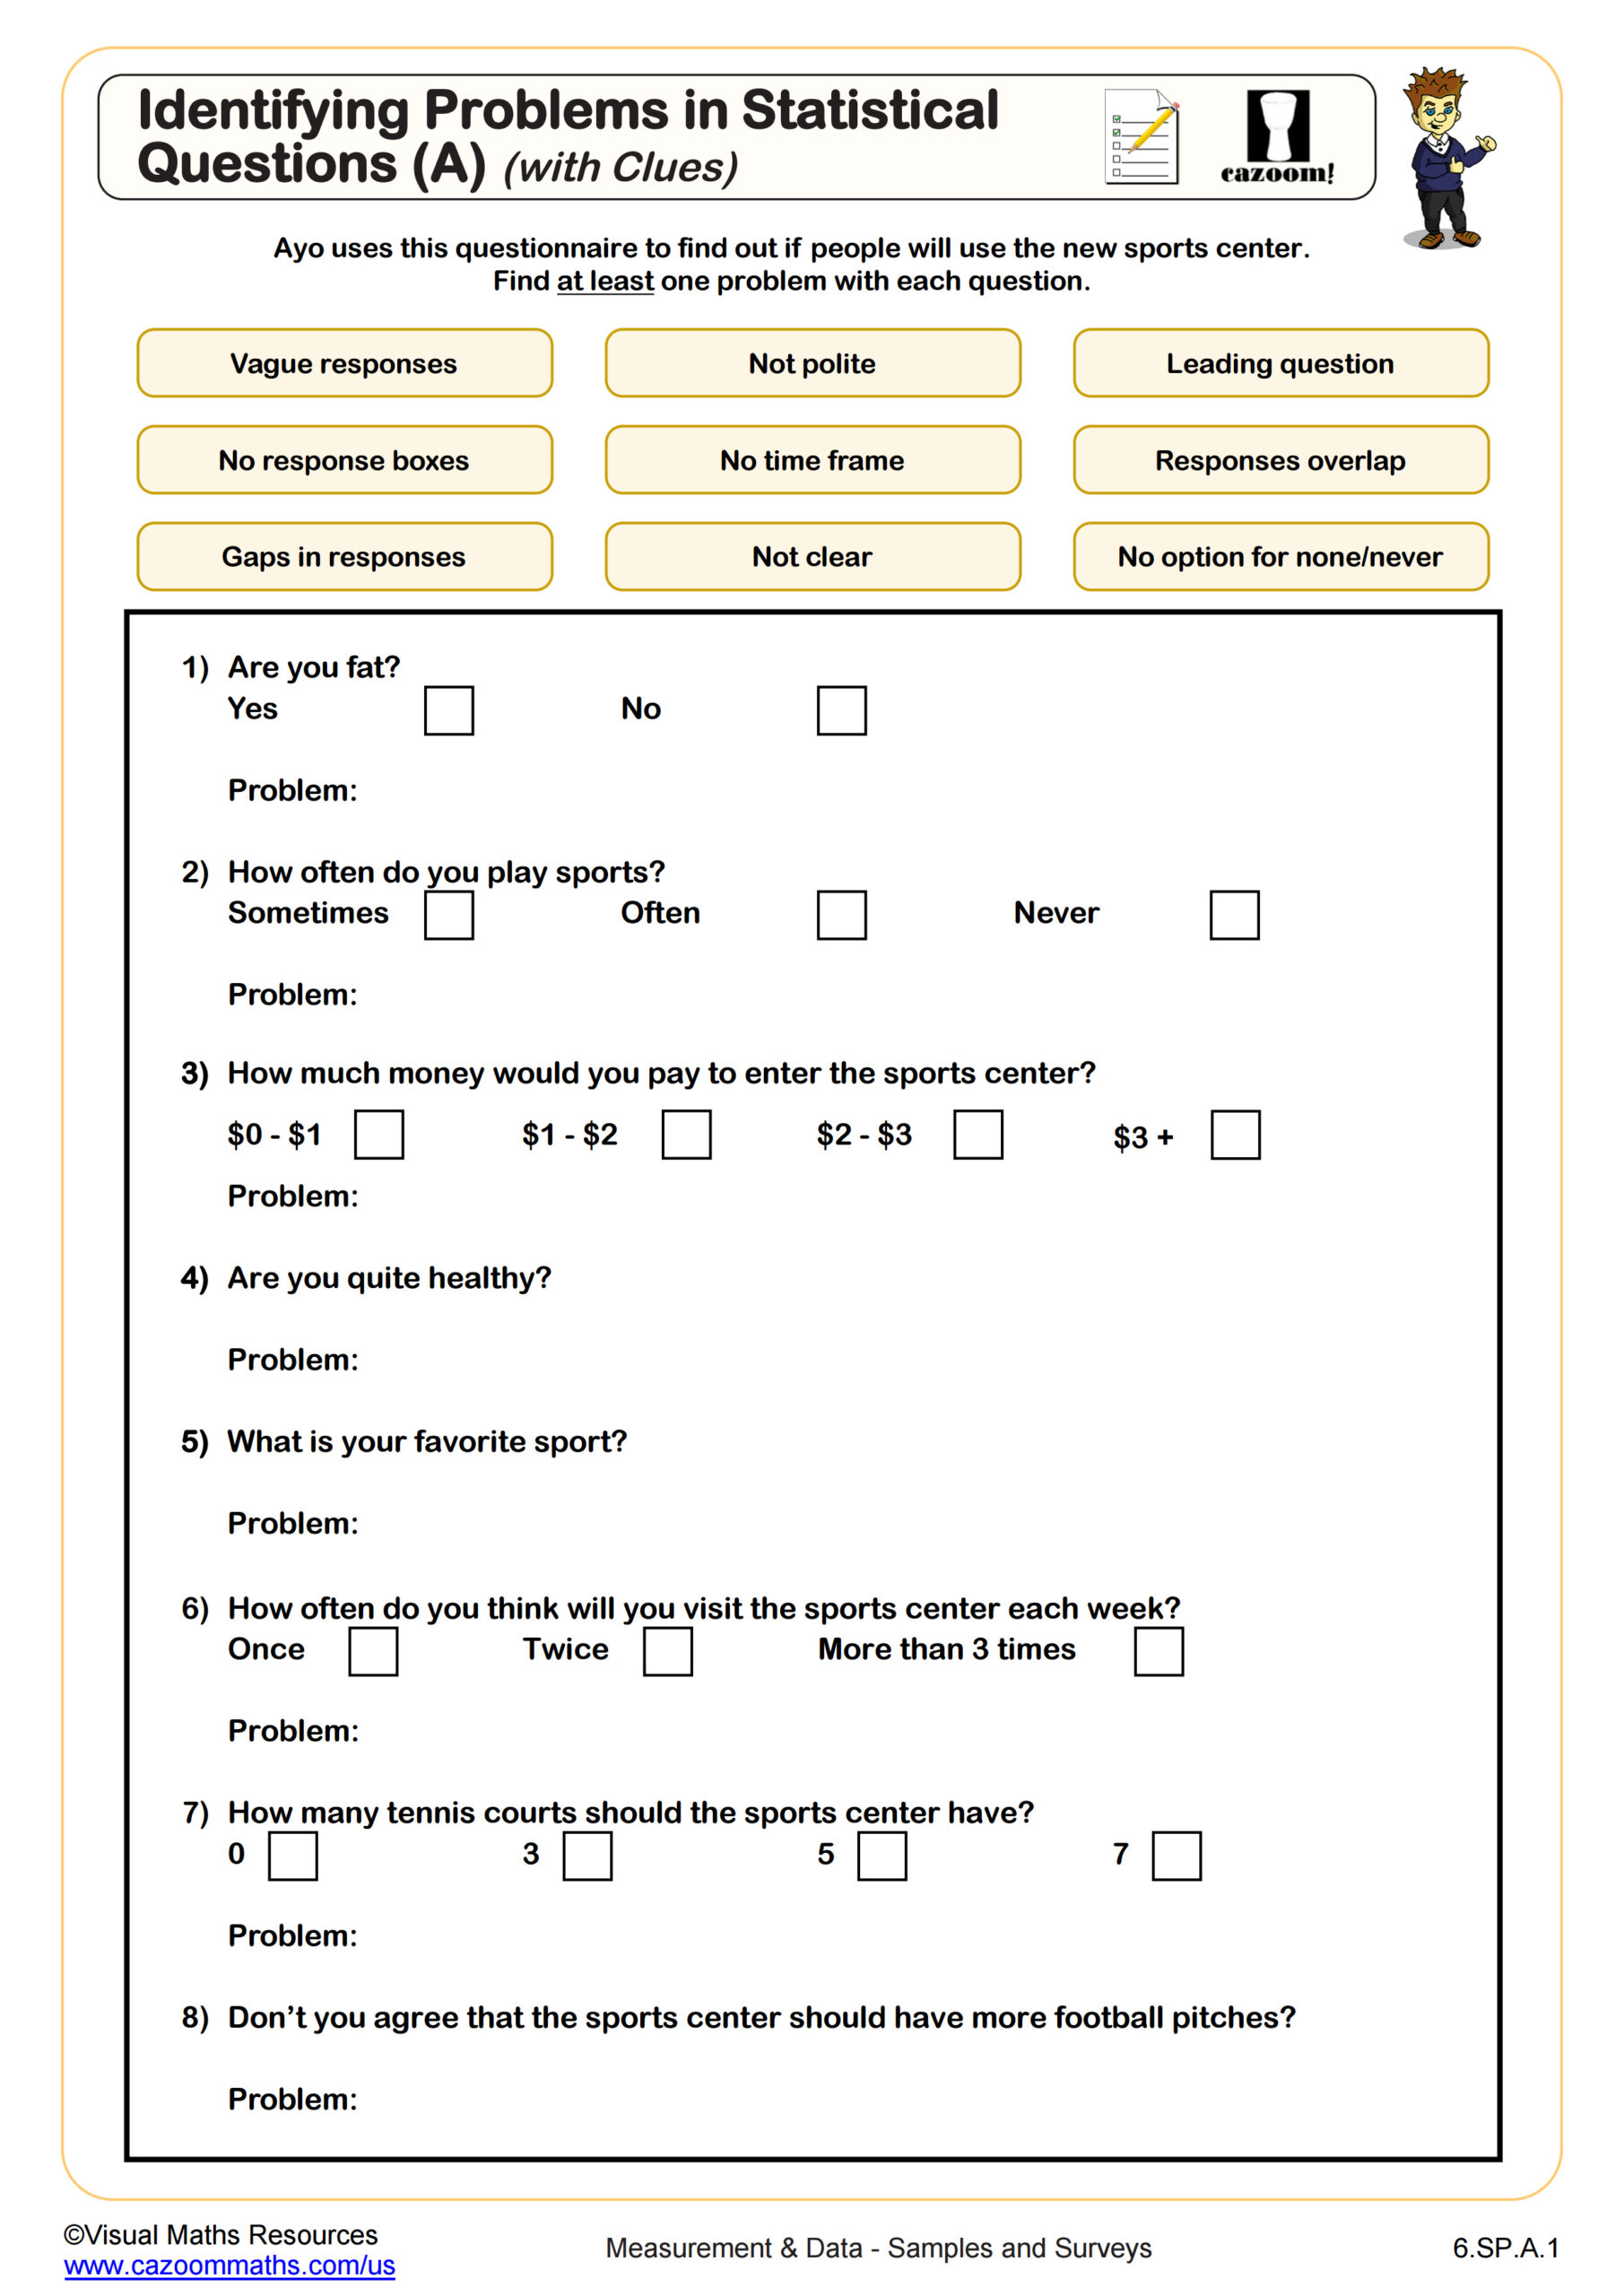
Identifying Problems in Statistical Questions (A) (With Clues)
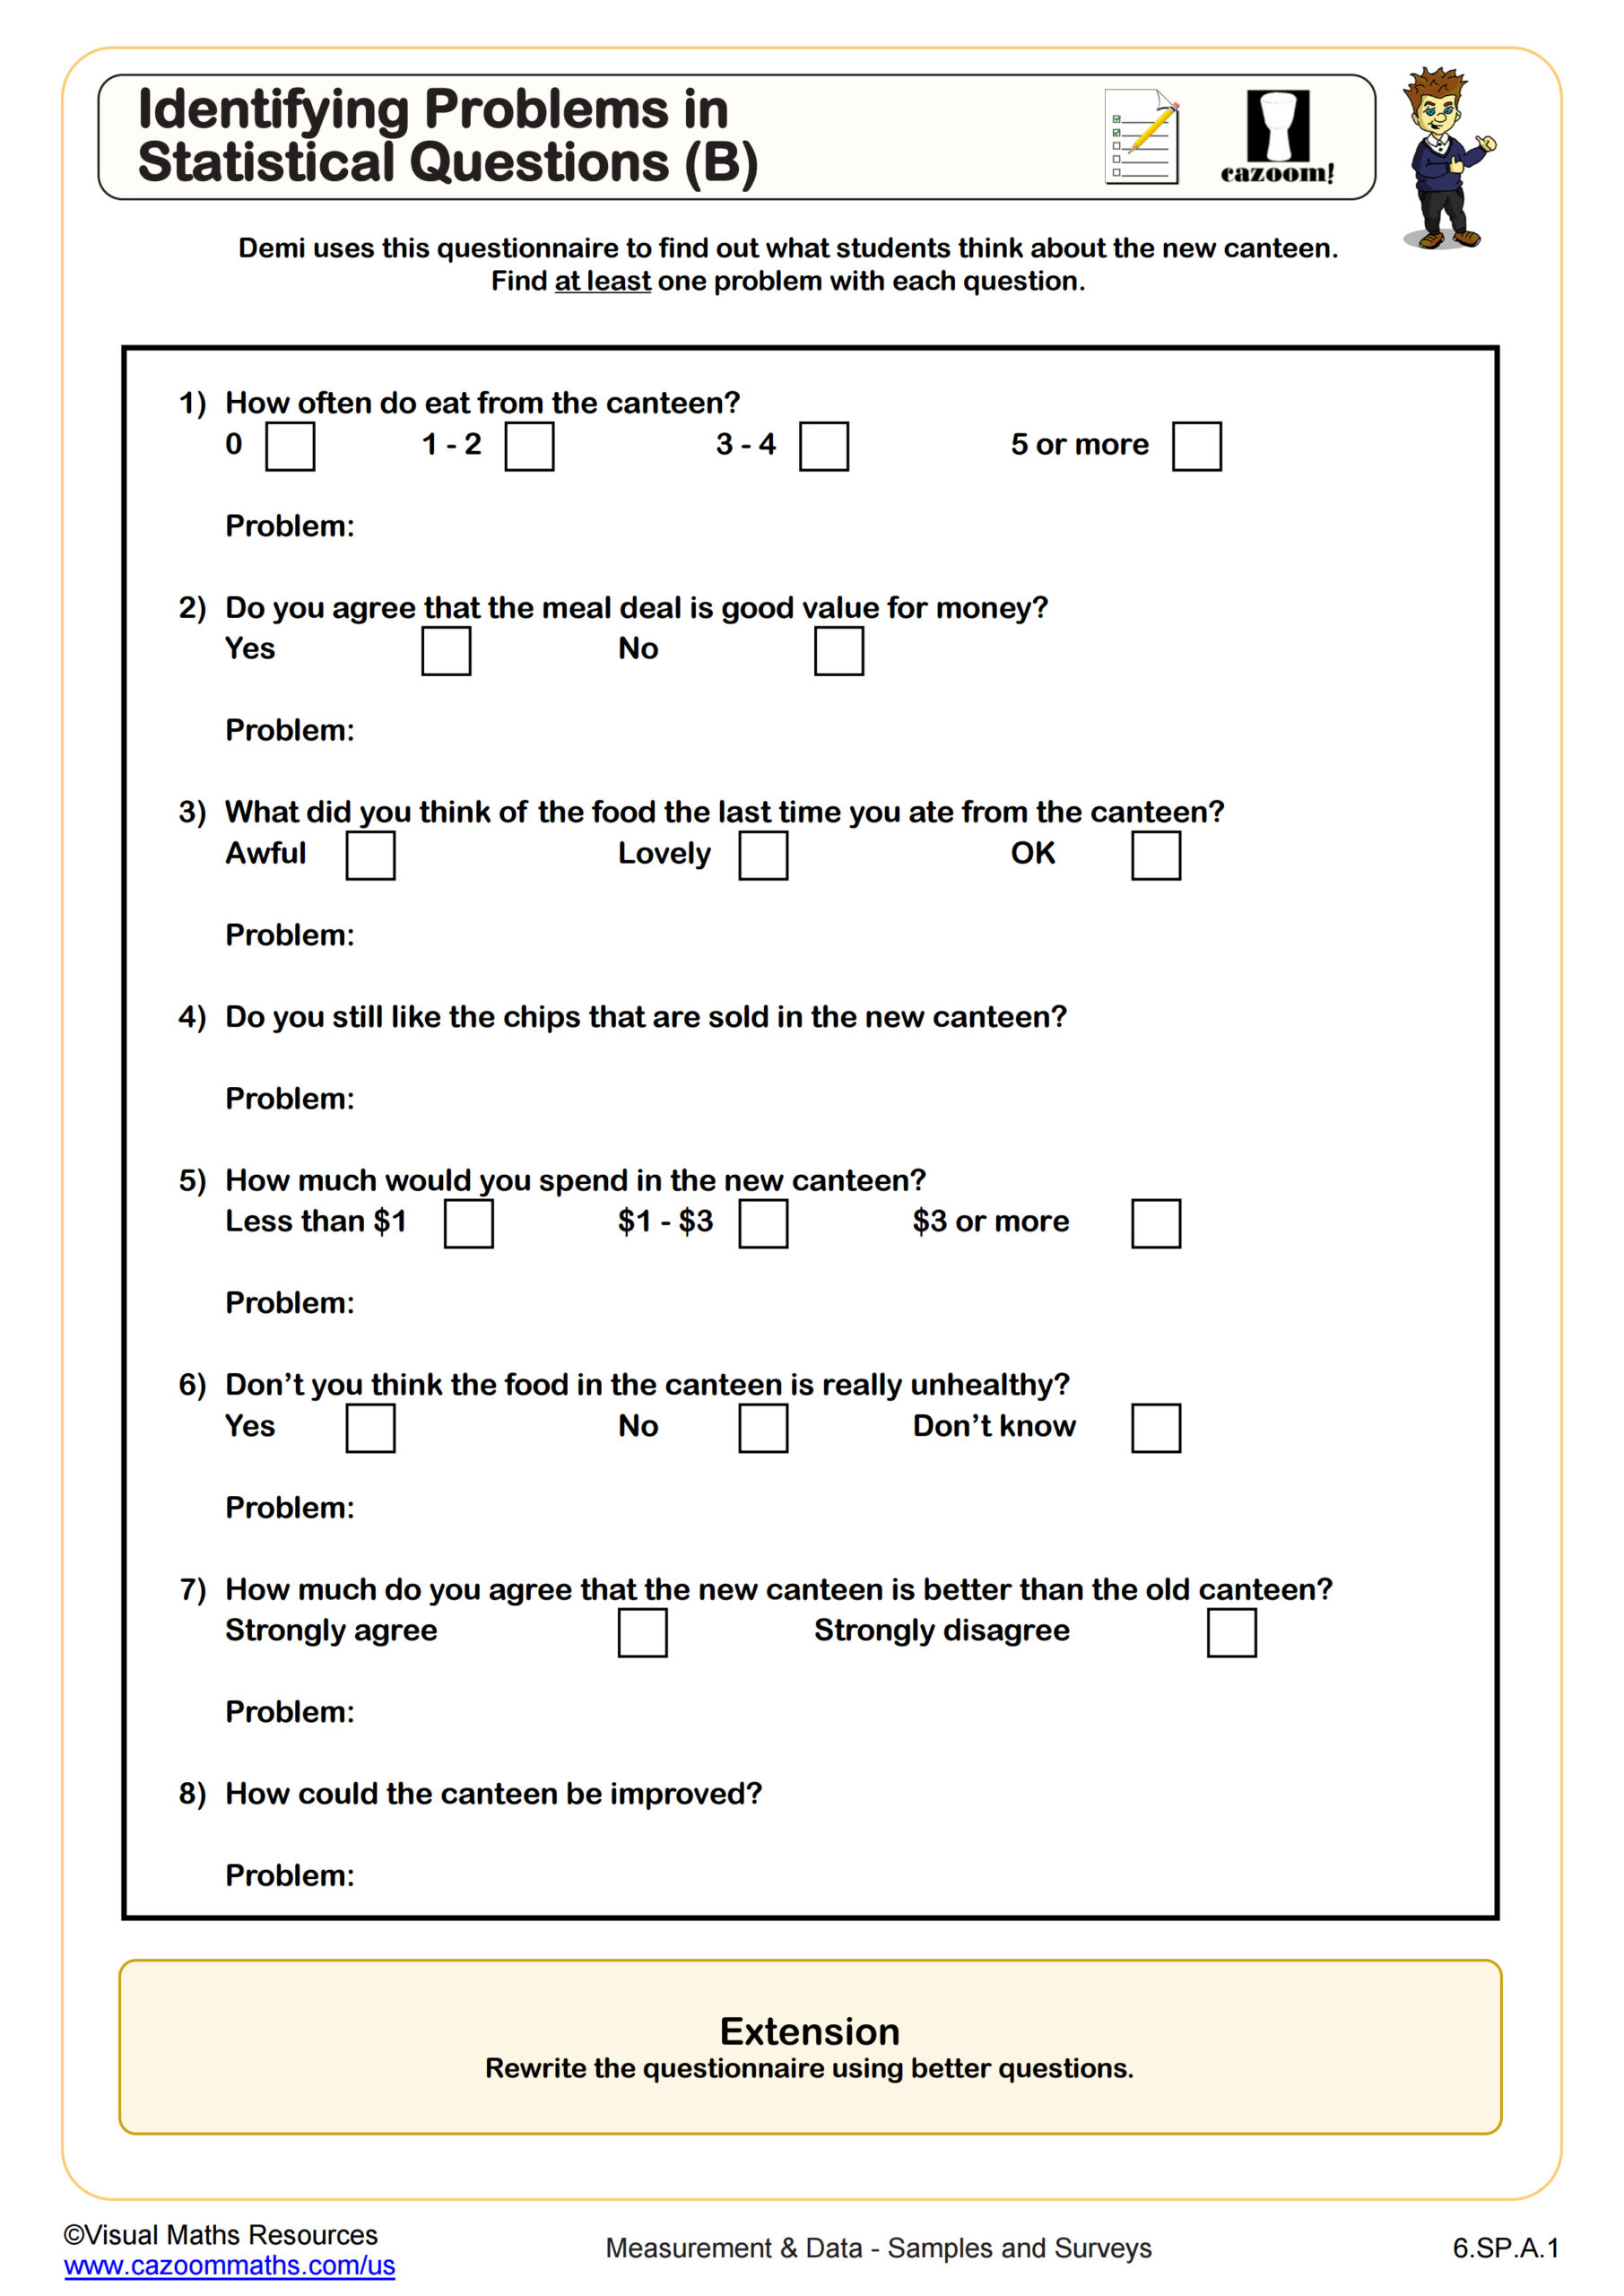
Identifying Problems in Statistical Questions (B)
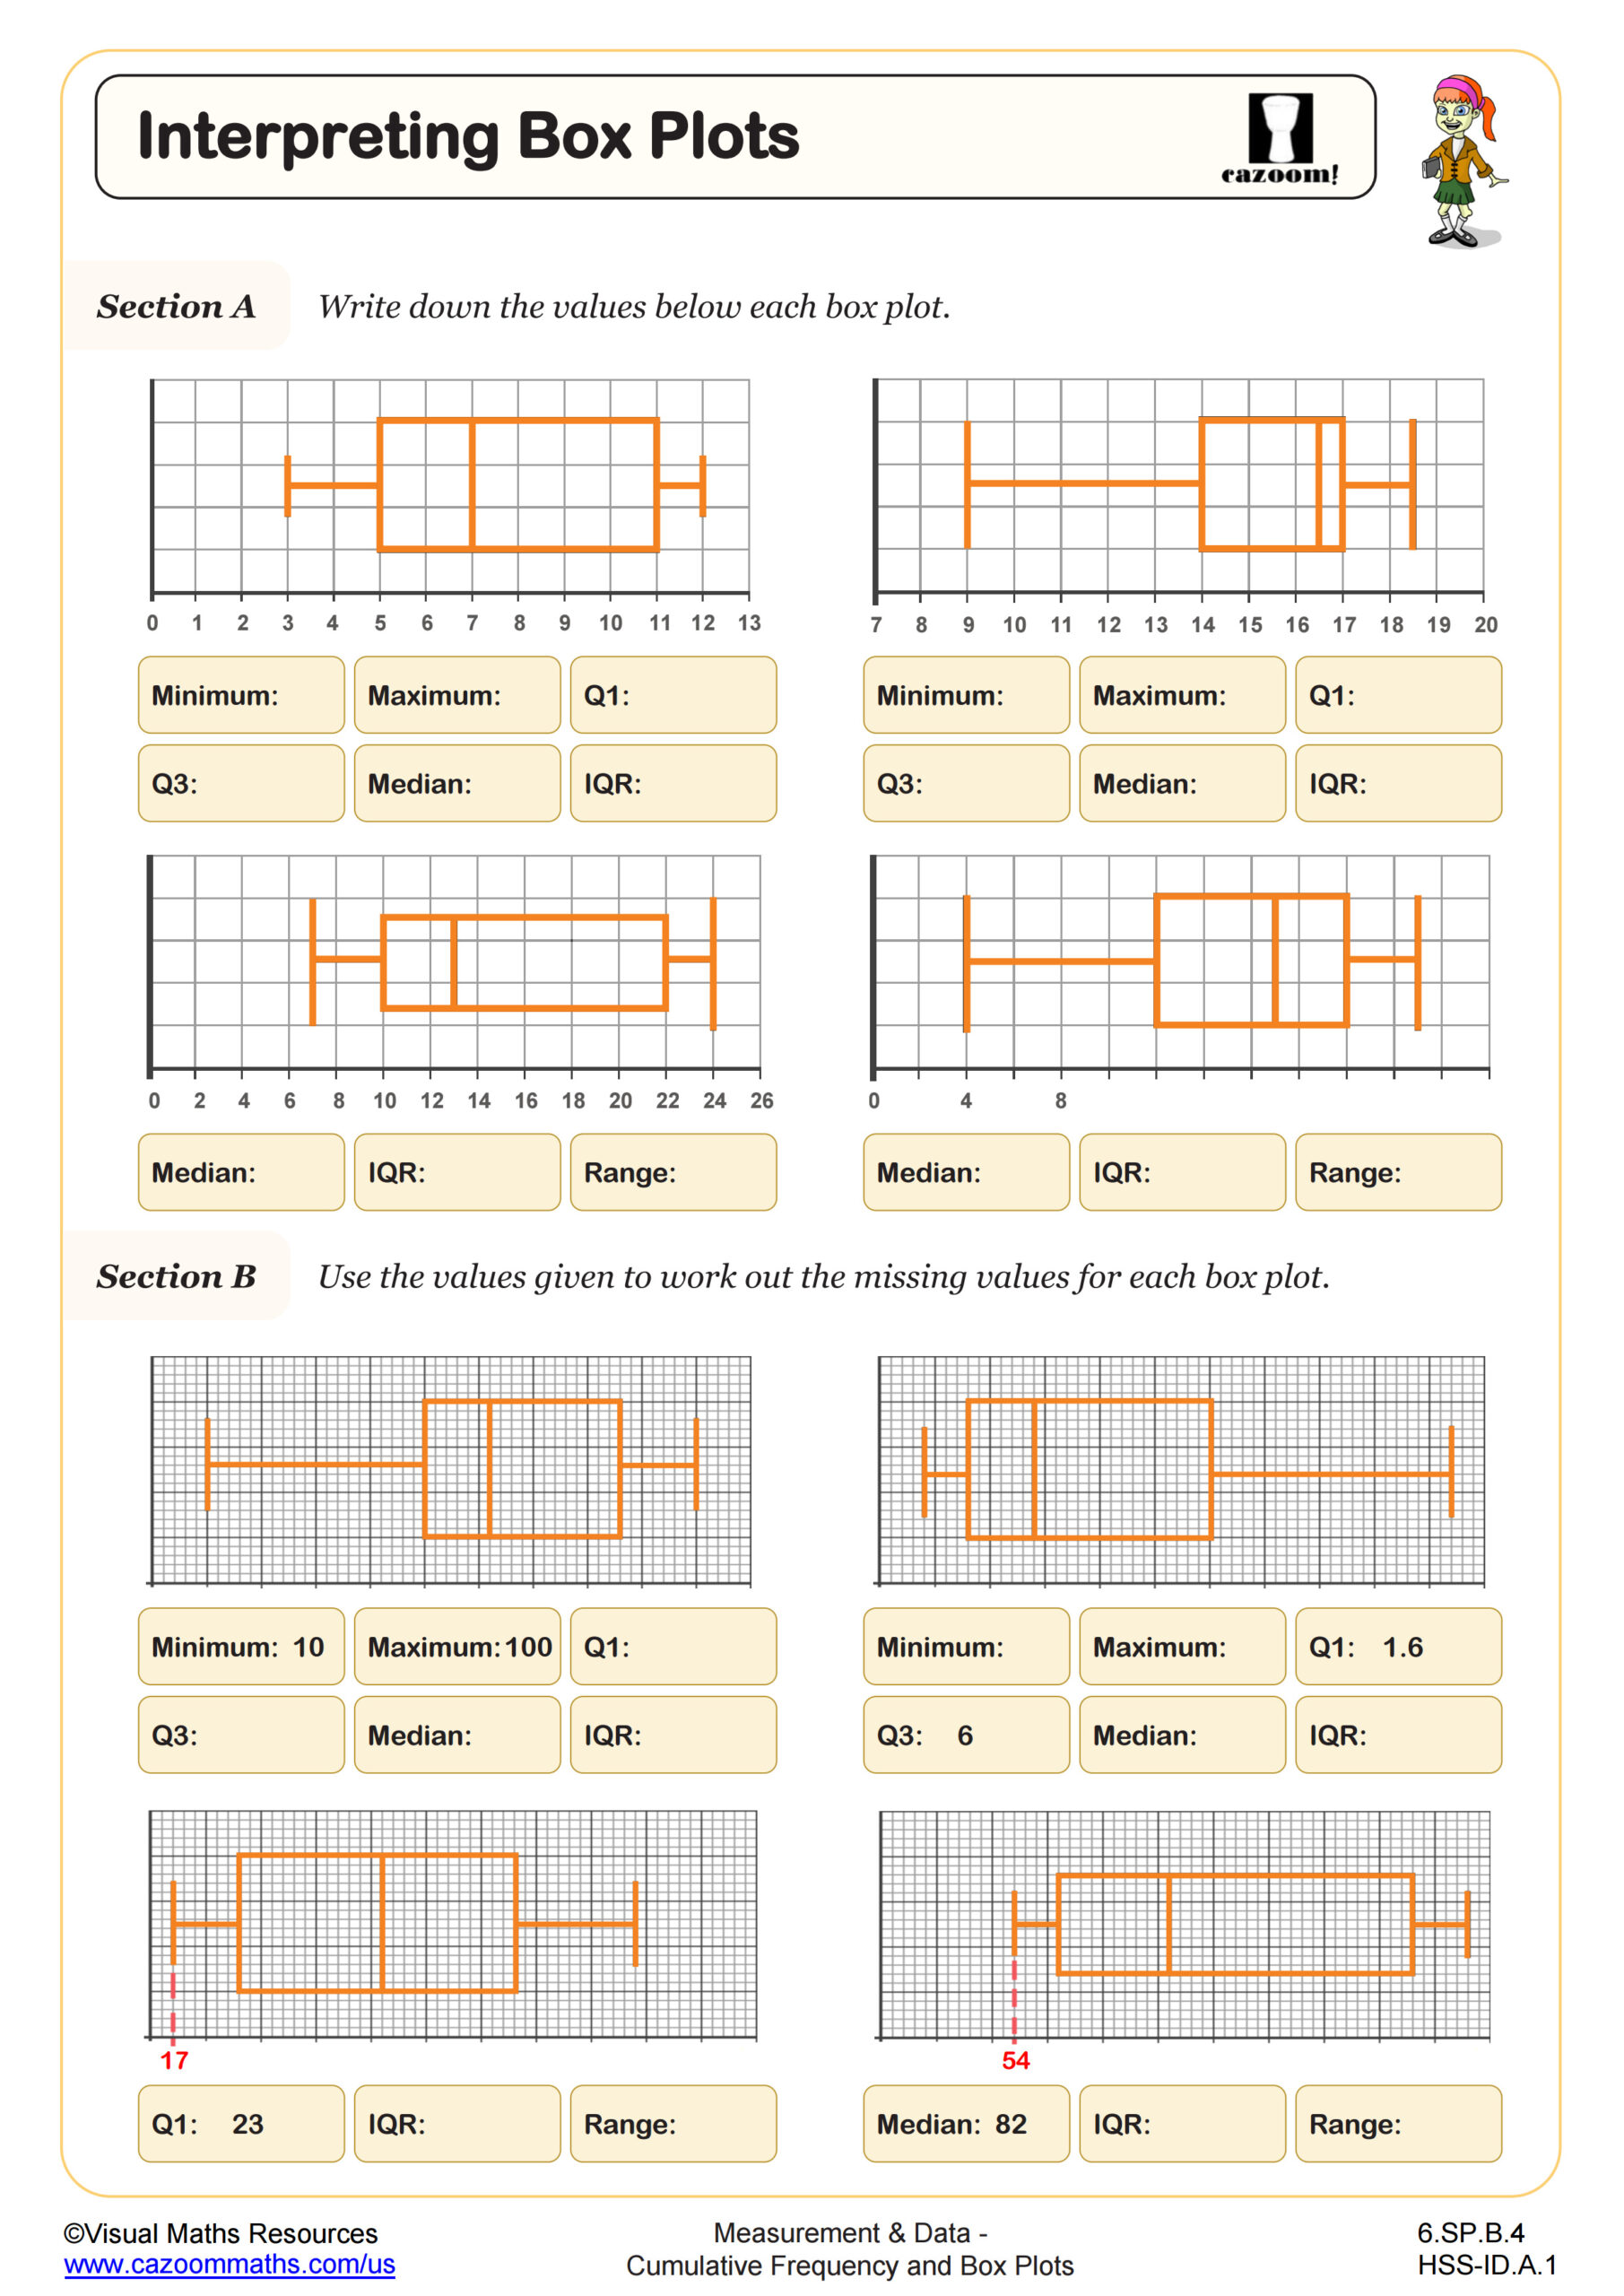
Interpreting Boxplots
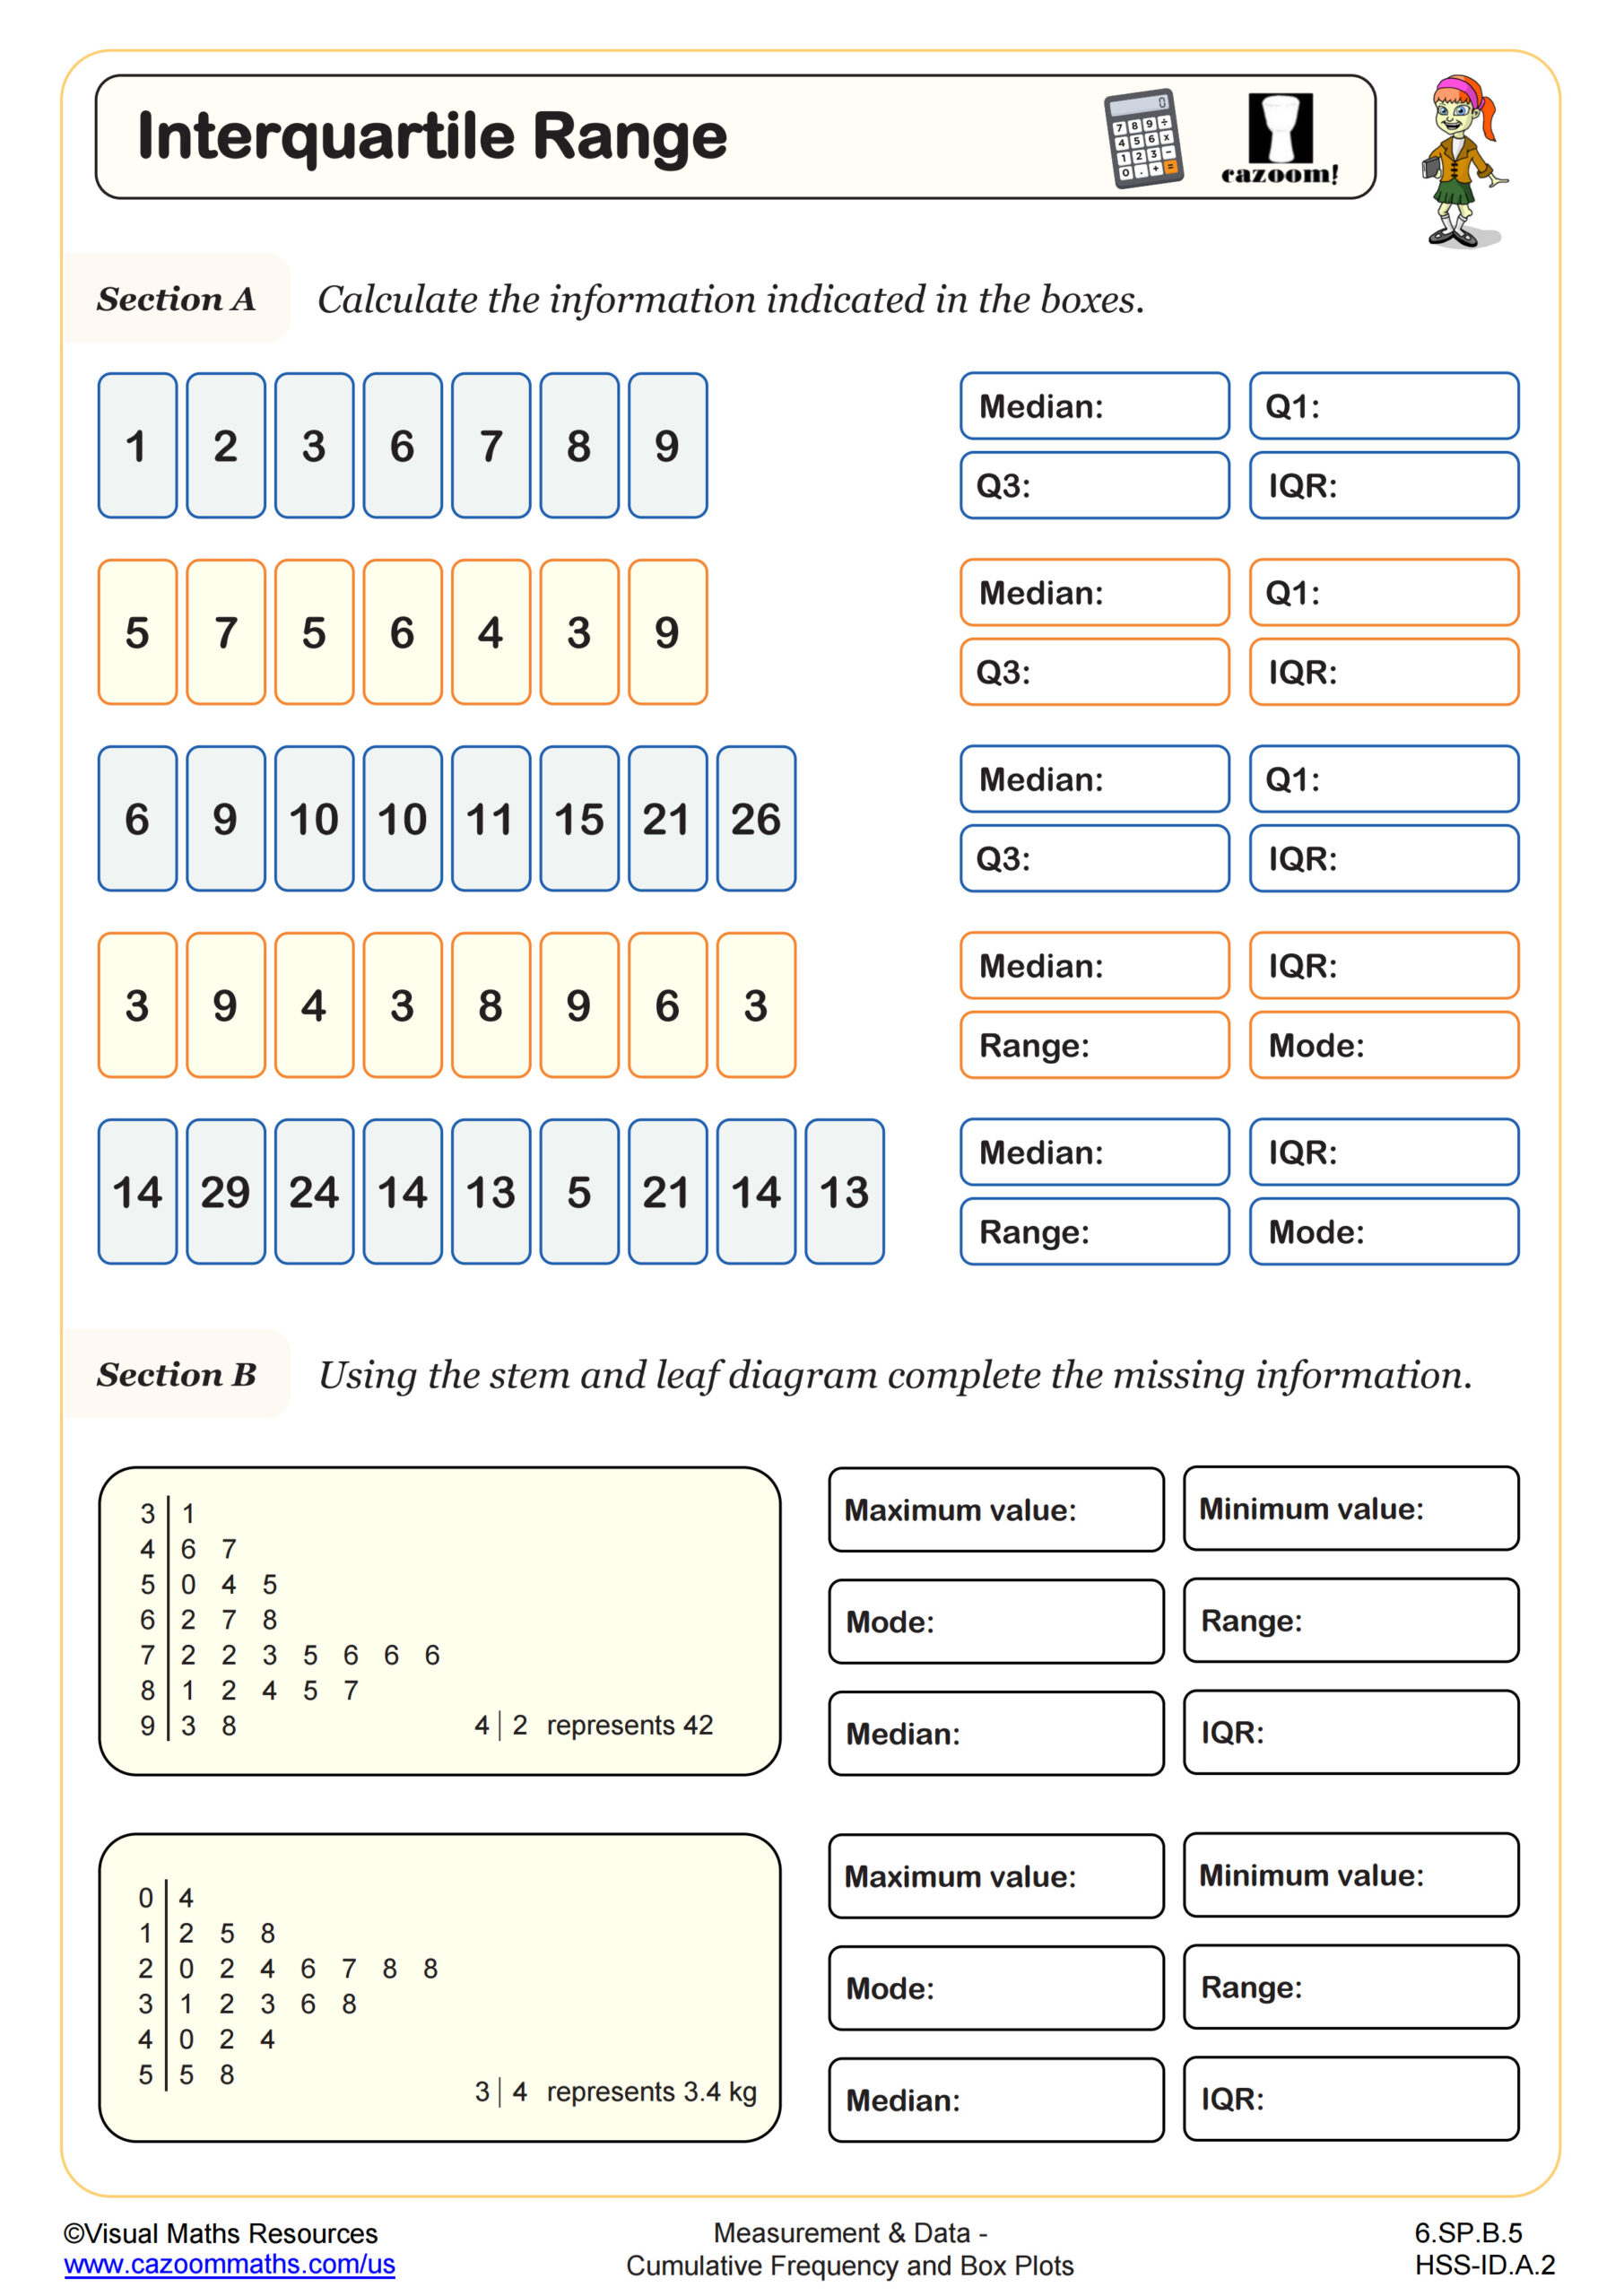
Interquartile Range
Measure Mass - in Grams
Nets and Faces - Using Cubes (A)
Nets and Faces - Using Cubes (B)
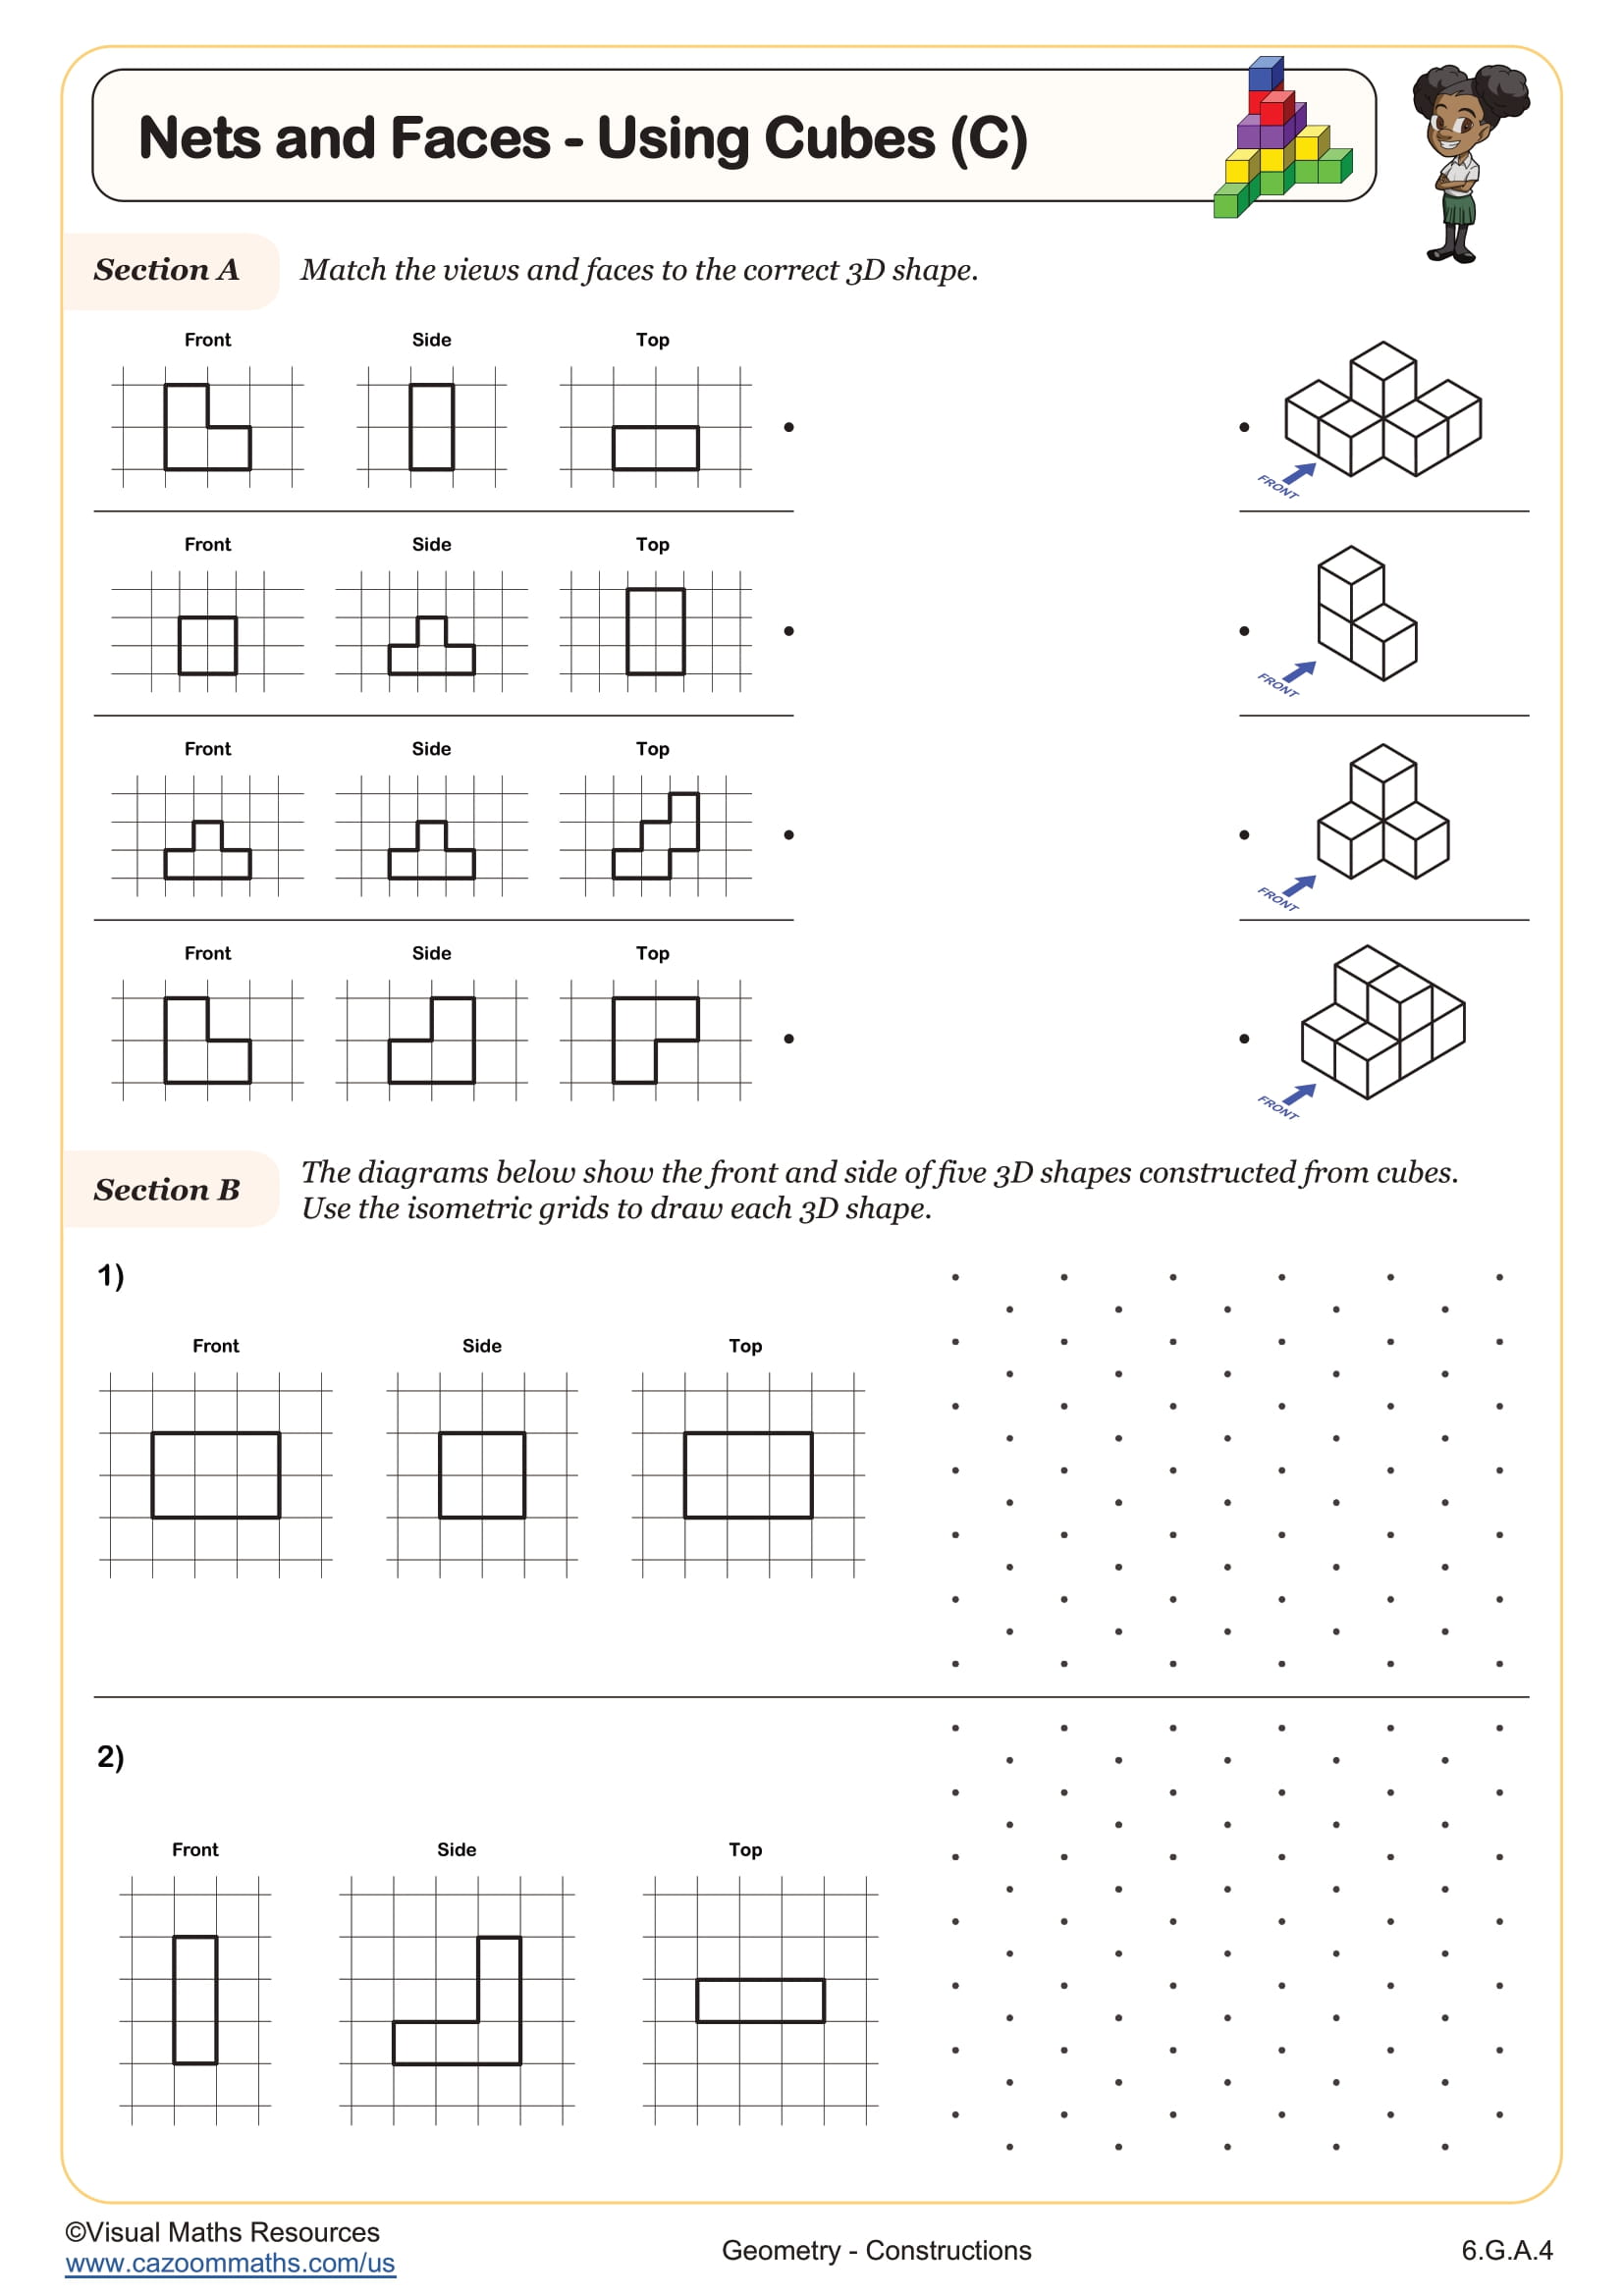
Nets and Faces - Using Cubes (C)
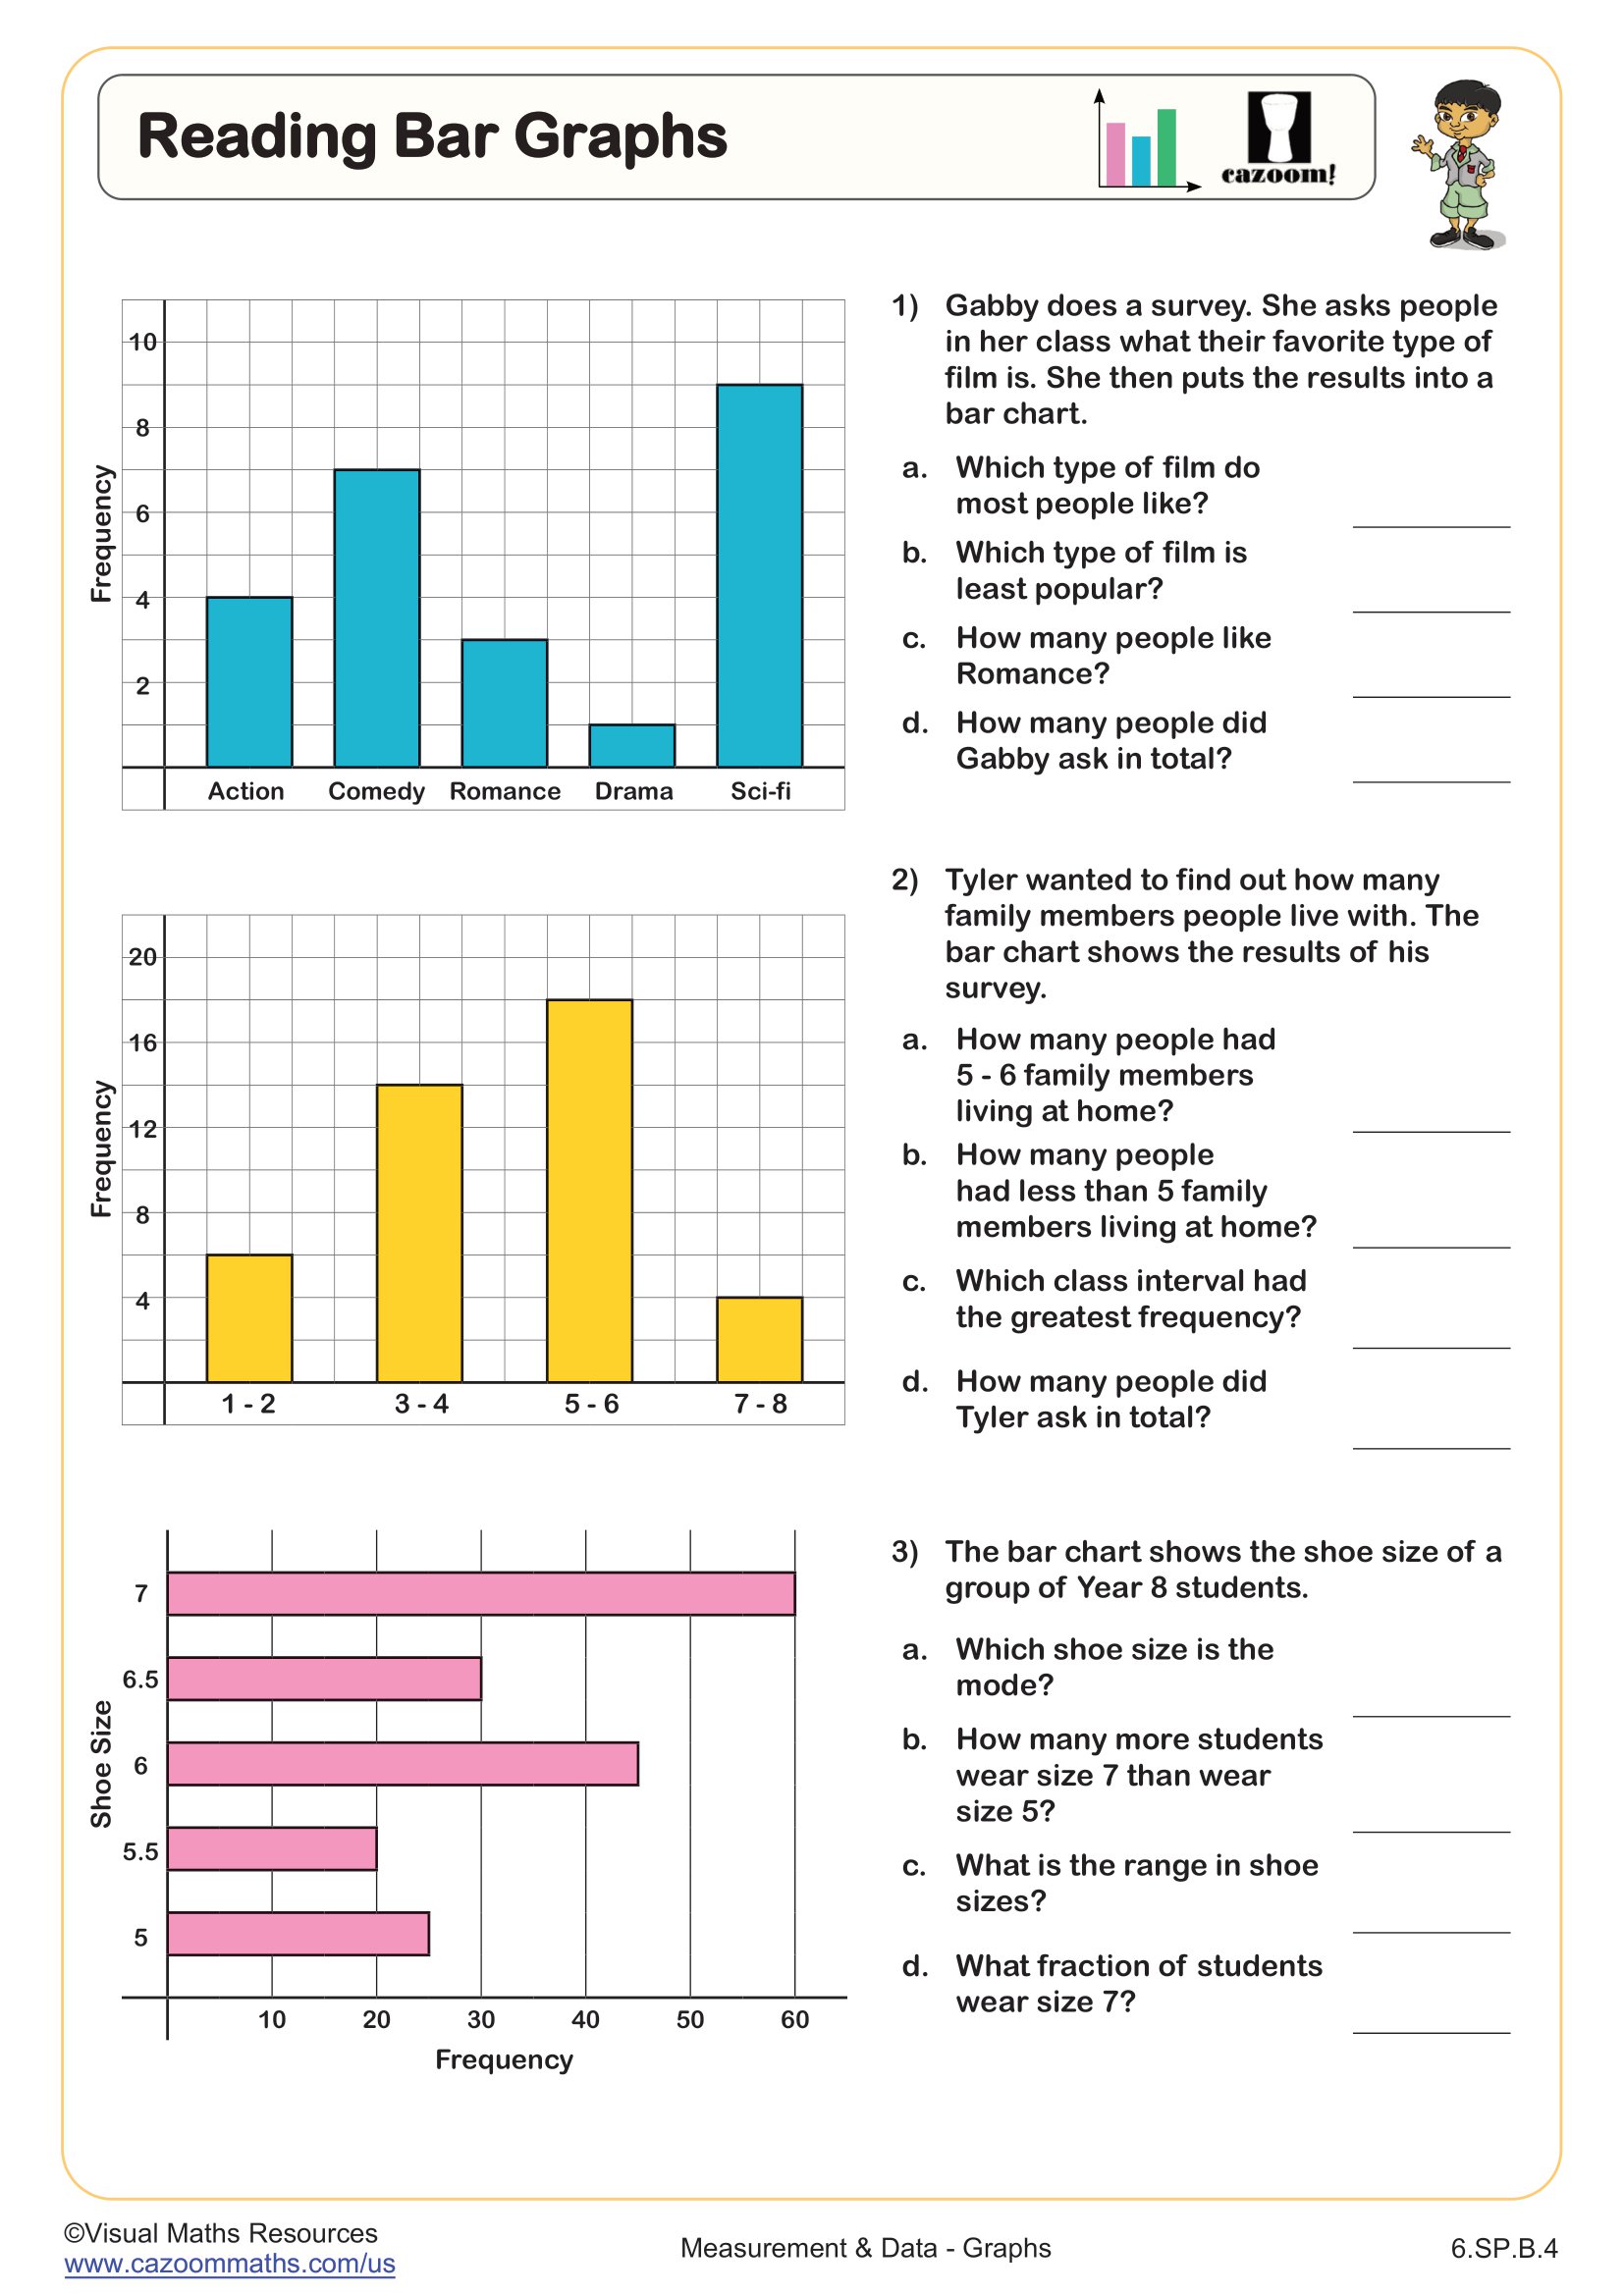
Reading Bar Graphs
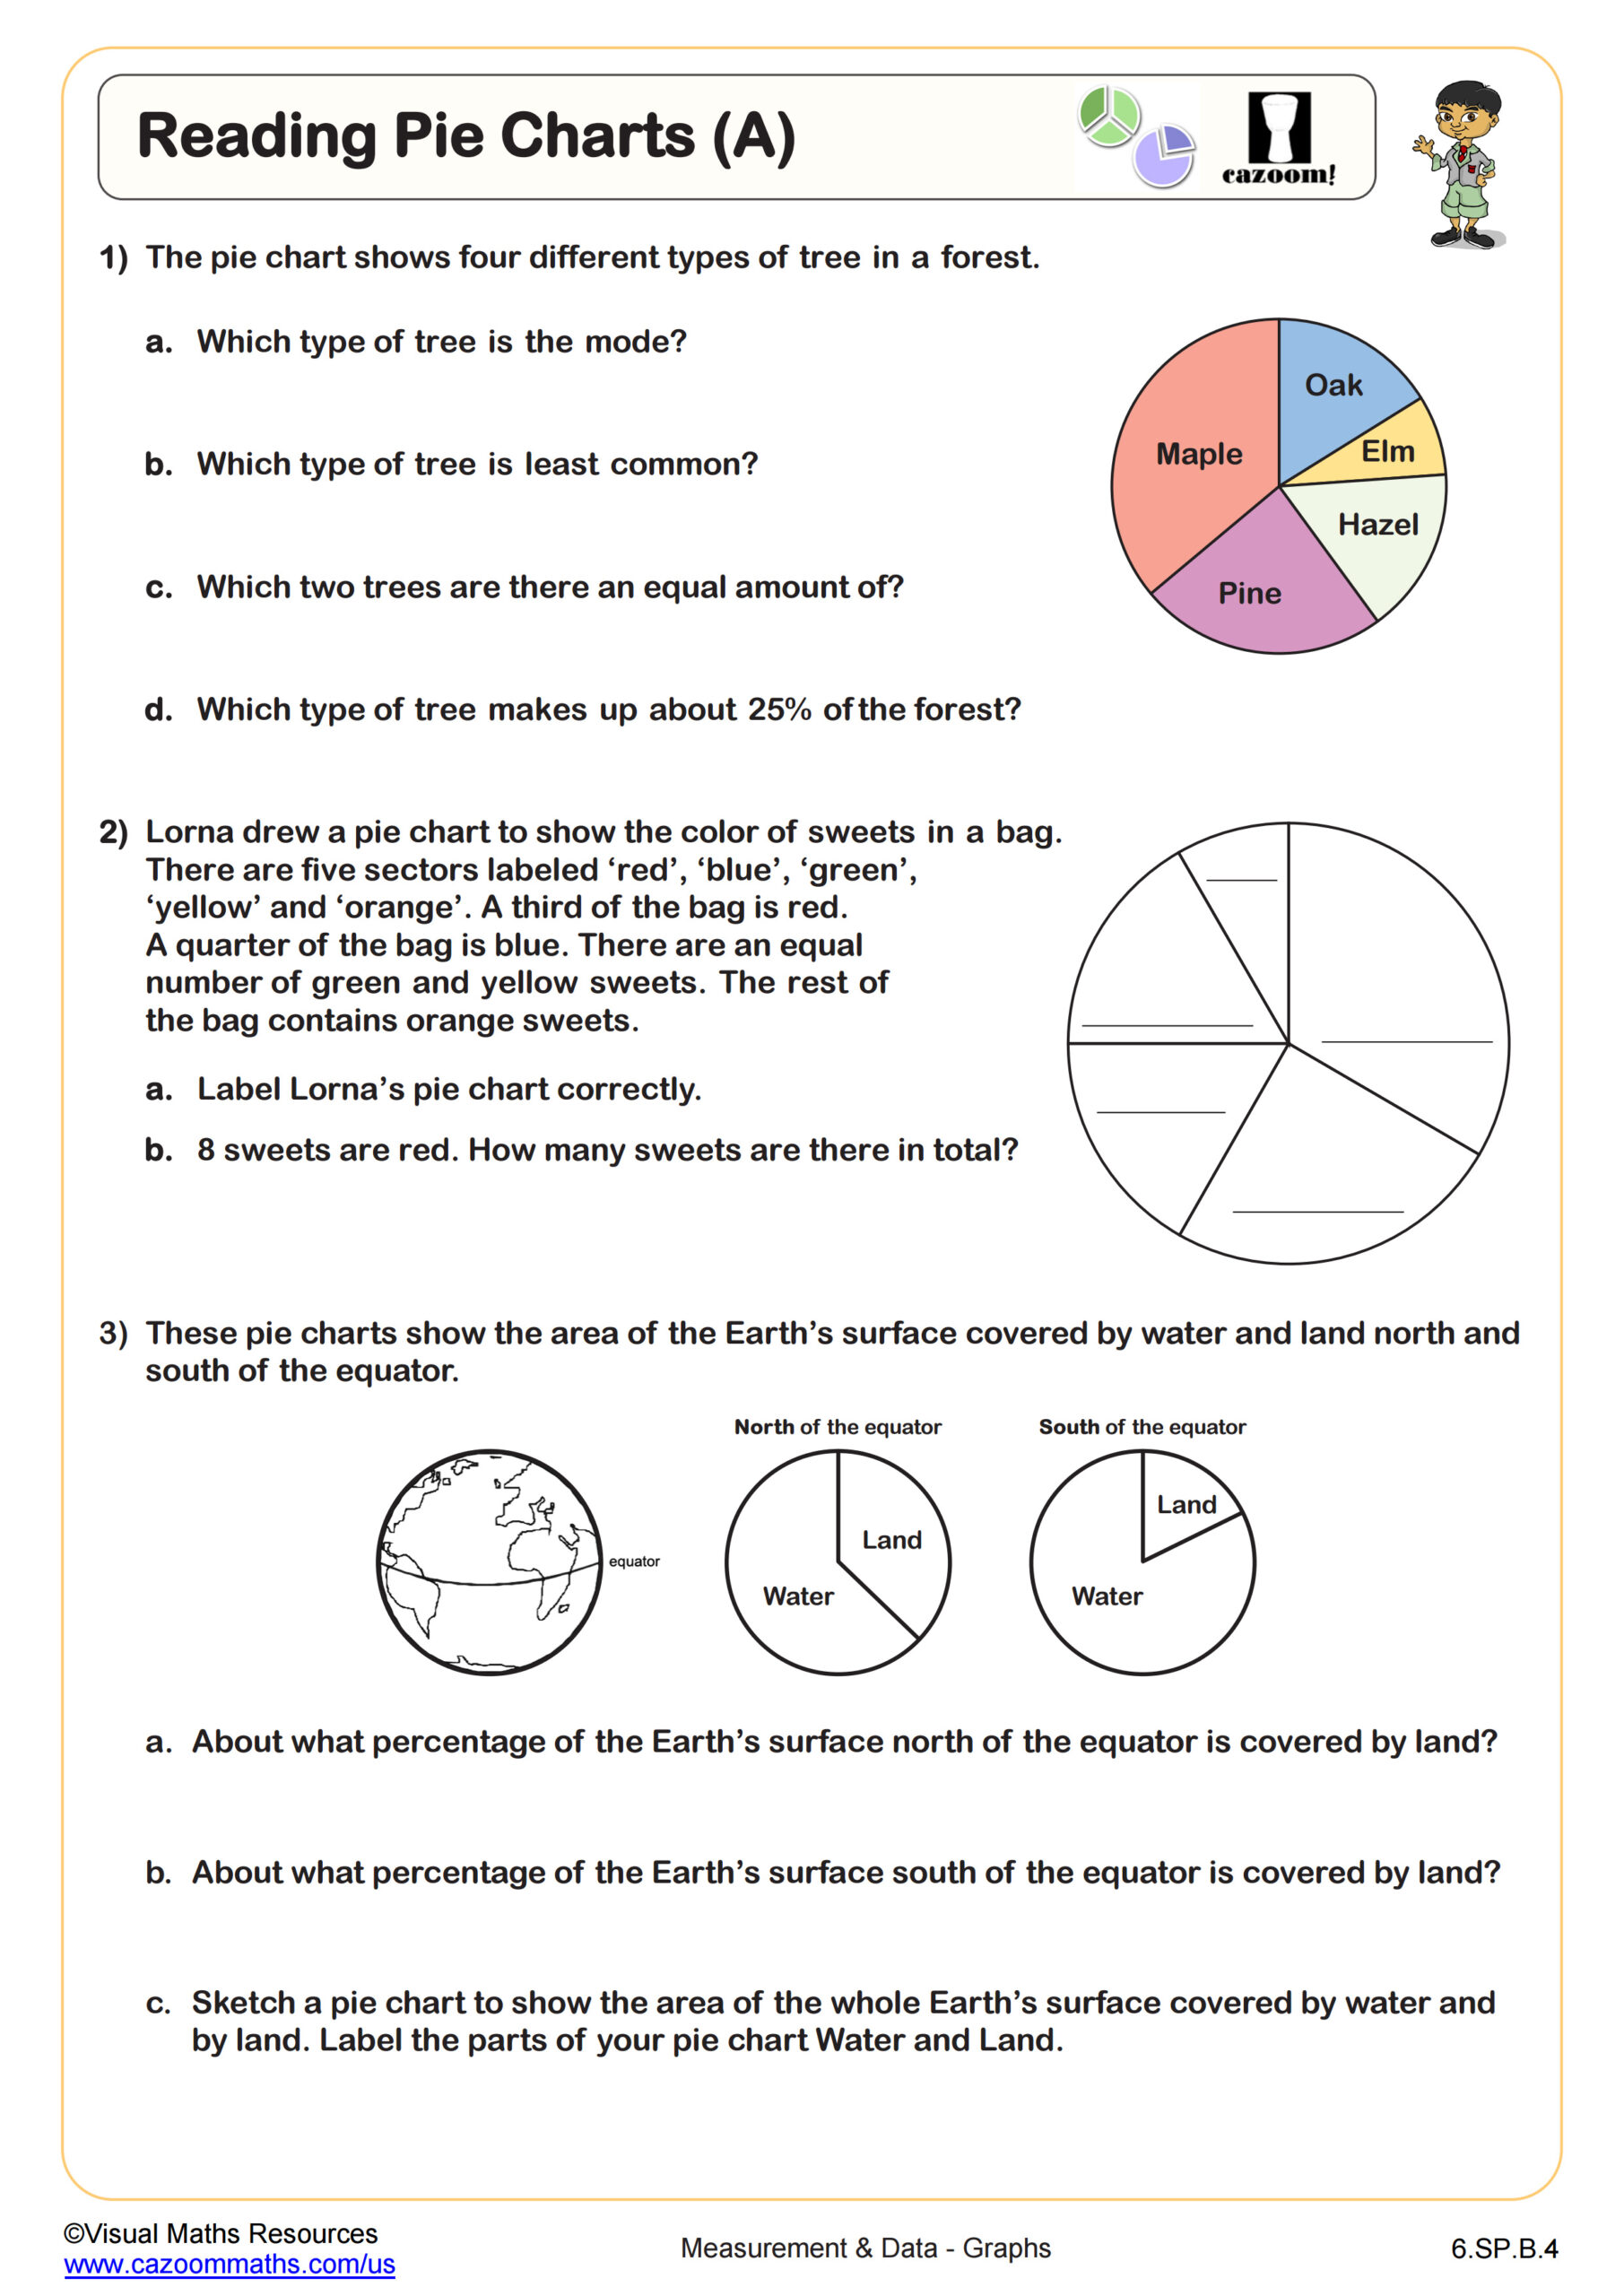
Reading Pie Charts (A)
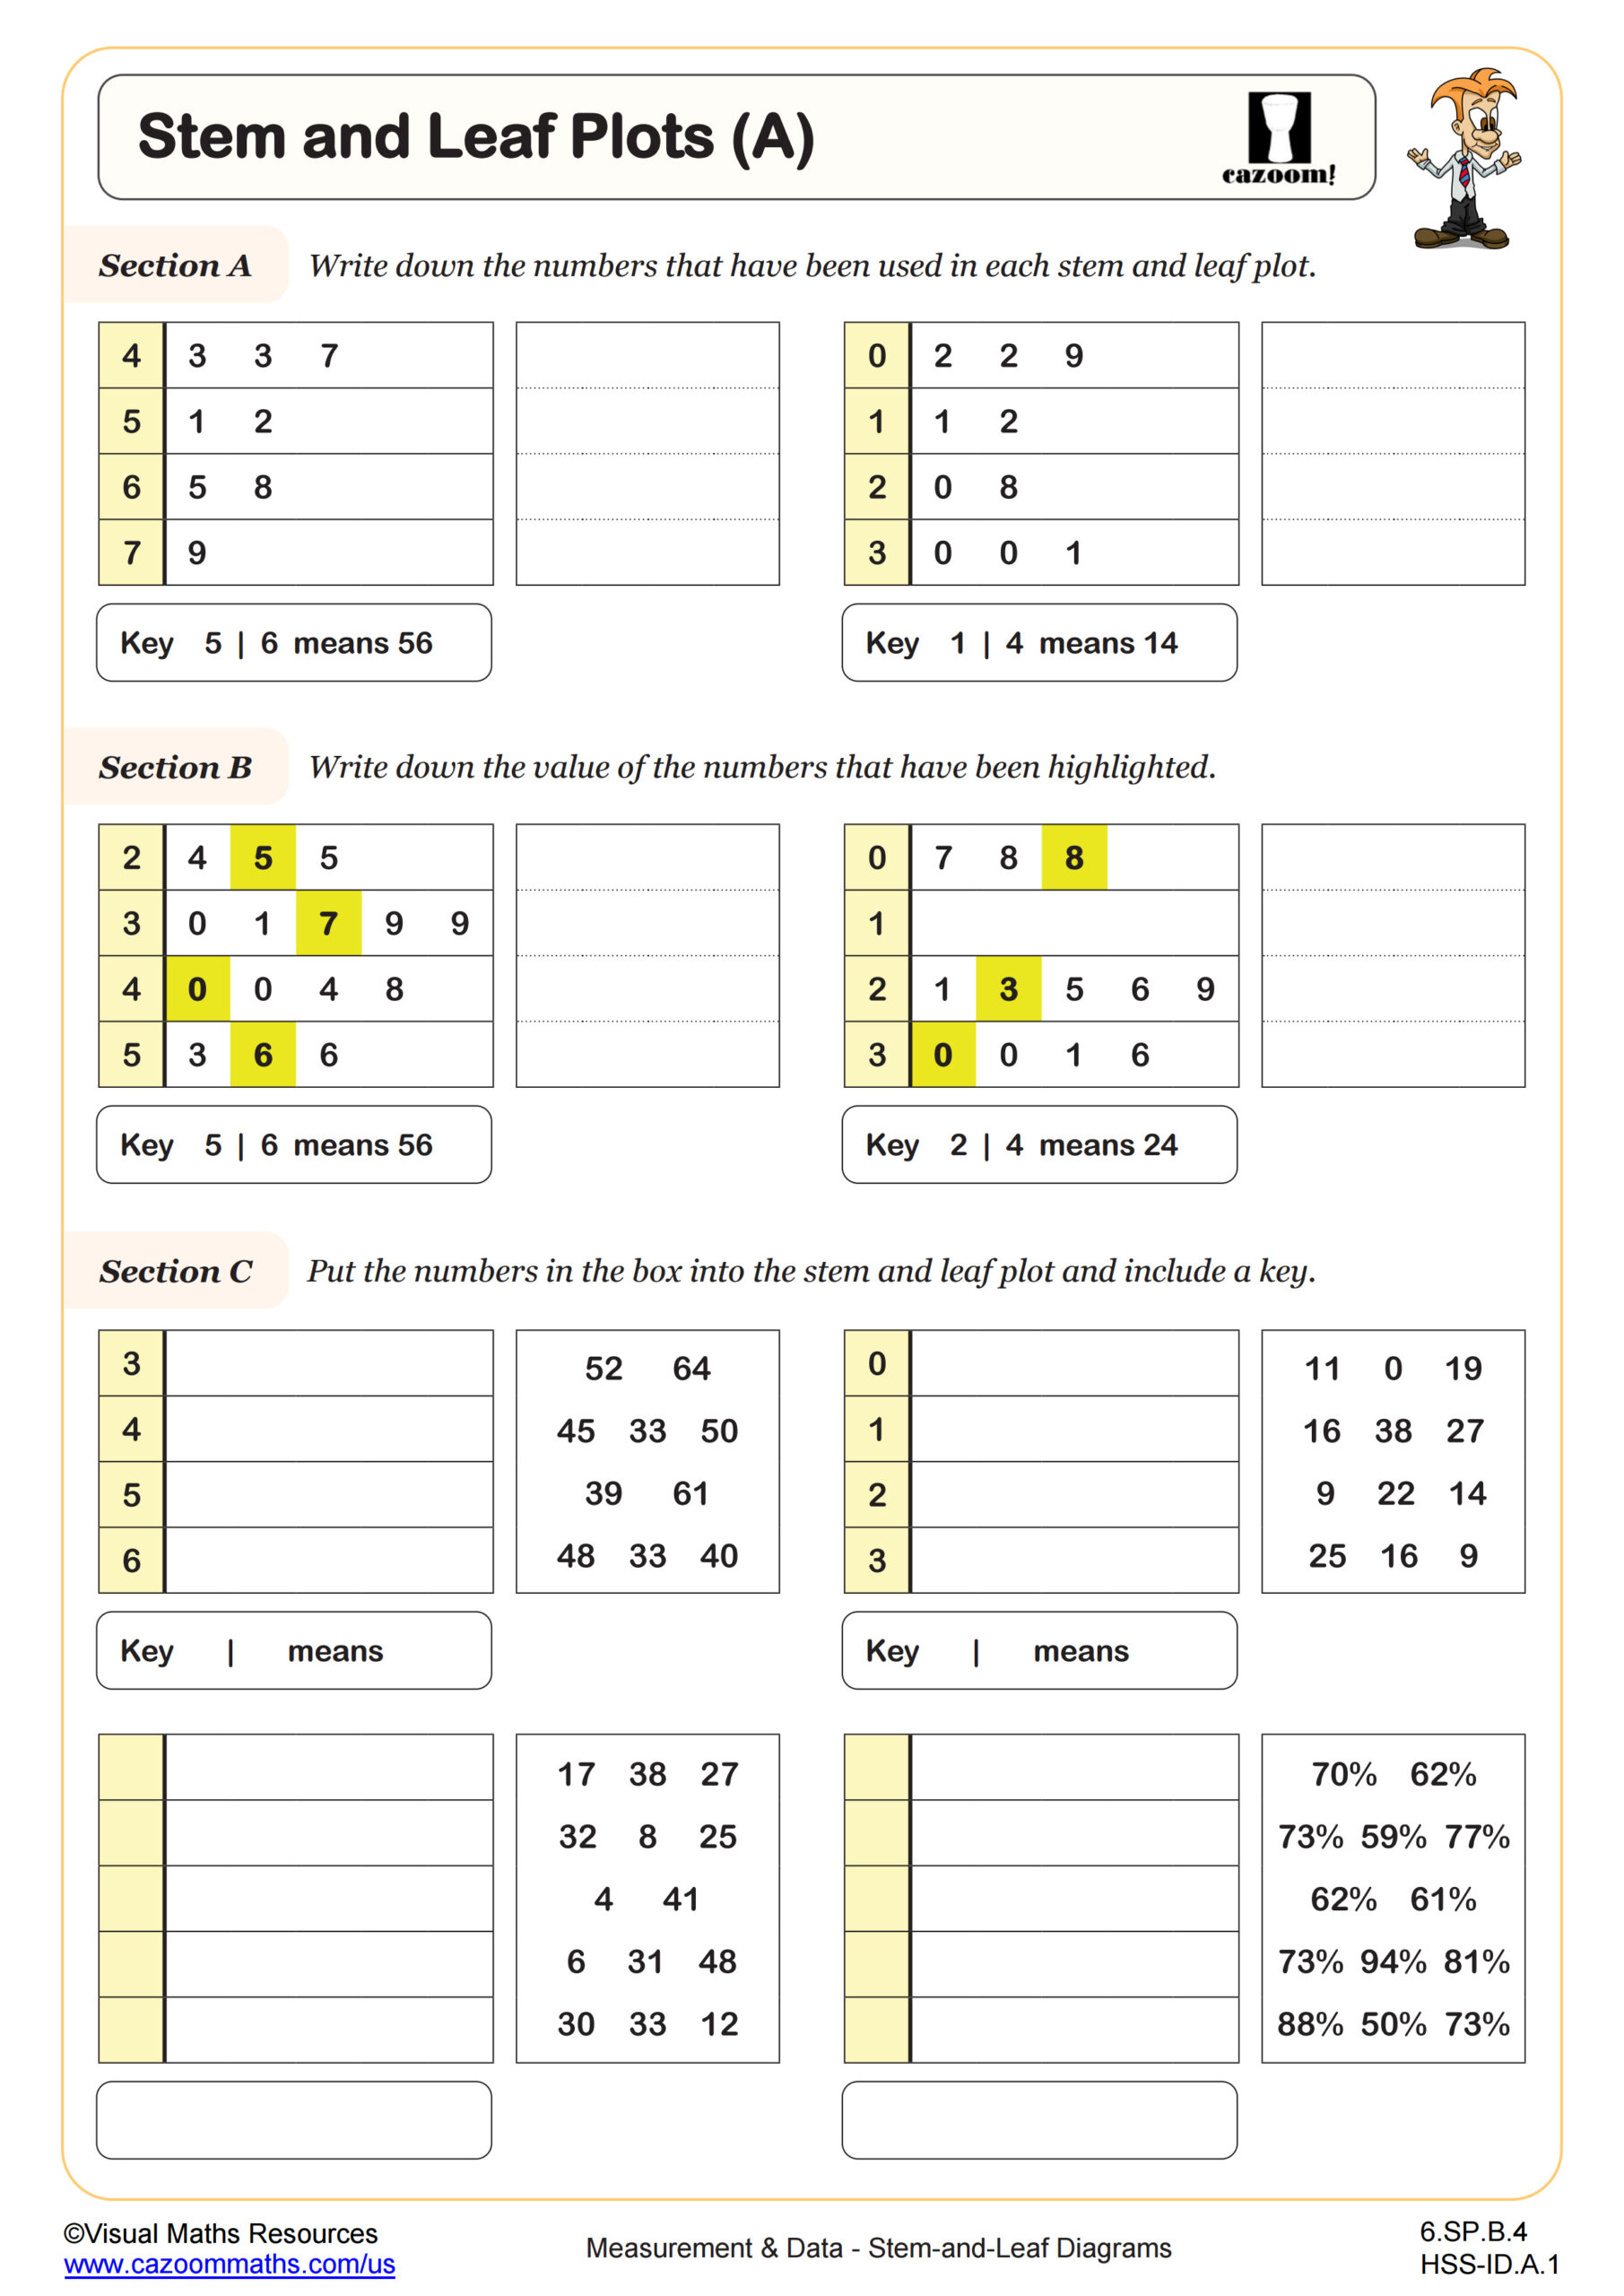
Stem and Leaf Plots (A)
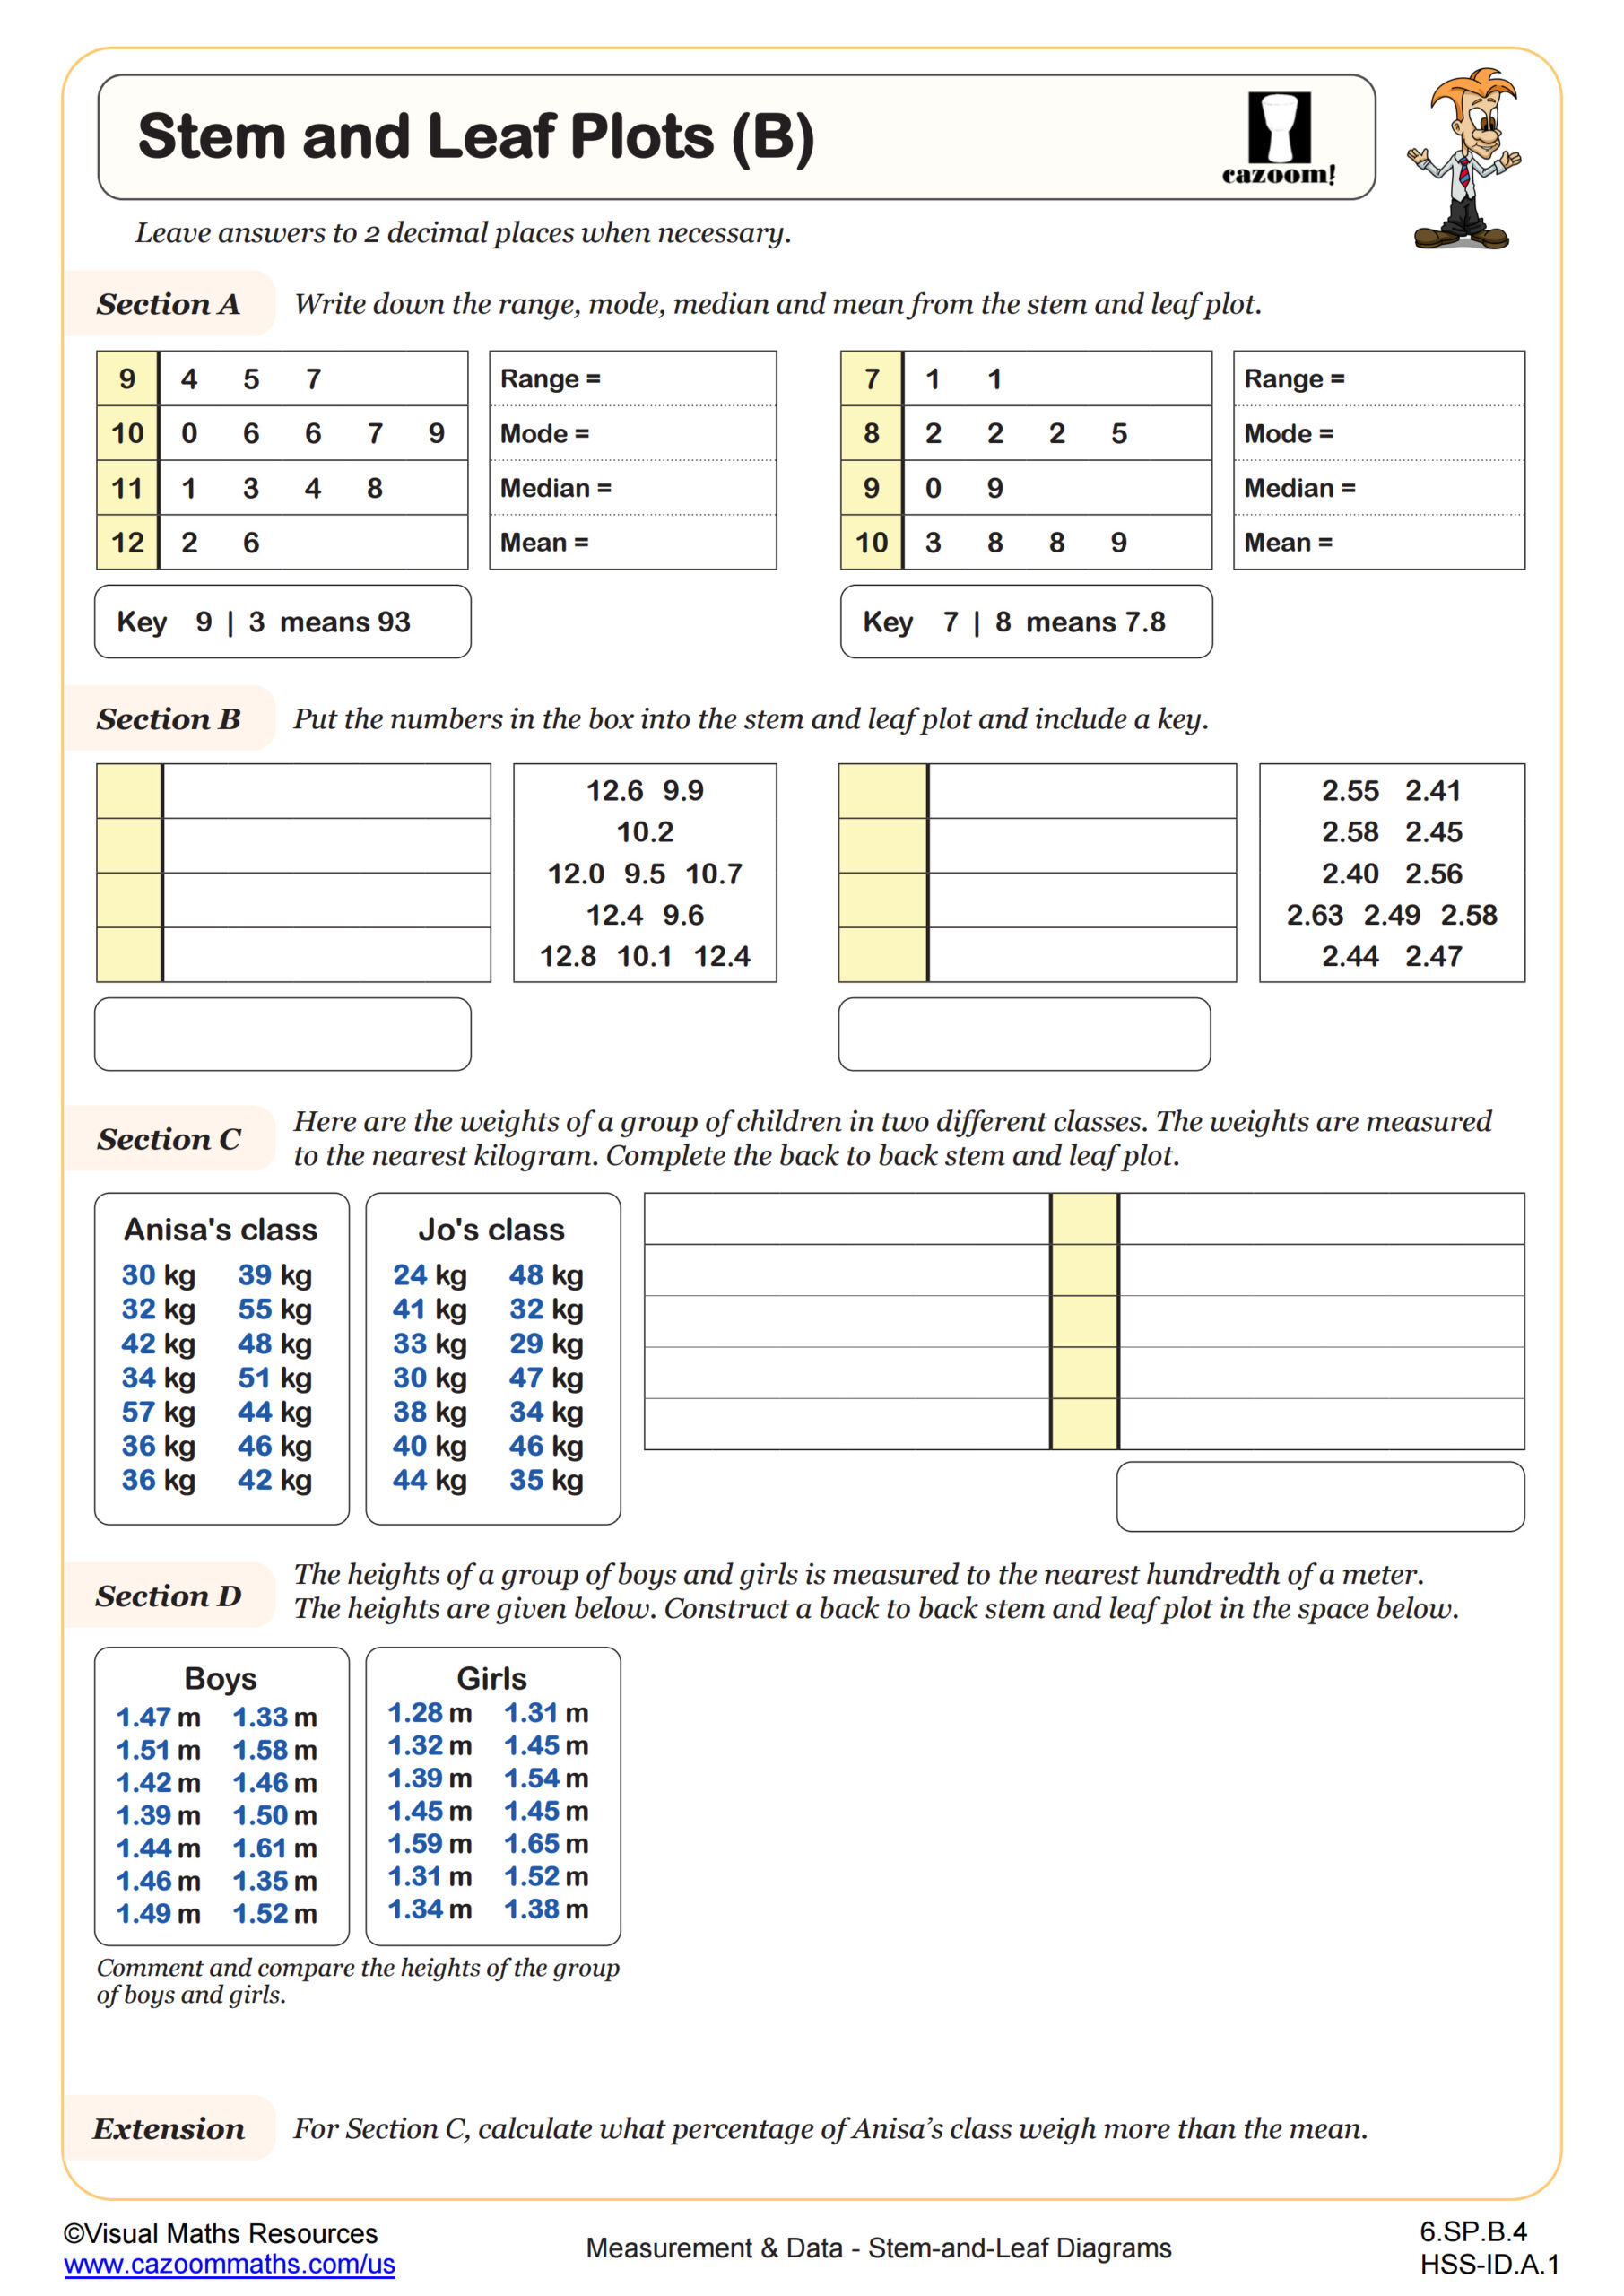
Stem and Leaf Plots (B)
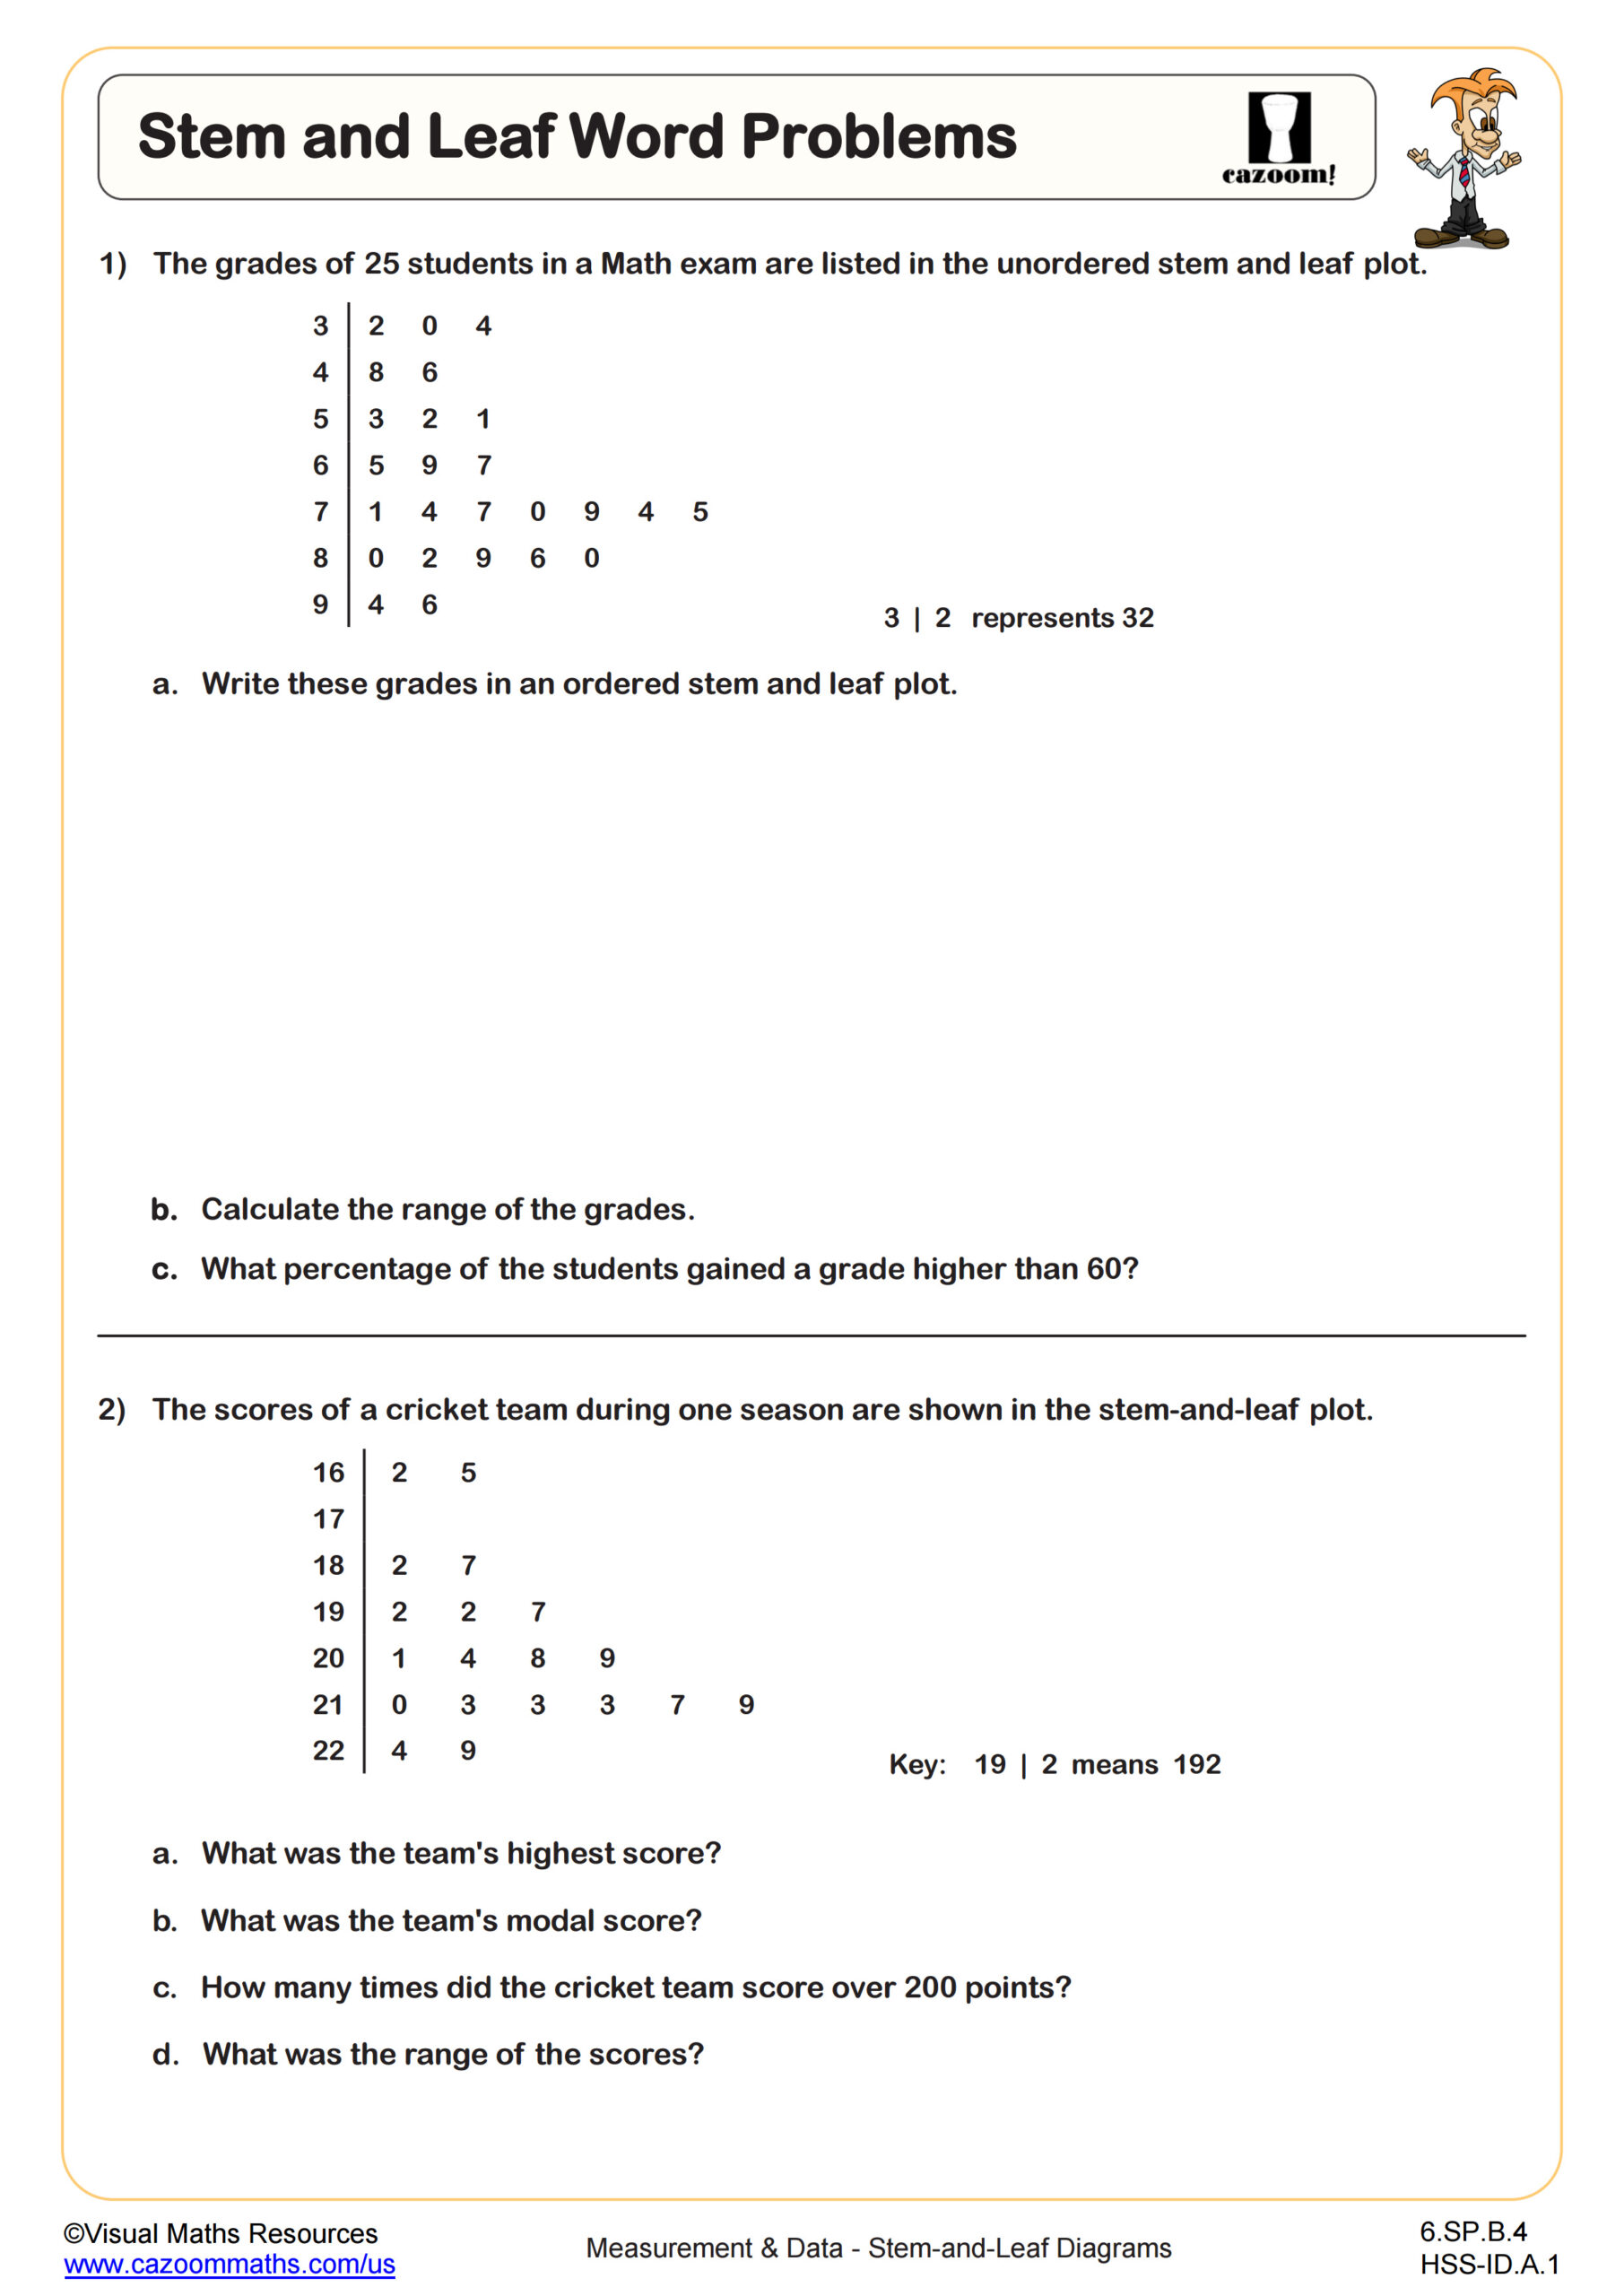
Stem and Leaf Word Problems
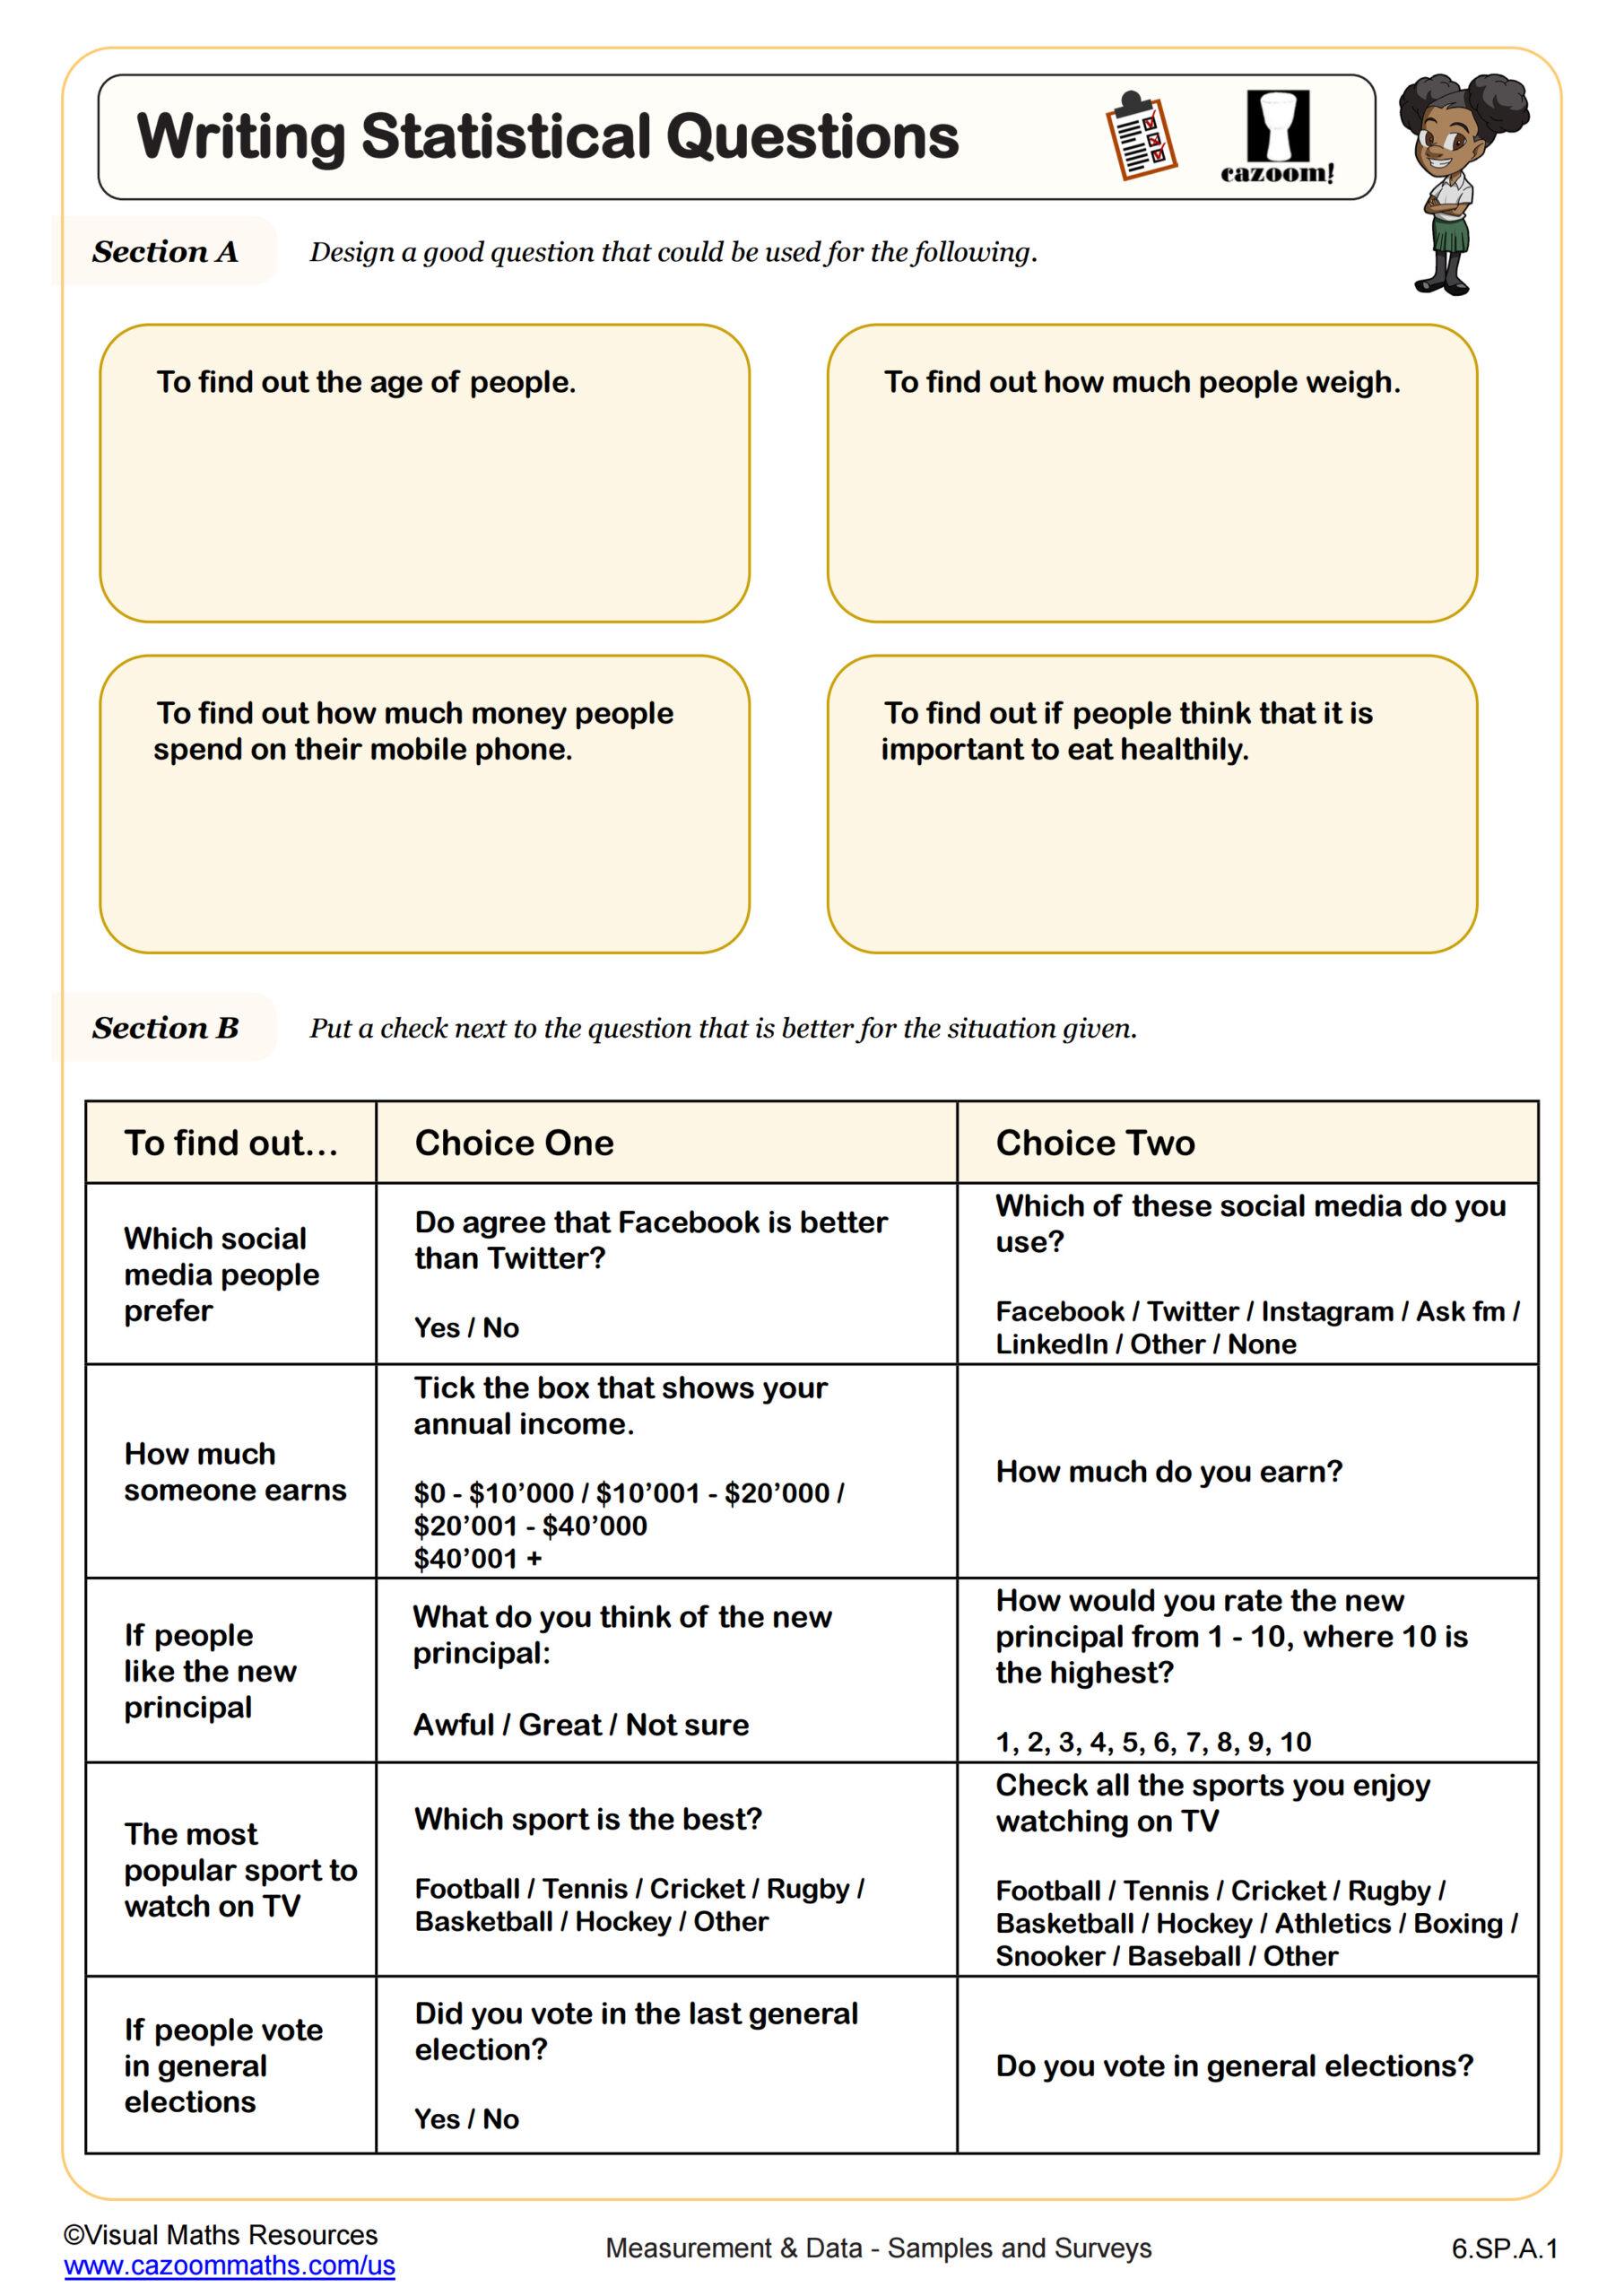
Writing Statistical Questions
All worksheets are created by the team of experienced teachers at Cazoom Math.
What topics are covered in measurement and data 6th grade curricula?
The Common Core State Standards for measurement and data 6th grade focus on statistical thinking and data interpretation. Students learn to recognize statistical questions, understand measures of center including mean and median, explore measures of variability like range and interquartile range, and create various data displays such as dot plots, histograms, and box plots.
Teachers consistently observe that students initially treat all numerical questions as statistical questions. For example, they might consider "How tall is the Statue of Liberty?" as statistical when it has one correct answer, versus "How tall are sixth graders at our school?" which requires data collection and analysis. This distinction becomes clearer through repeated practice with varied question types.
How do 6th grade statistics worksheets build on previous learning?
Sixth grade statistics worksheets extend elementary data work by introducing formal statistical vocabulary and concepts. While fifth graders create simple graphs and interpret data, sixth graders analyze the shape, center, and spread of data distributions. They move beyond just reading graphs to making inferences and comparisons between datasets.
The progression from concrete to abstract thinking becomes evident as students transition from counting and organizing data to calculating measures of center and discussing variability. Teachers notice this shift requires substantial scaffolding, as students must now think about data as a collective entity rather than individual data points. This foundational work prepares them for more sophisticated statistical analysis in later grades.
Why do students find measures of variability challenging?
Measures of variability challenge students because they require understanding how data points relate to each other and to measures of center. Unlike mean or median, which students can calculate procedurally, variability concepts like range and interquartile range demand conceptual understanding of data spread and distribution shape.
Classroom observations reveal that students often confuse range with median or struggle to explain what variability means in context. For instance, when comparing test scores from two classes, students might correctly calculate that Class A has a range of 20 points while Class B has a range of 35 points, but fail to interpret that Class B's scores are more spread out. Real-world connections help, such as discussing weather temperature variations or sports statistics where consistency matters.
What strategies help students master data collection worksheet problems?
Effective data collection worksheet strategies involve connecting statistical questions to students' experiences and interests. Teachers find success when they start with familiar contexts like favorite foods, sports preferences, or classroom surveys before moving to abstract datasets. This approach helps students understand that statistical questions anticipate variability in responses.
Scaffolding works best when students first identify whether questions are statistical, then predict possible responses, and finally analyze collected data. Teachers notice that students benefit from discussing why certain questions yield useful data while others do not. For example, asking "What is your favorite color?" generates meaningful data for analysis, while "What color is grass?" does not, since responses lack variability needed for statistical investigation.