6th Grade Measurement and Data Worksheets
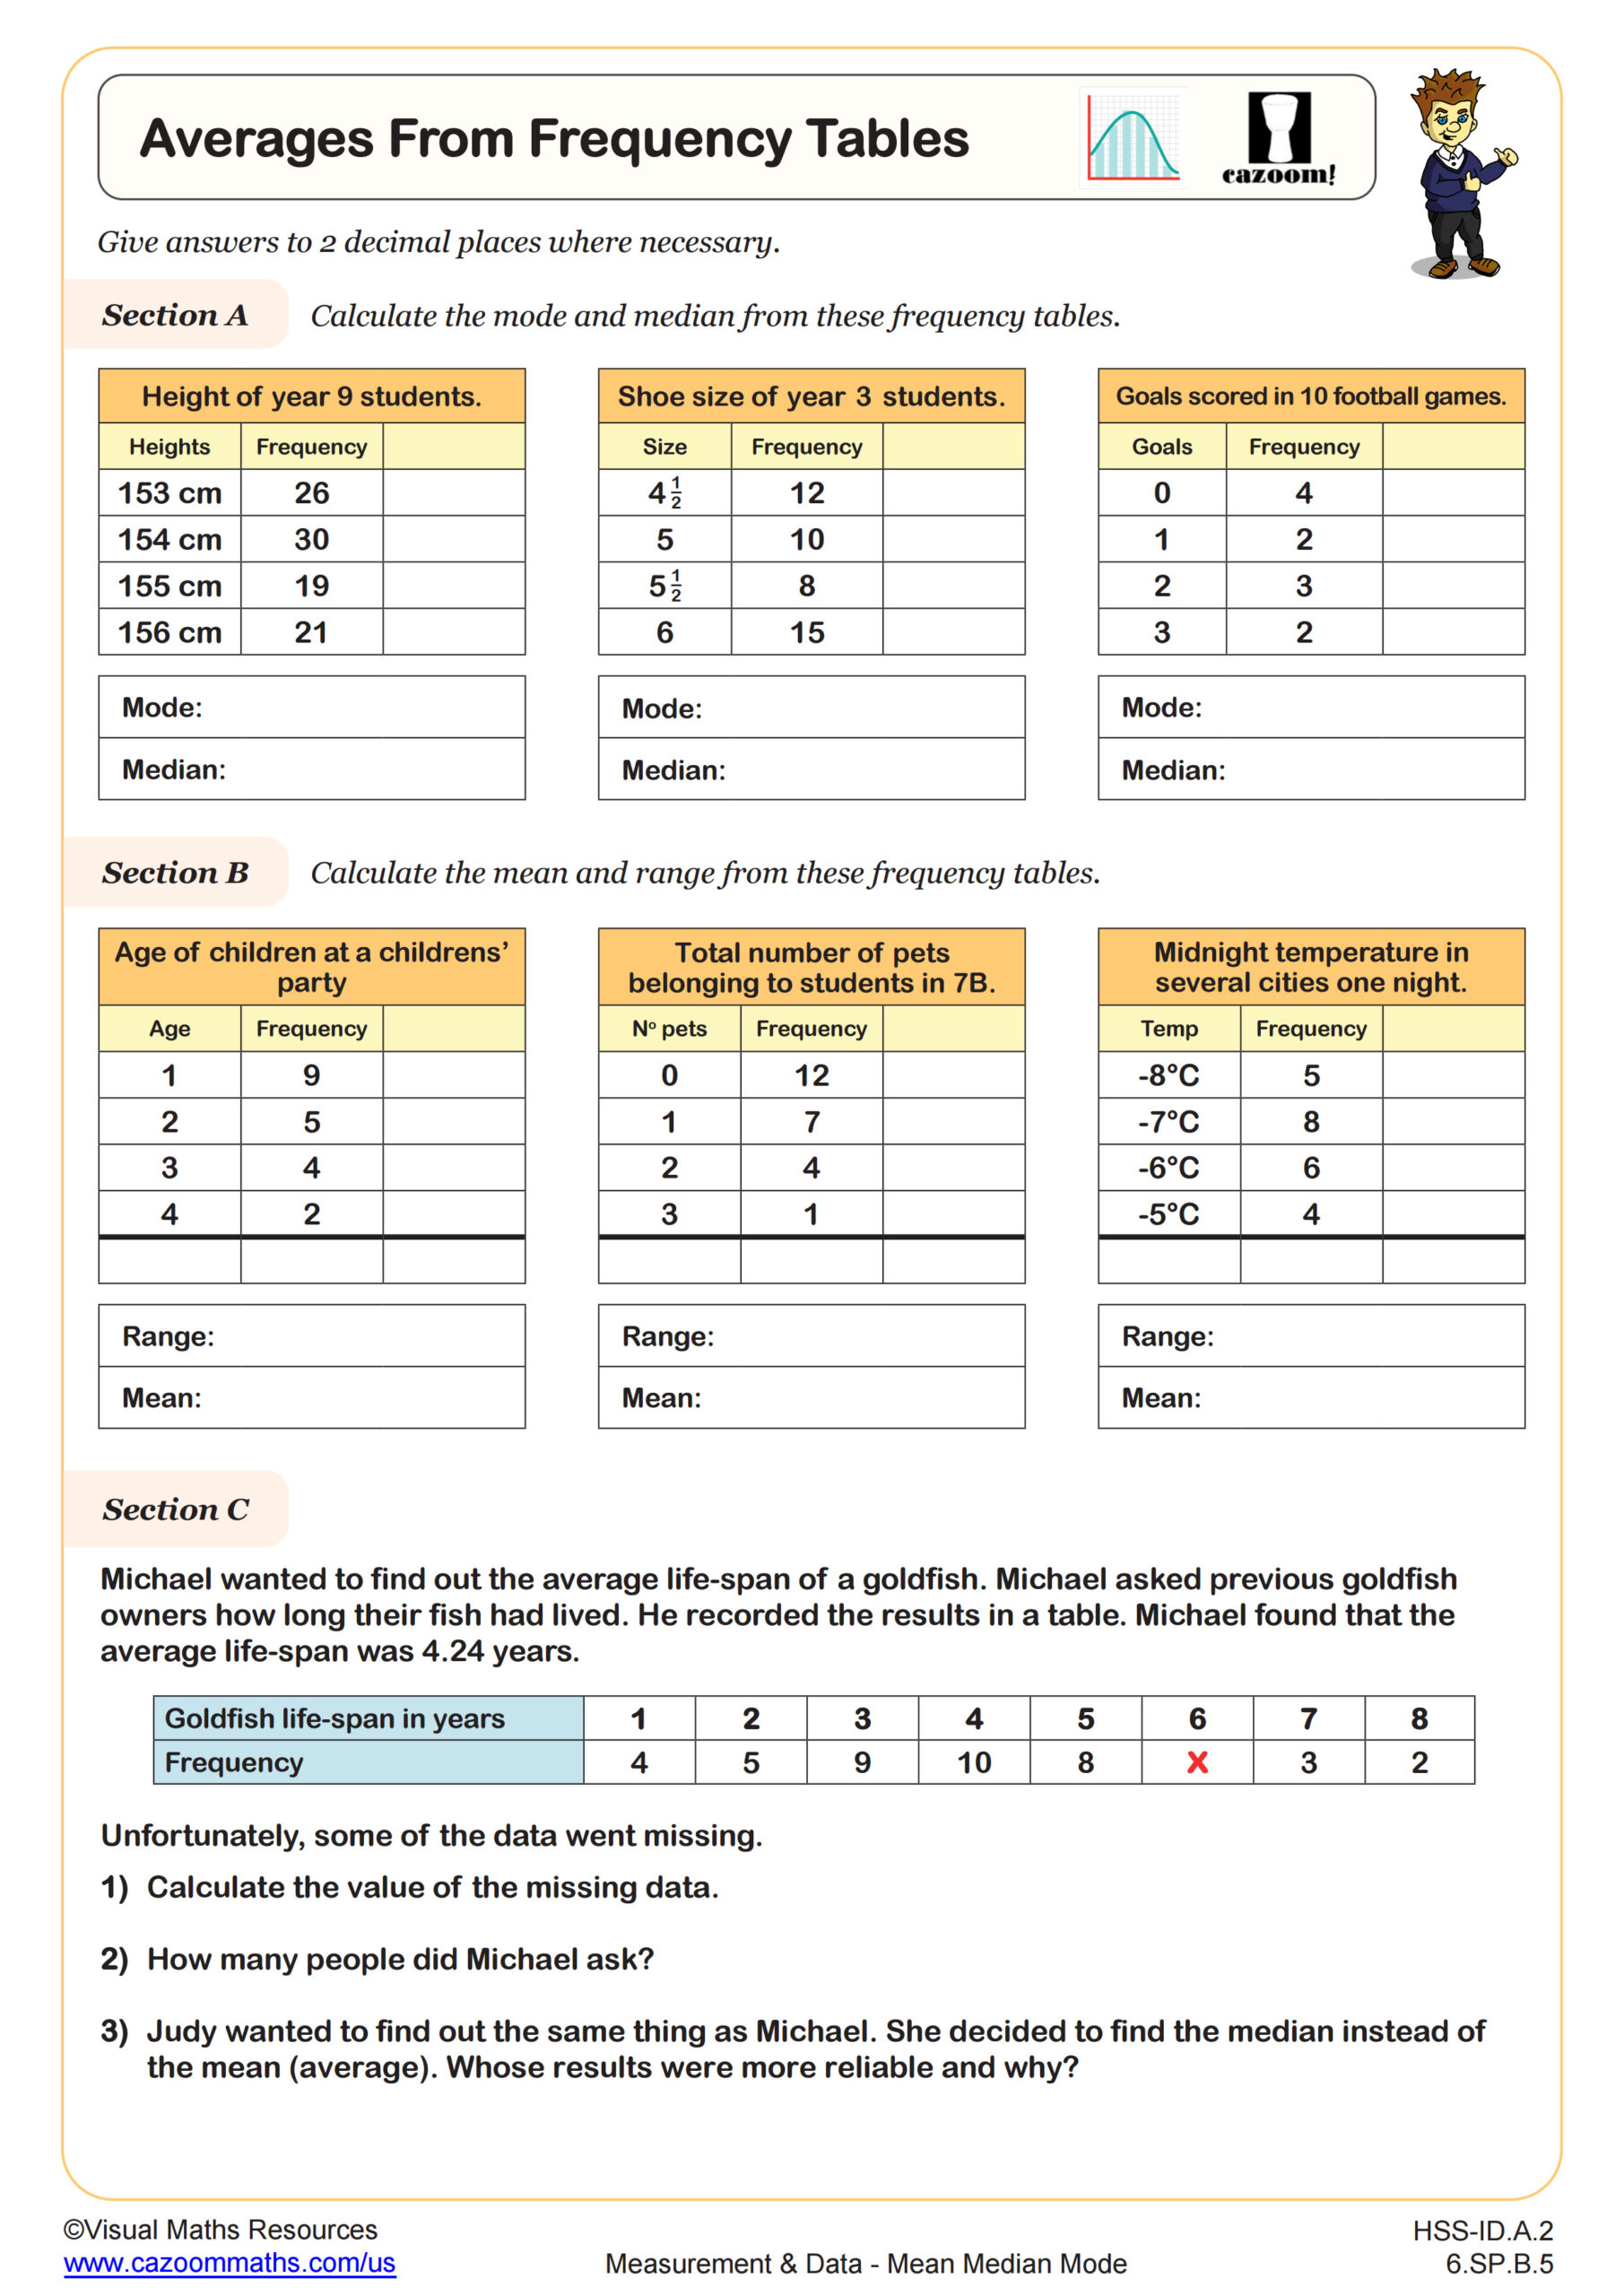
Averages from Frequency Tables
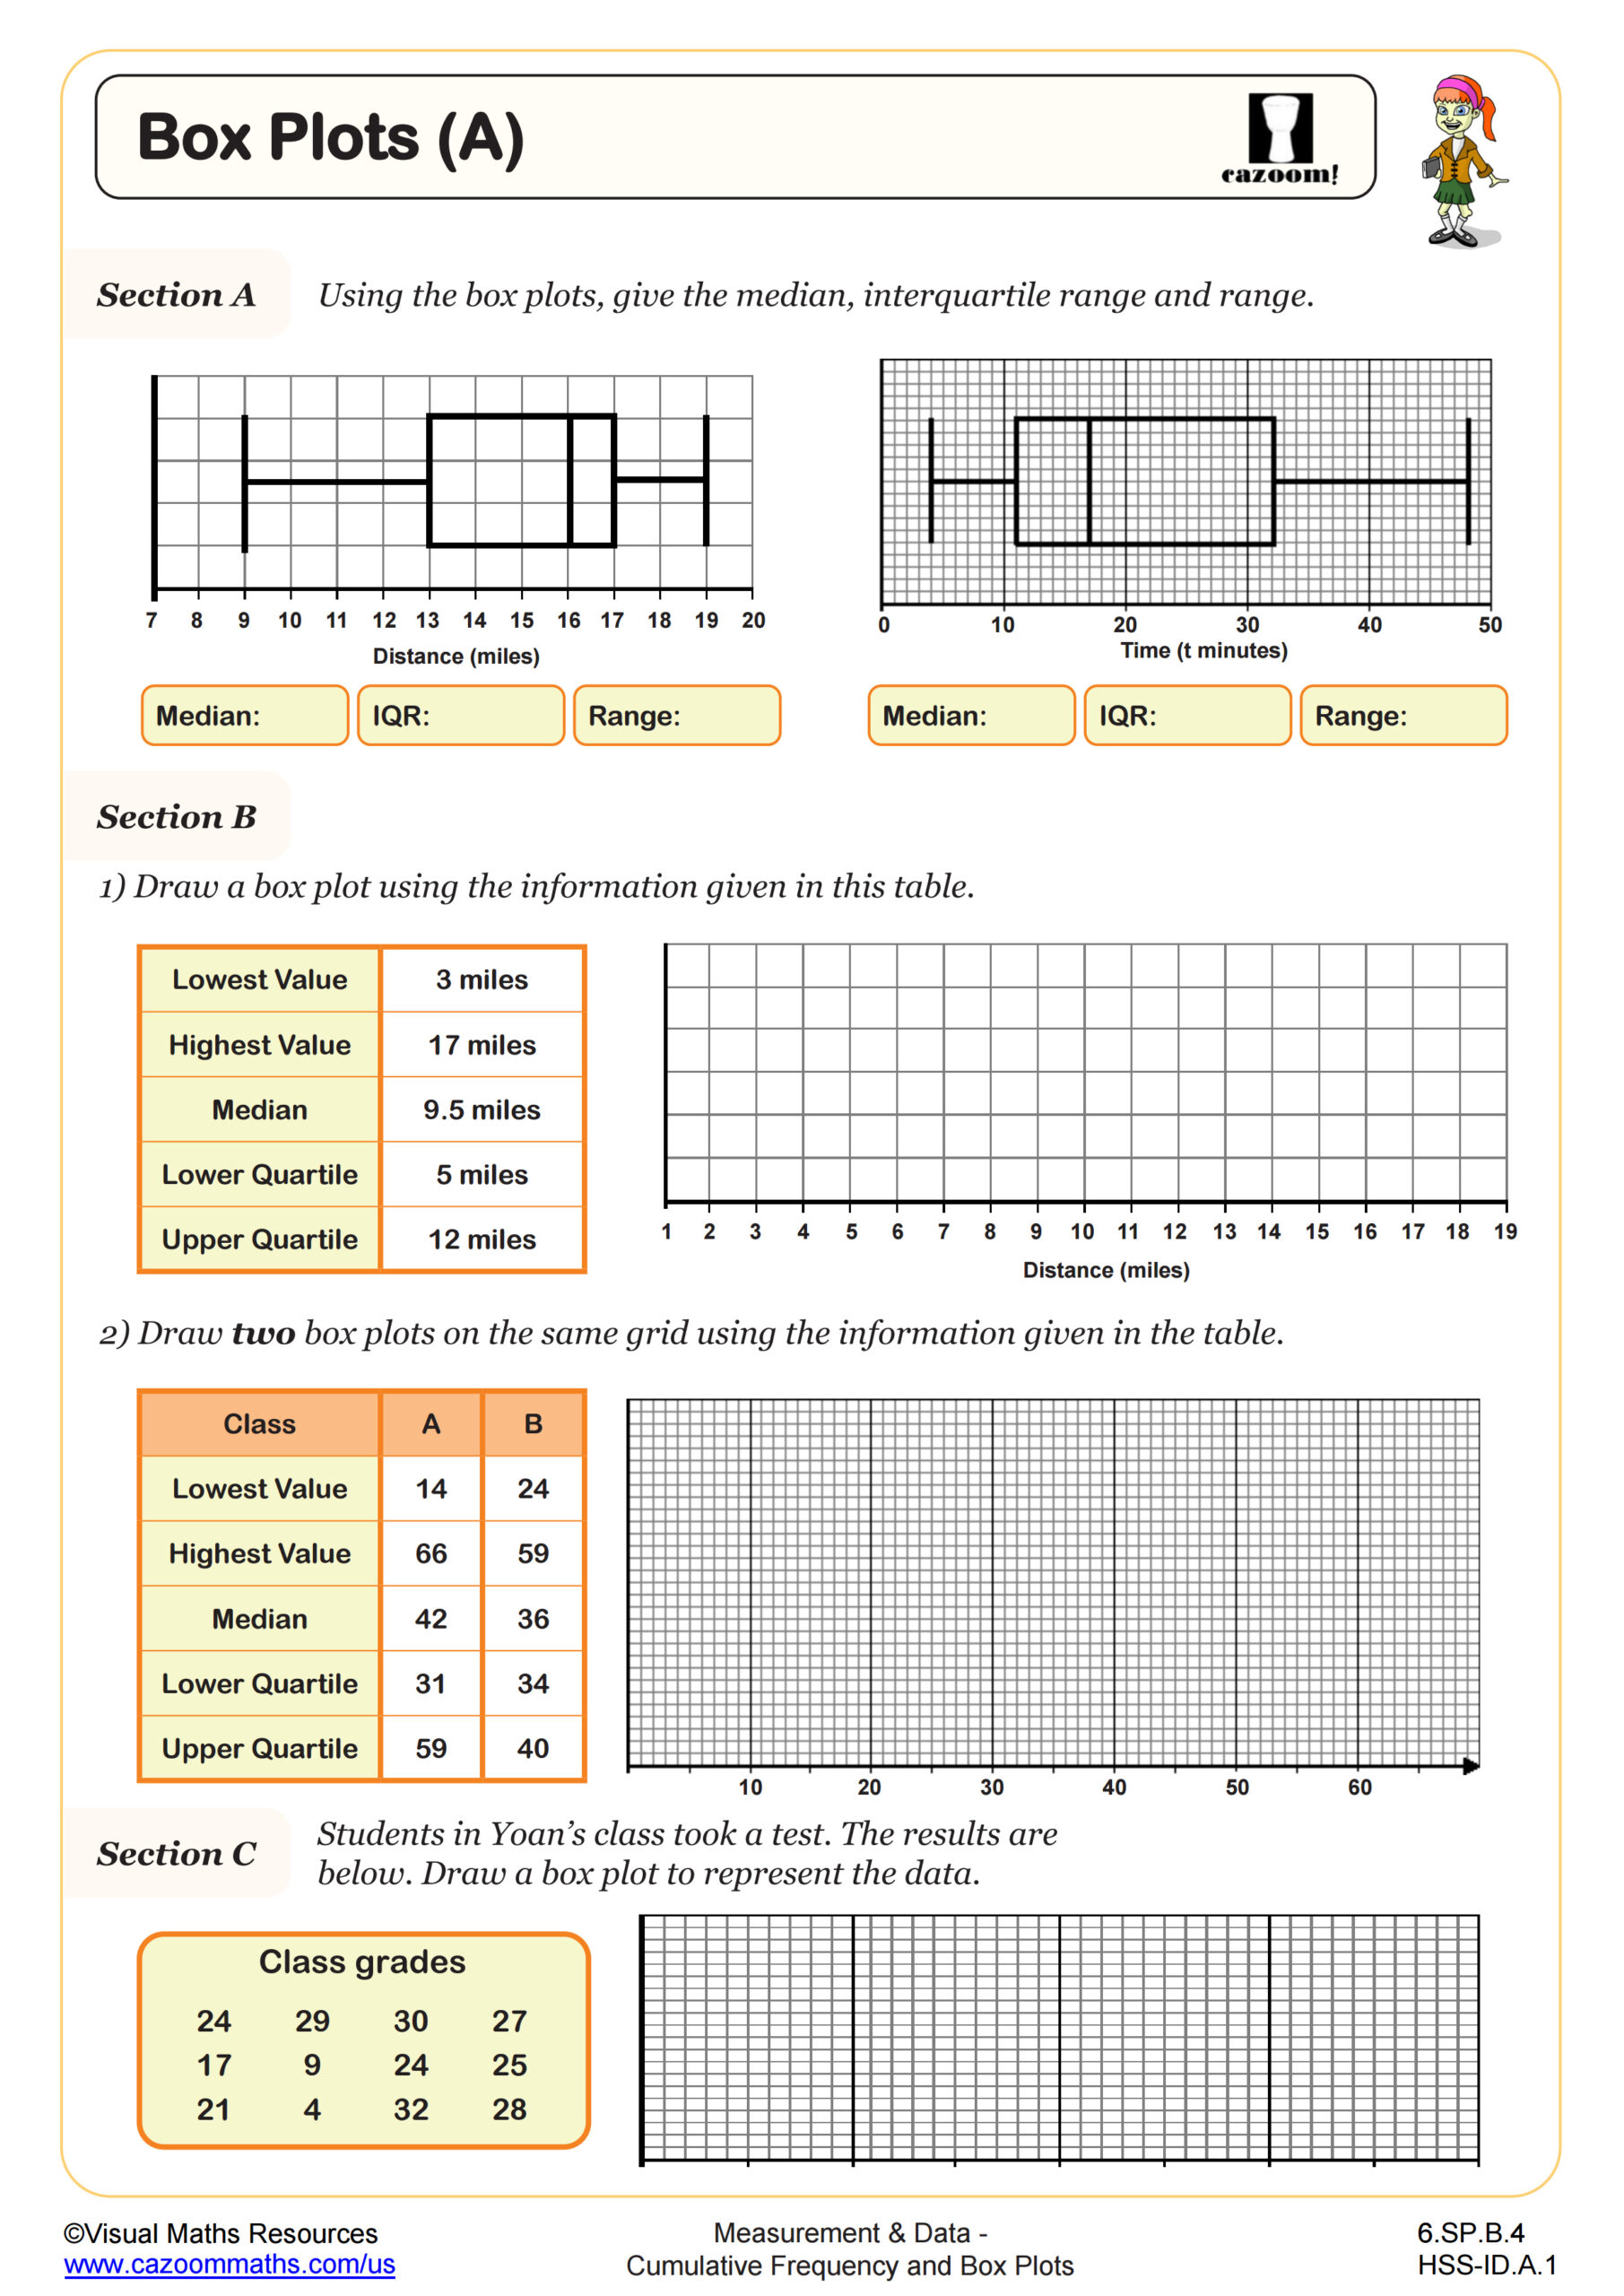
Box Plots (A)
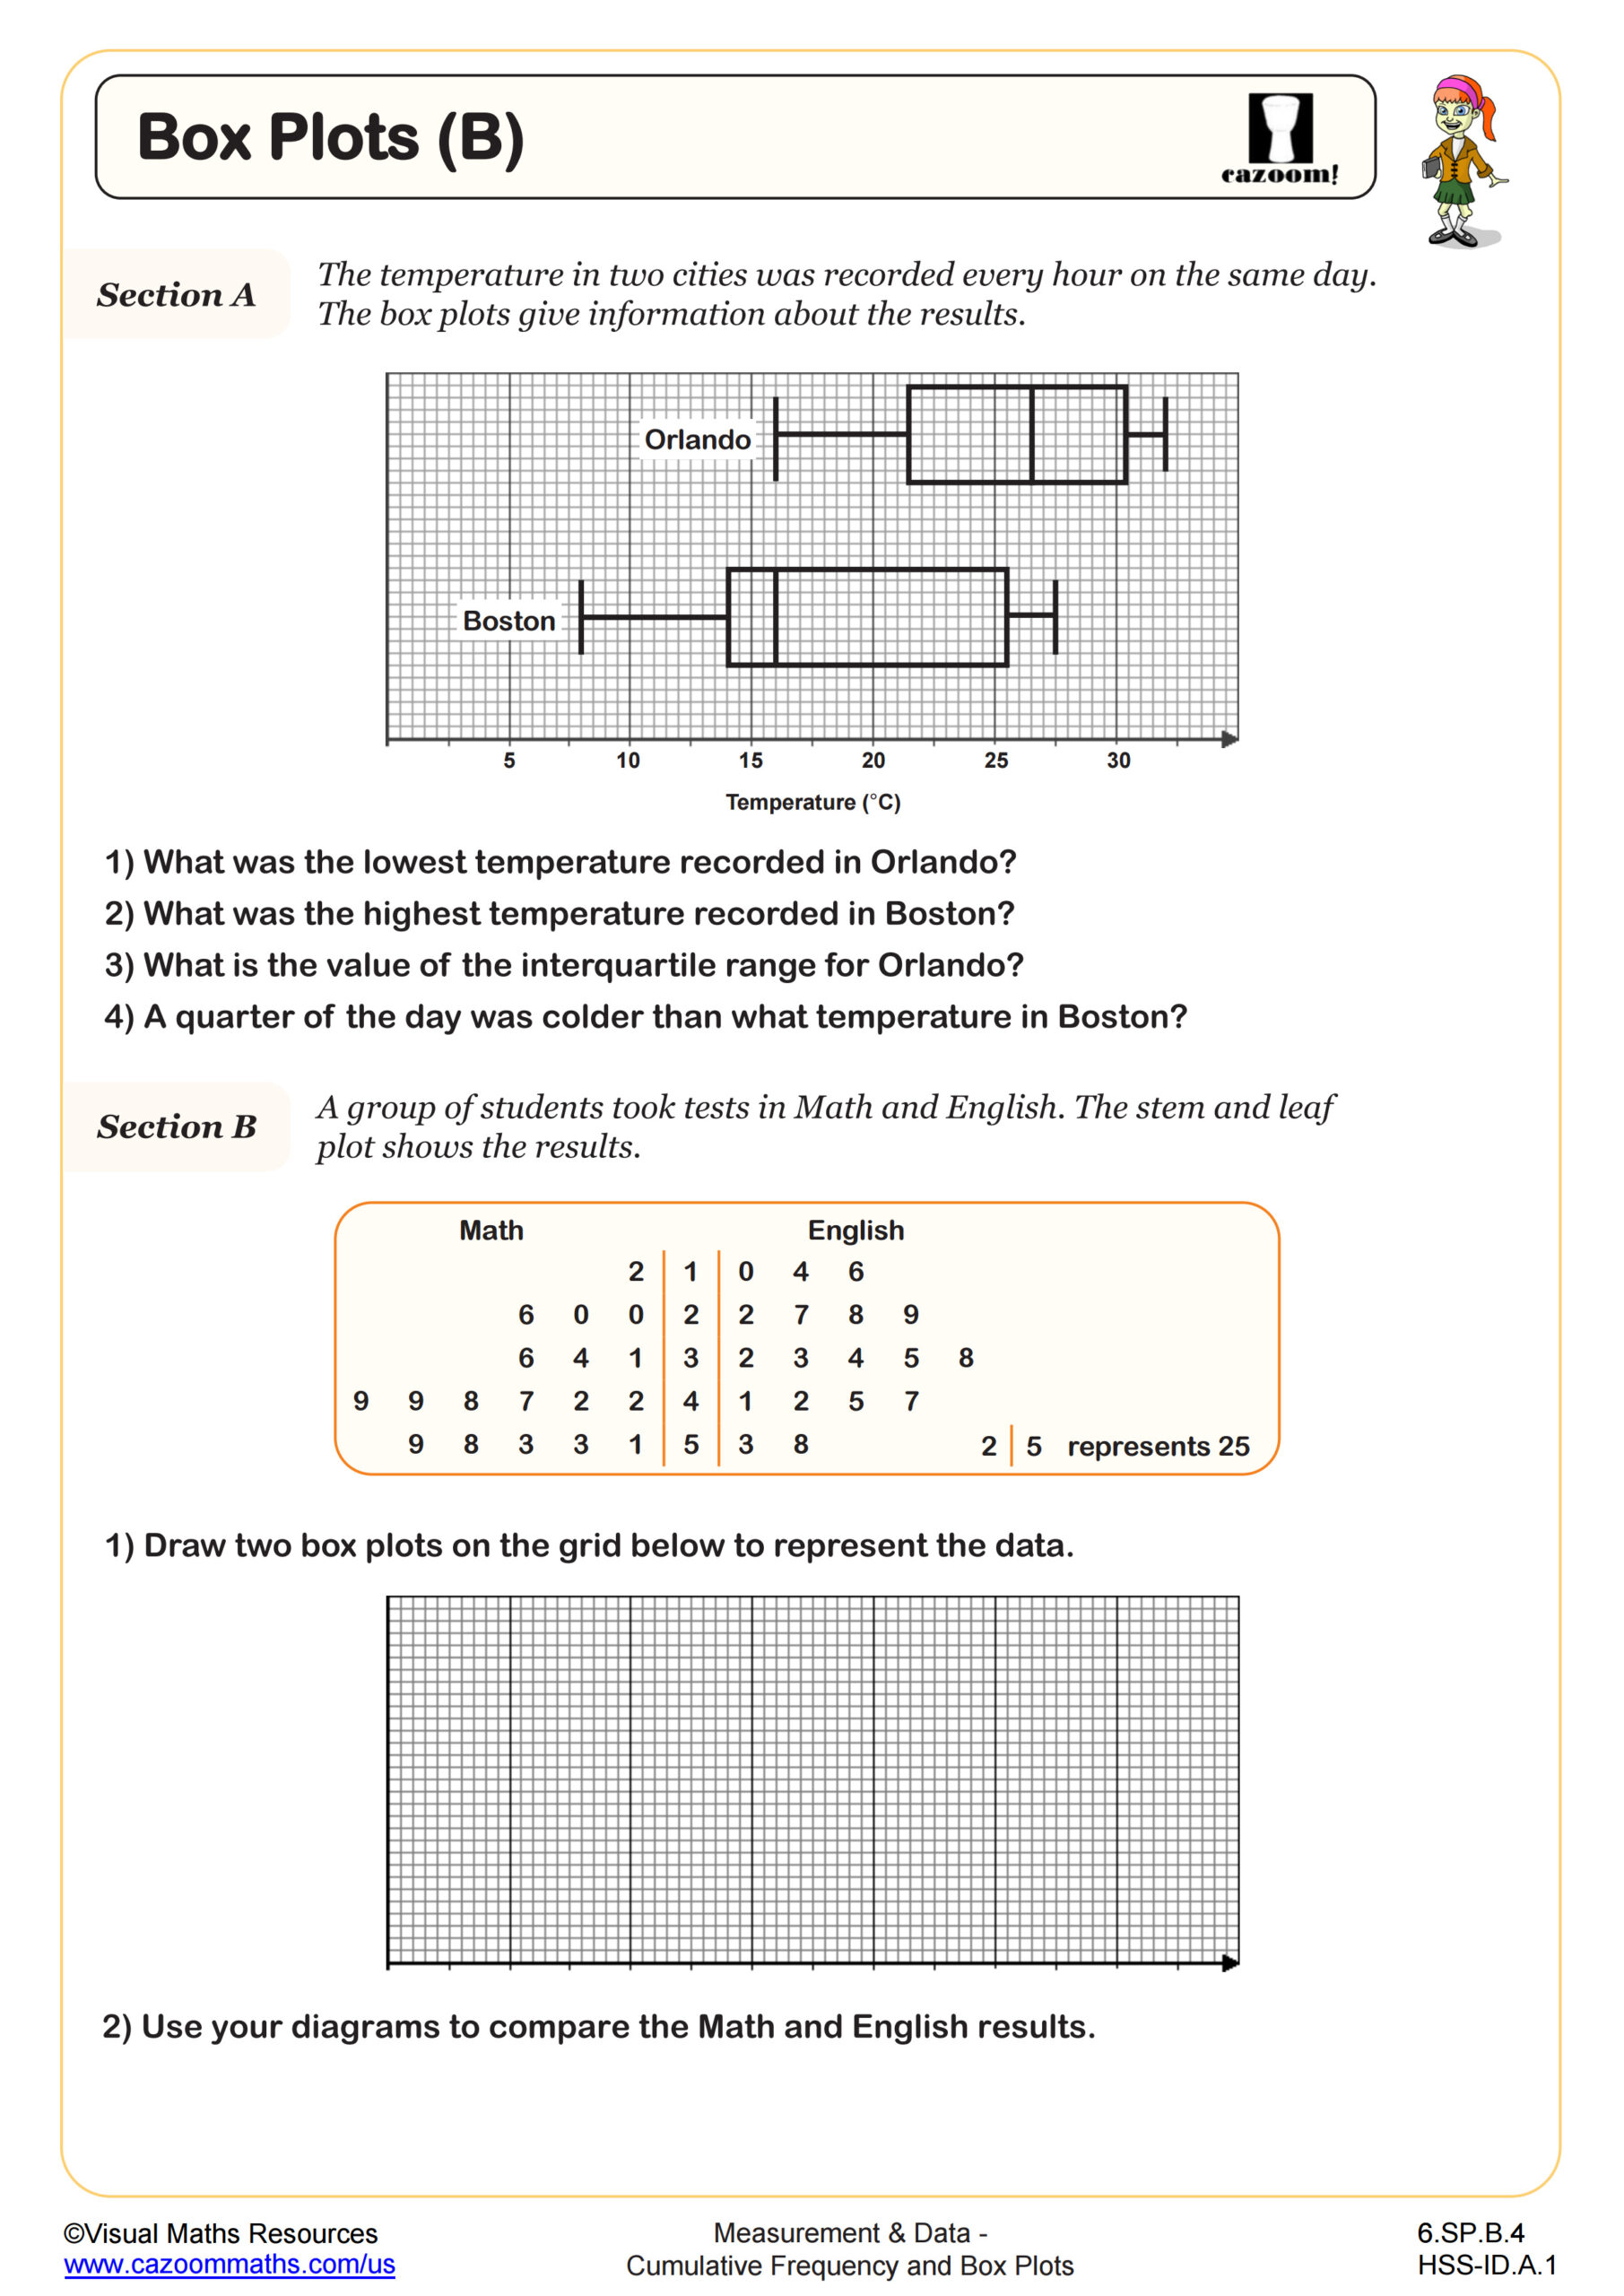
Box Plots (B)
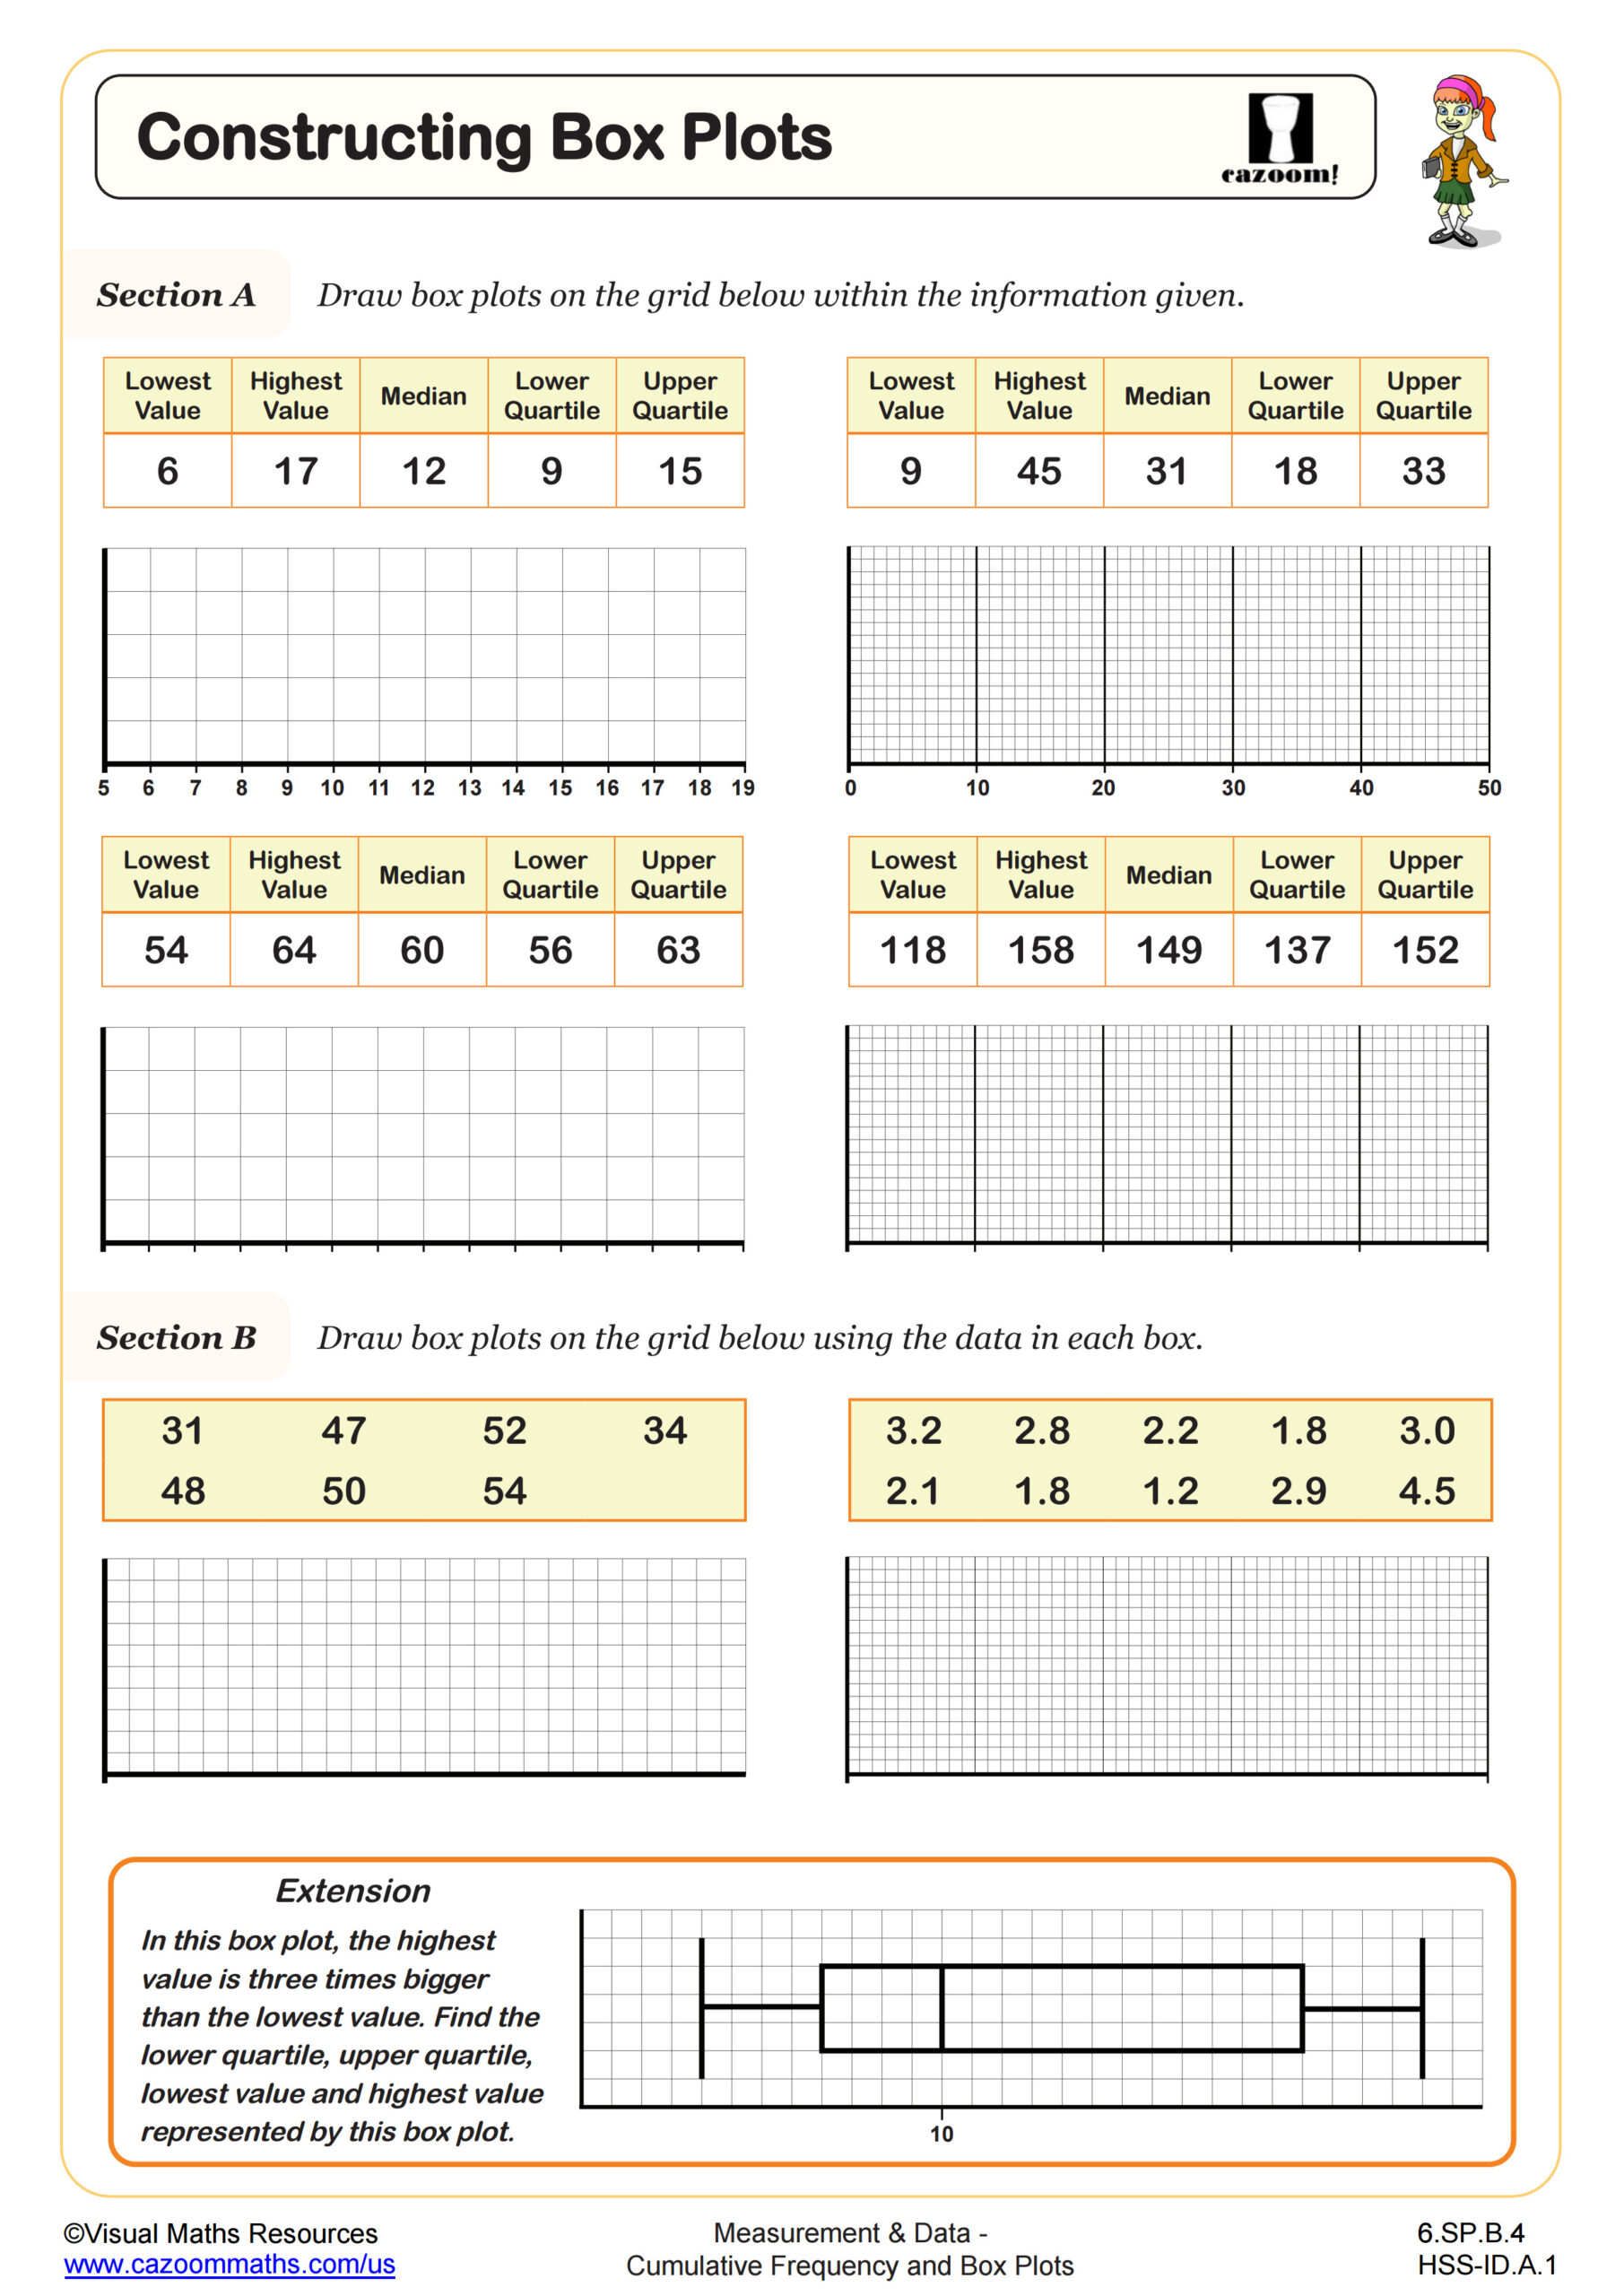
Constructing Box Plots
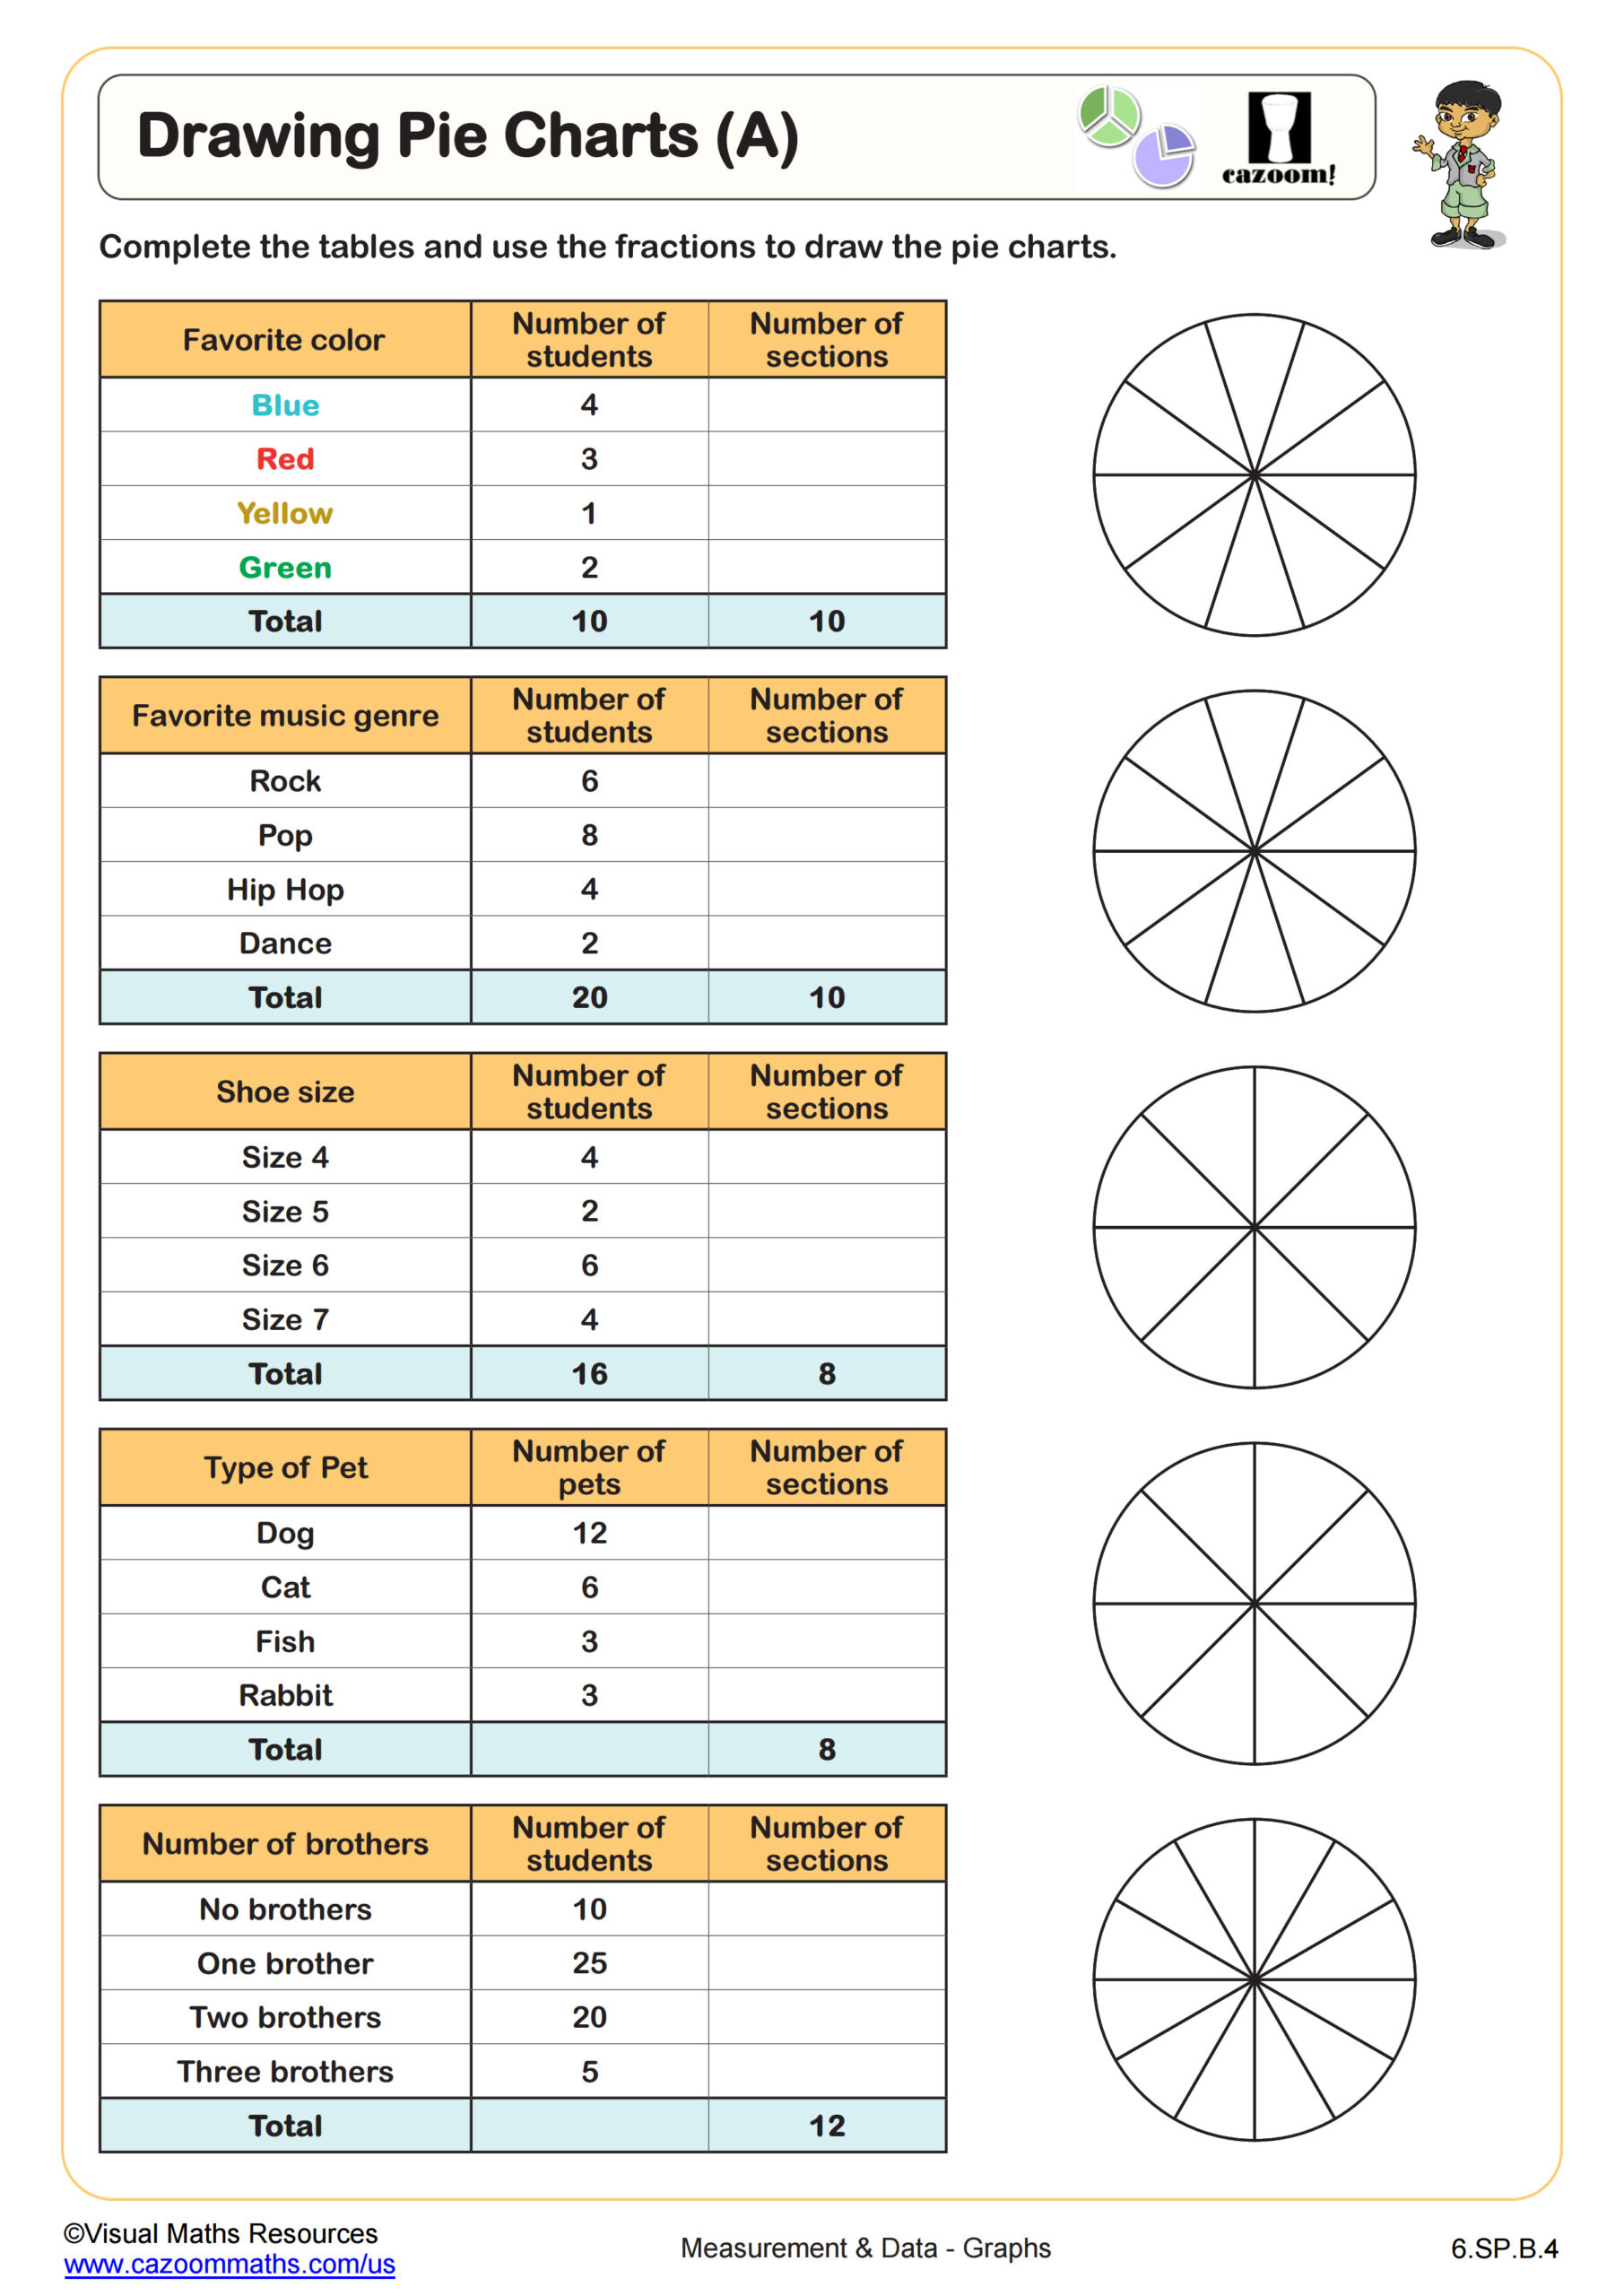
Drawing Pie Charts (A)
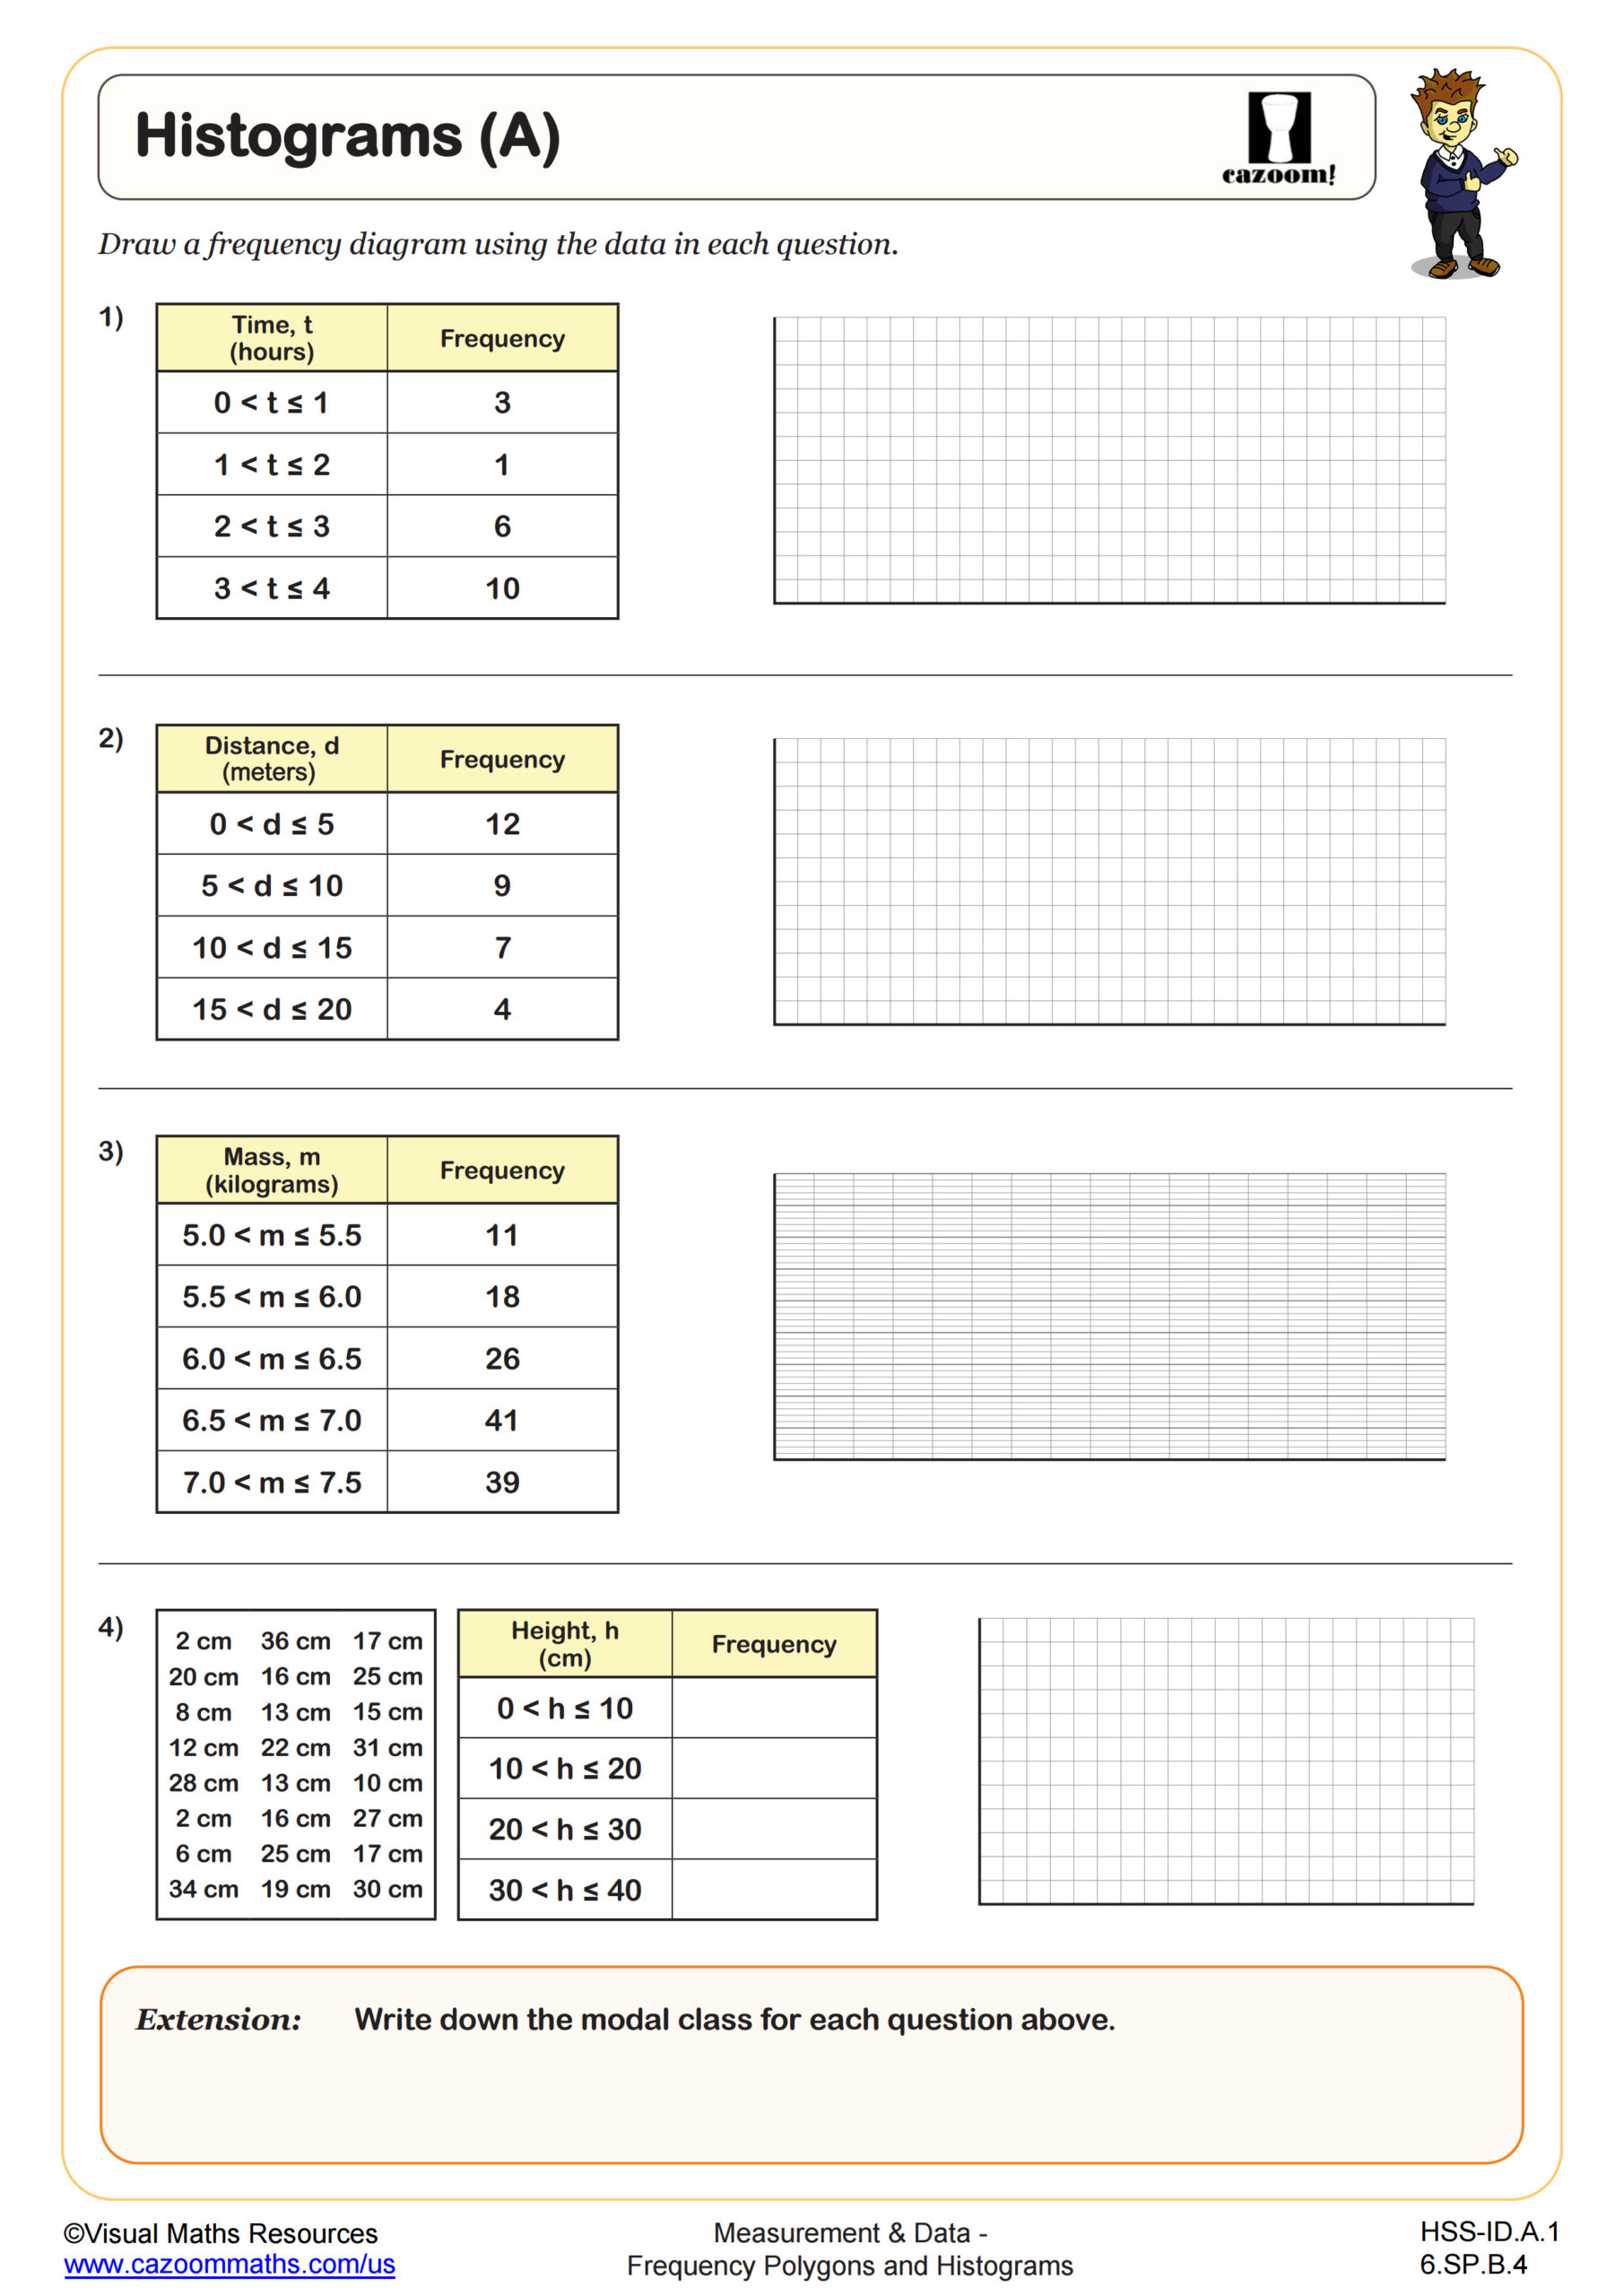
Histograms (A)
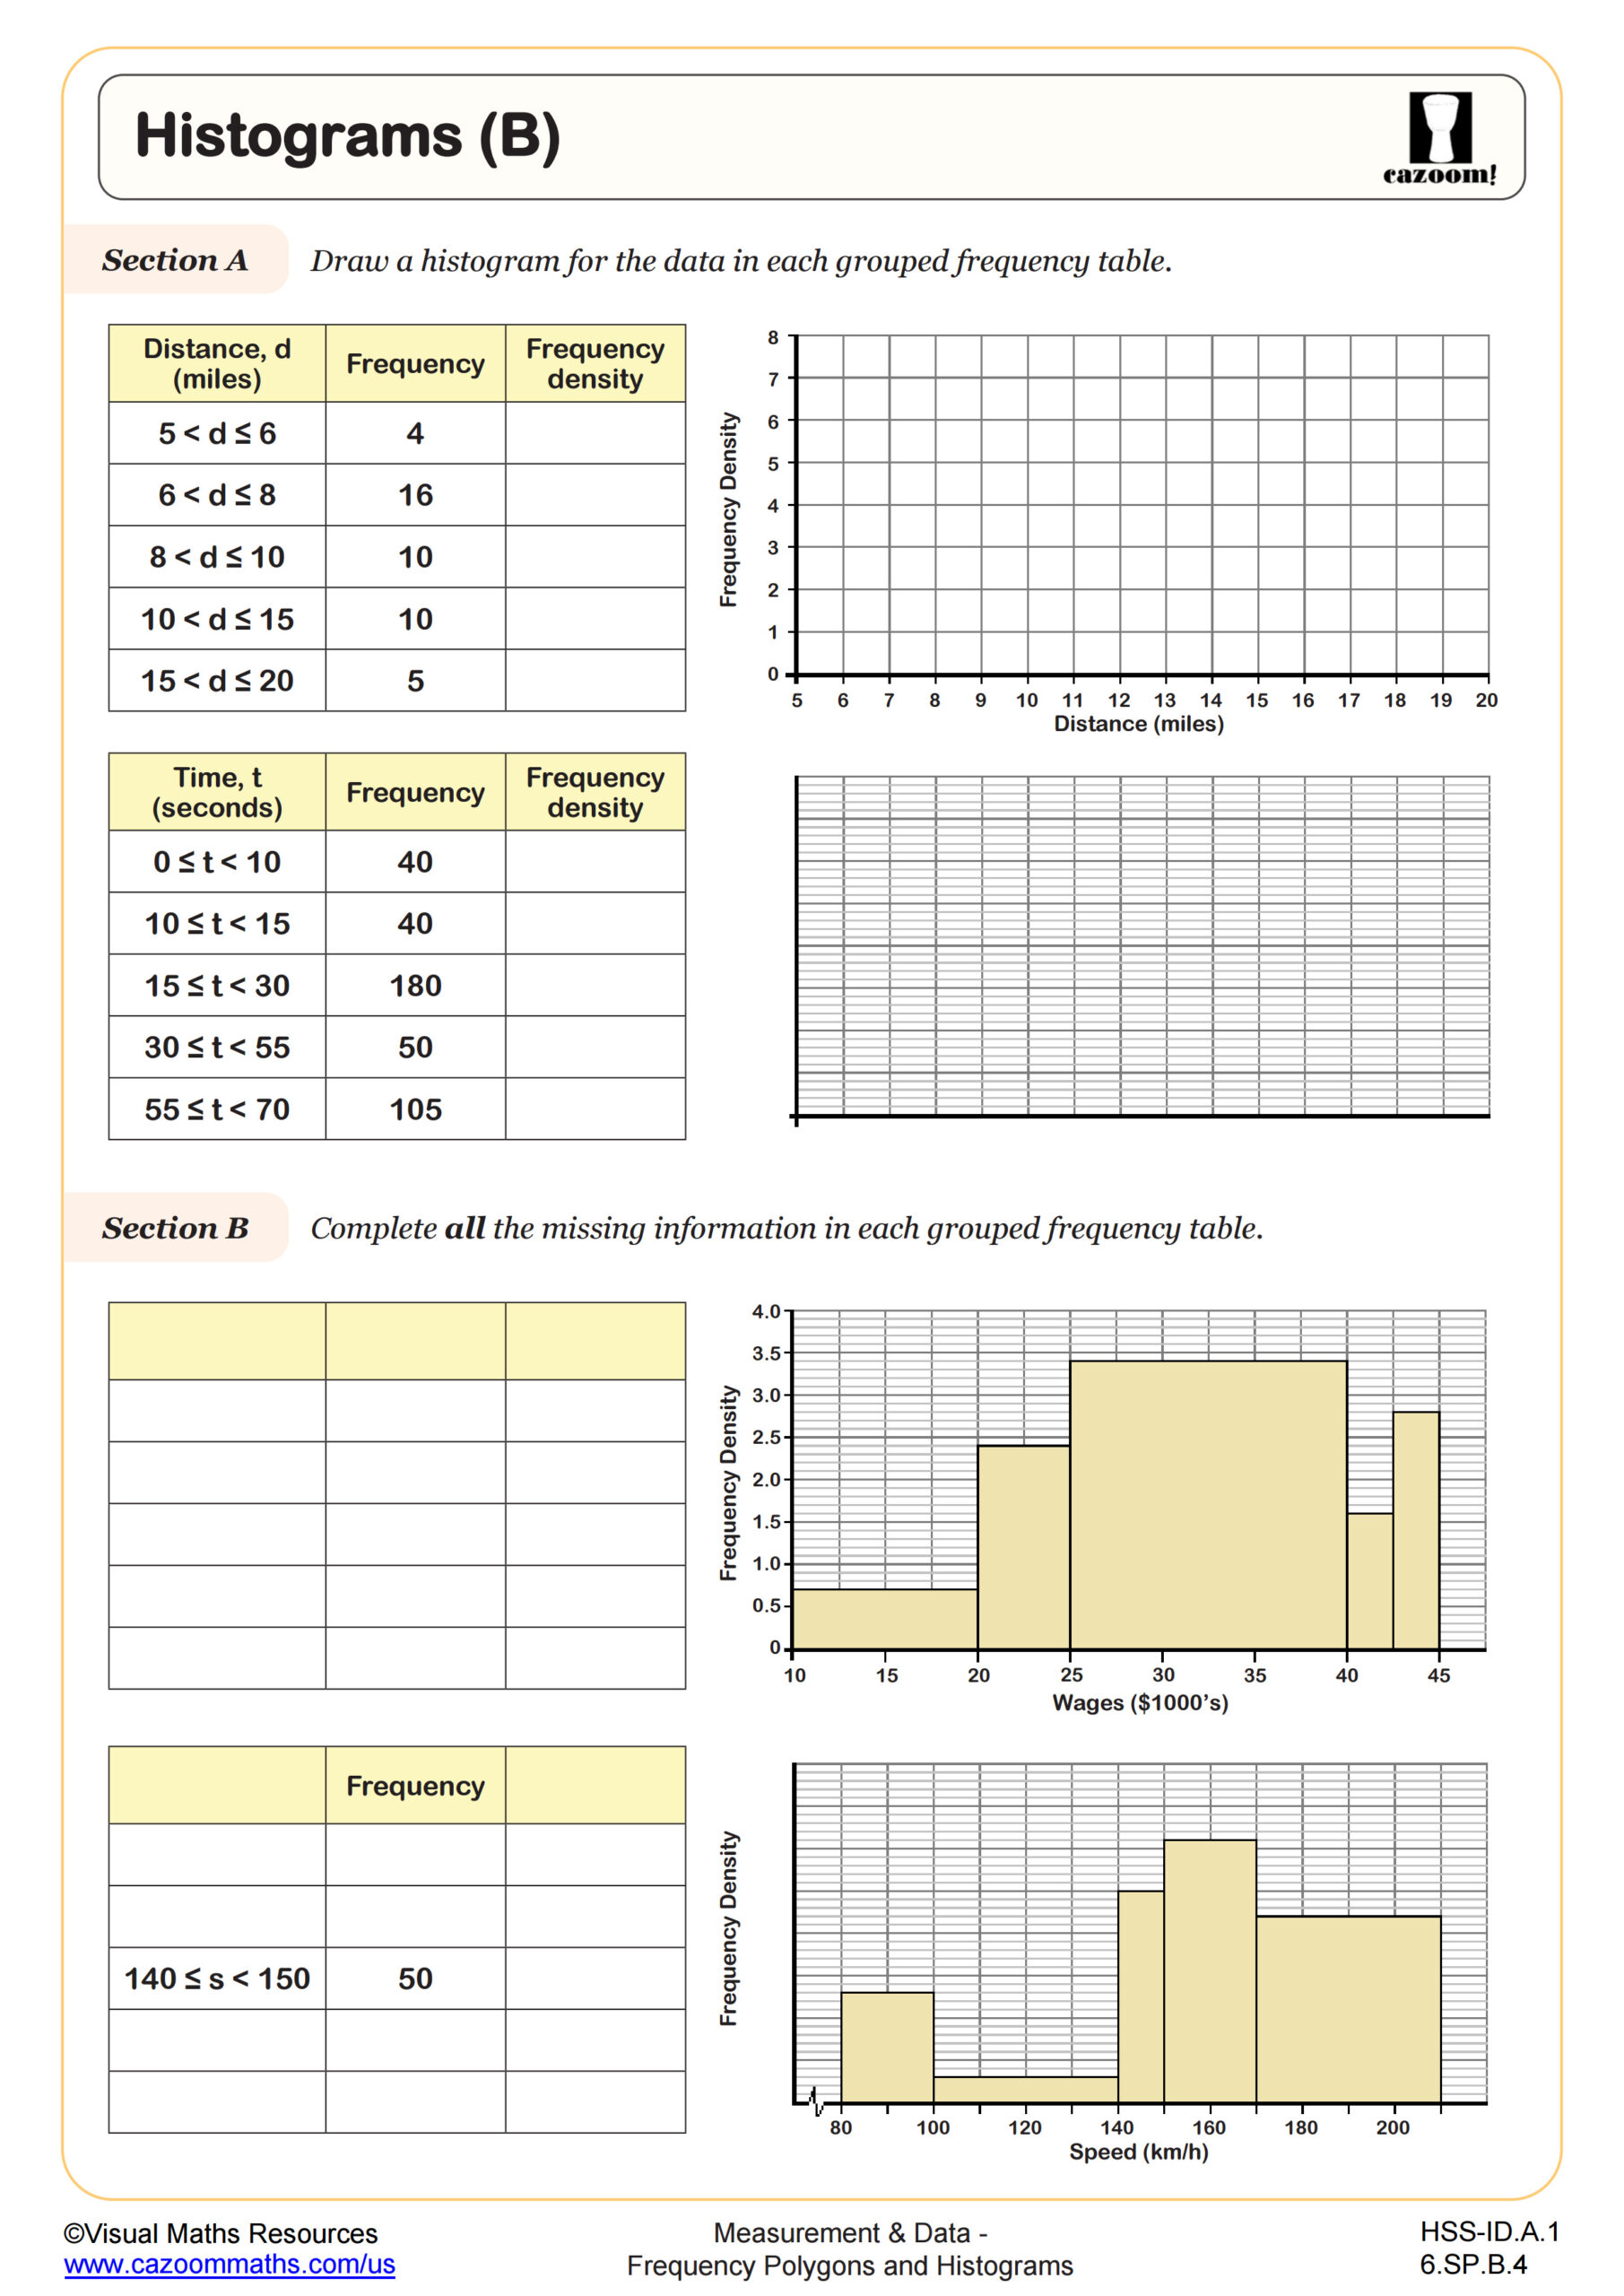
Histograms (B)
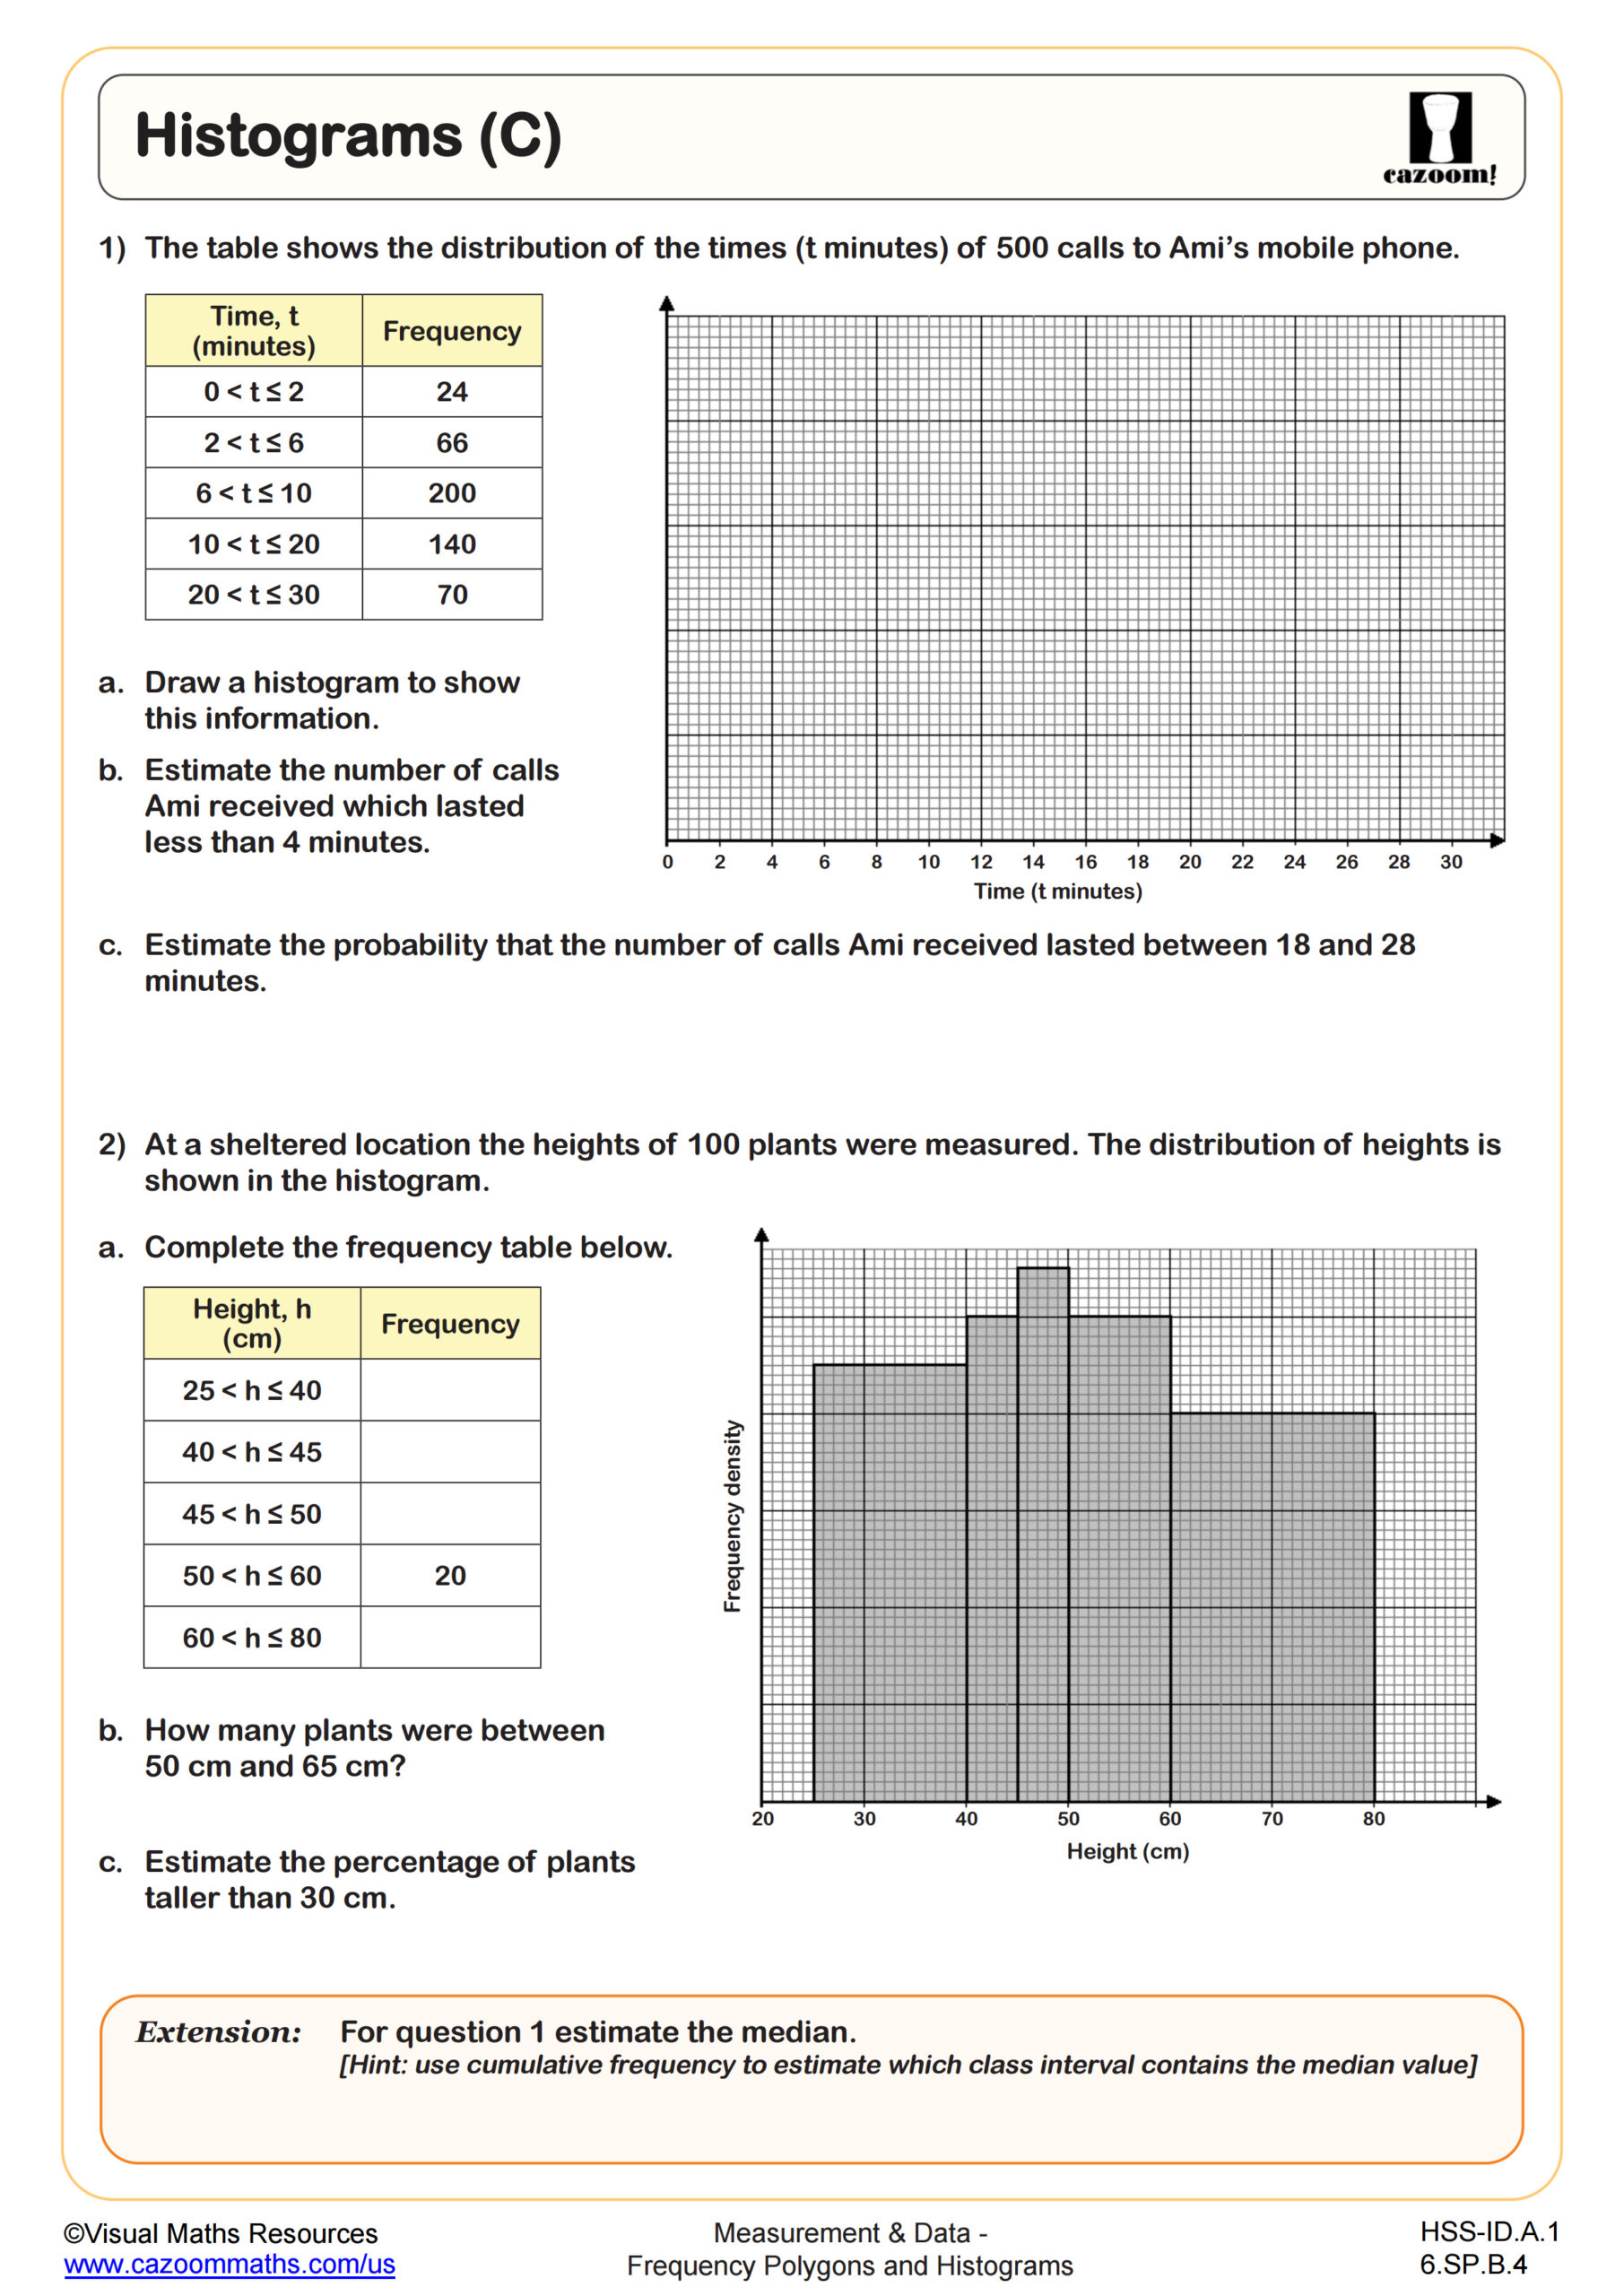
Histograms (C)
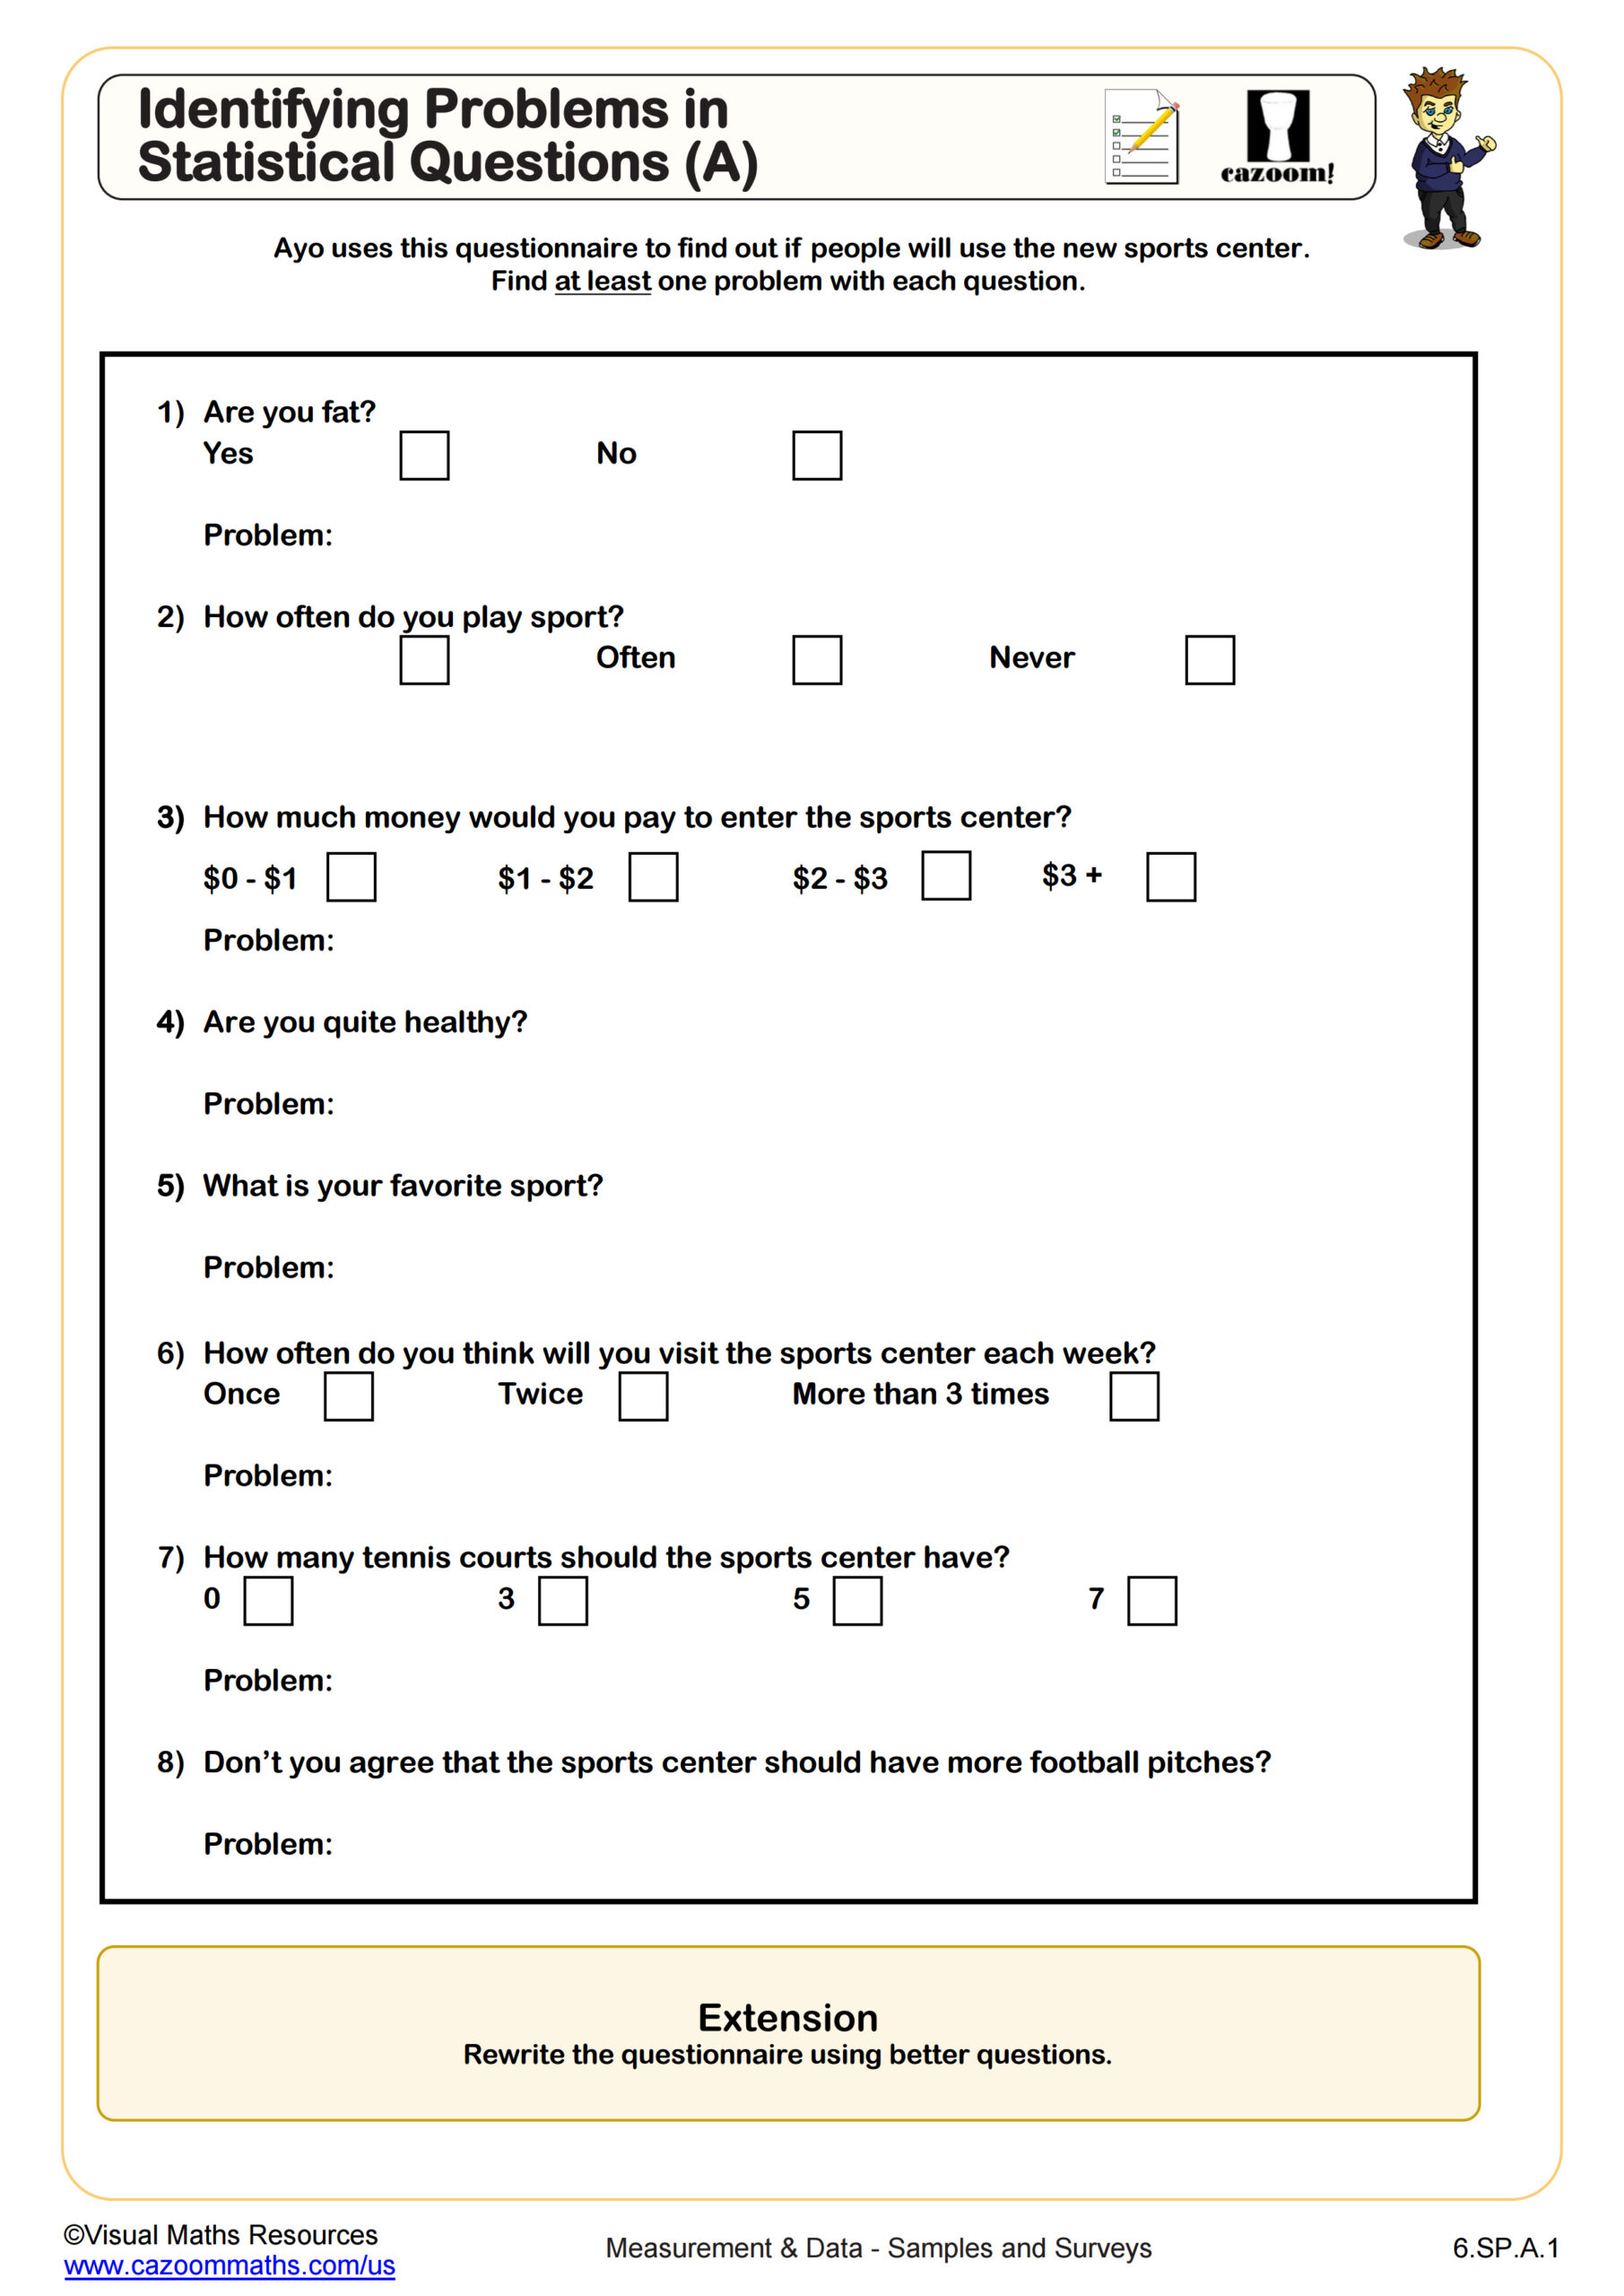
Identifying Problems in Statistical Questions (A)
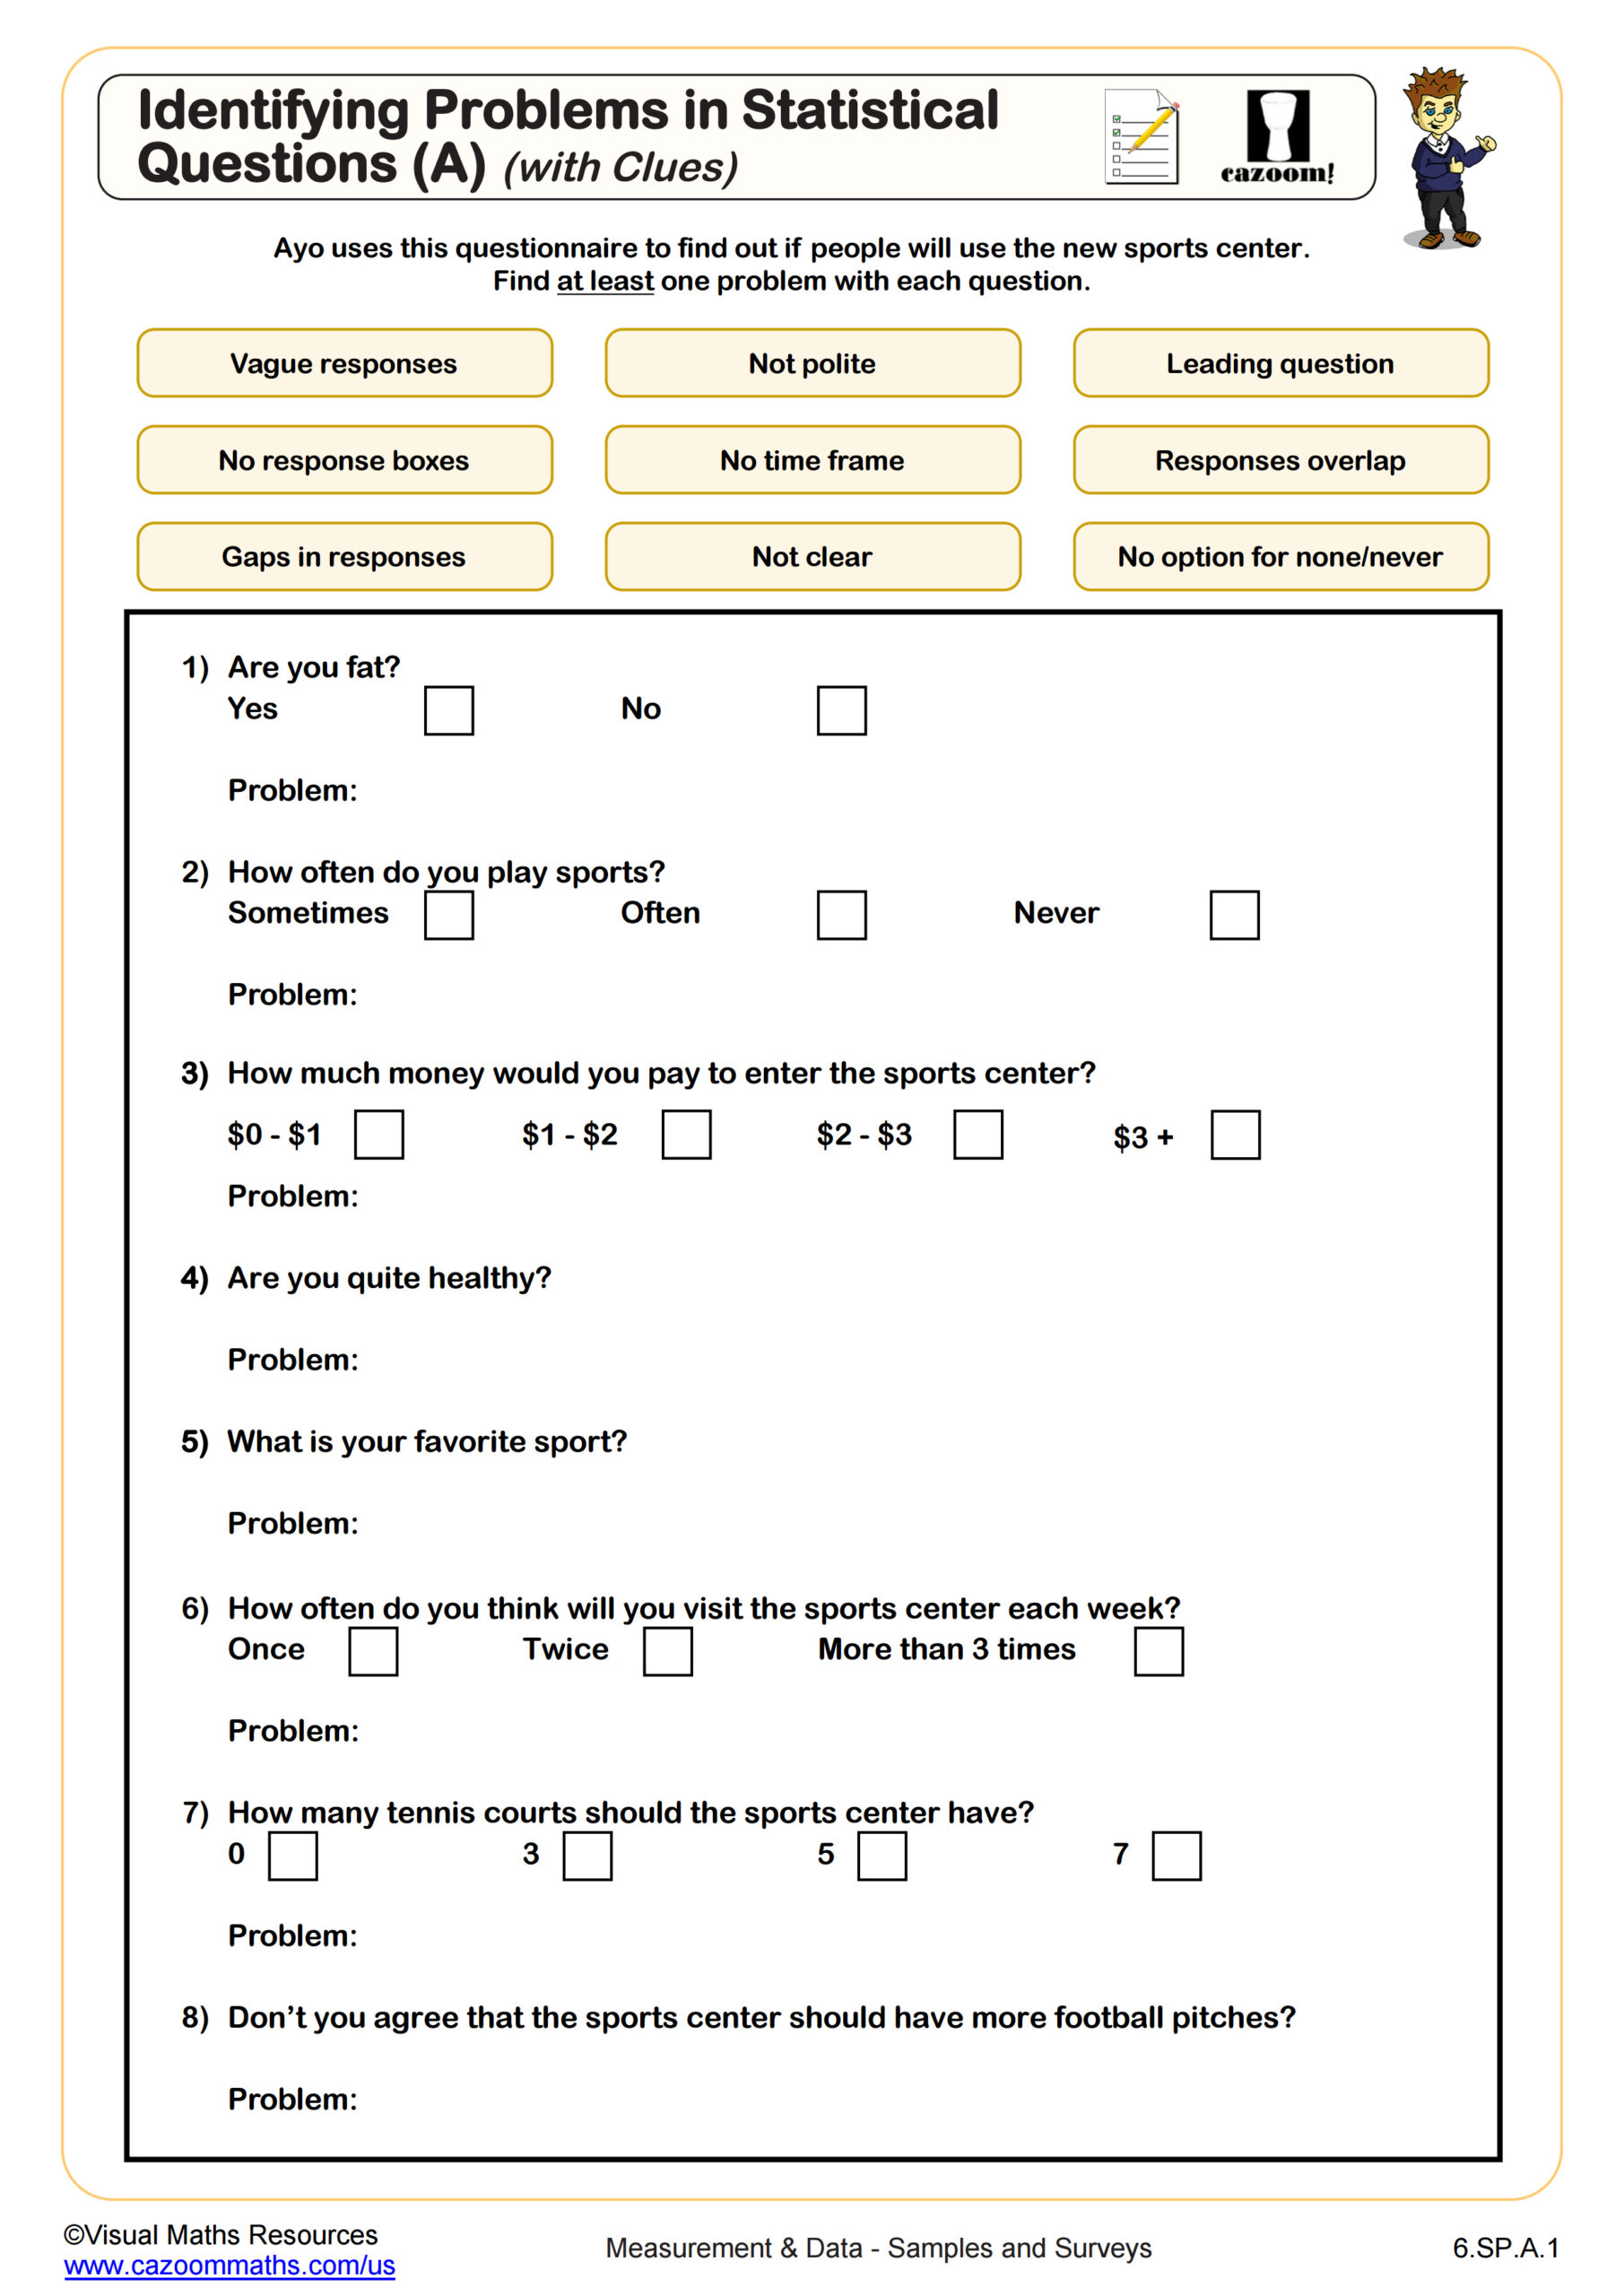
Identifying Problems in Statistical Questions (A) (With Clues)
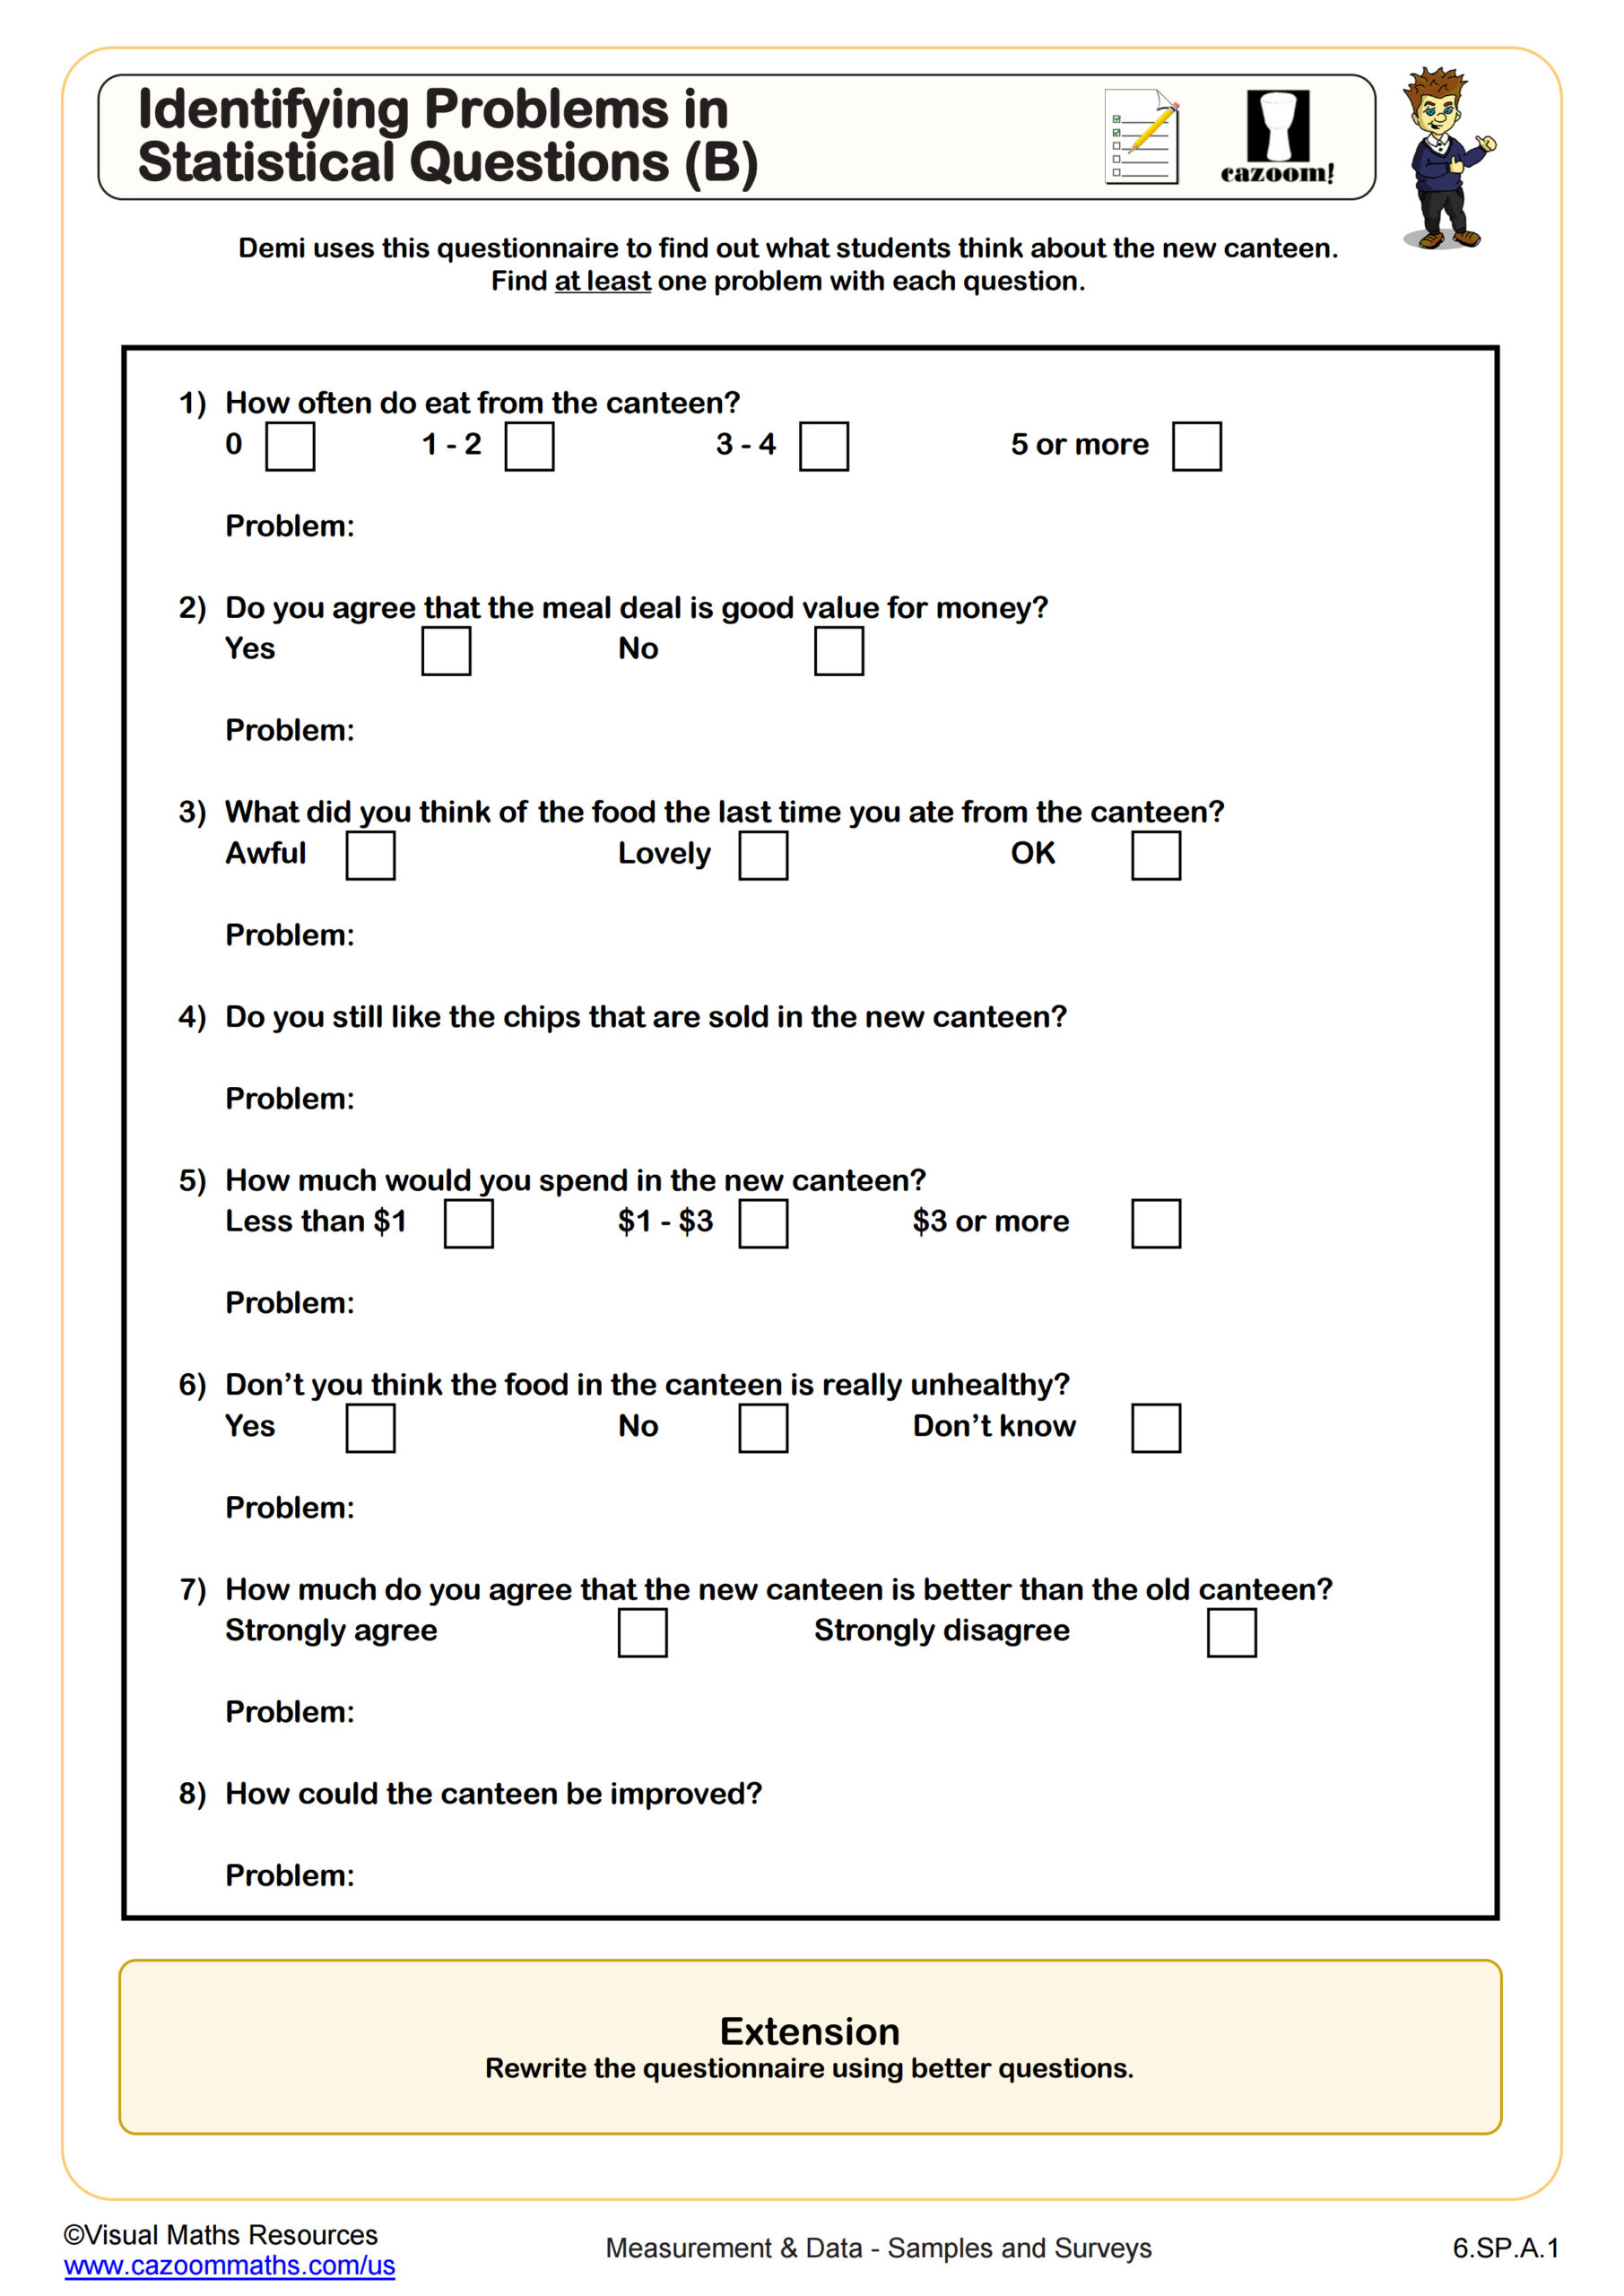
Identifying Problems in Statistical Questions (B)
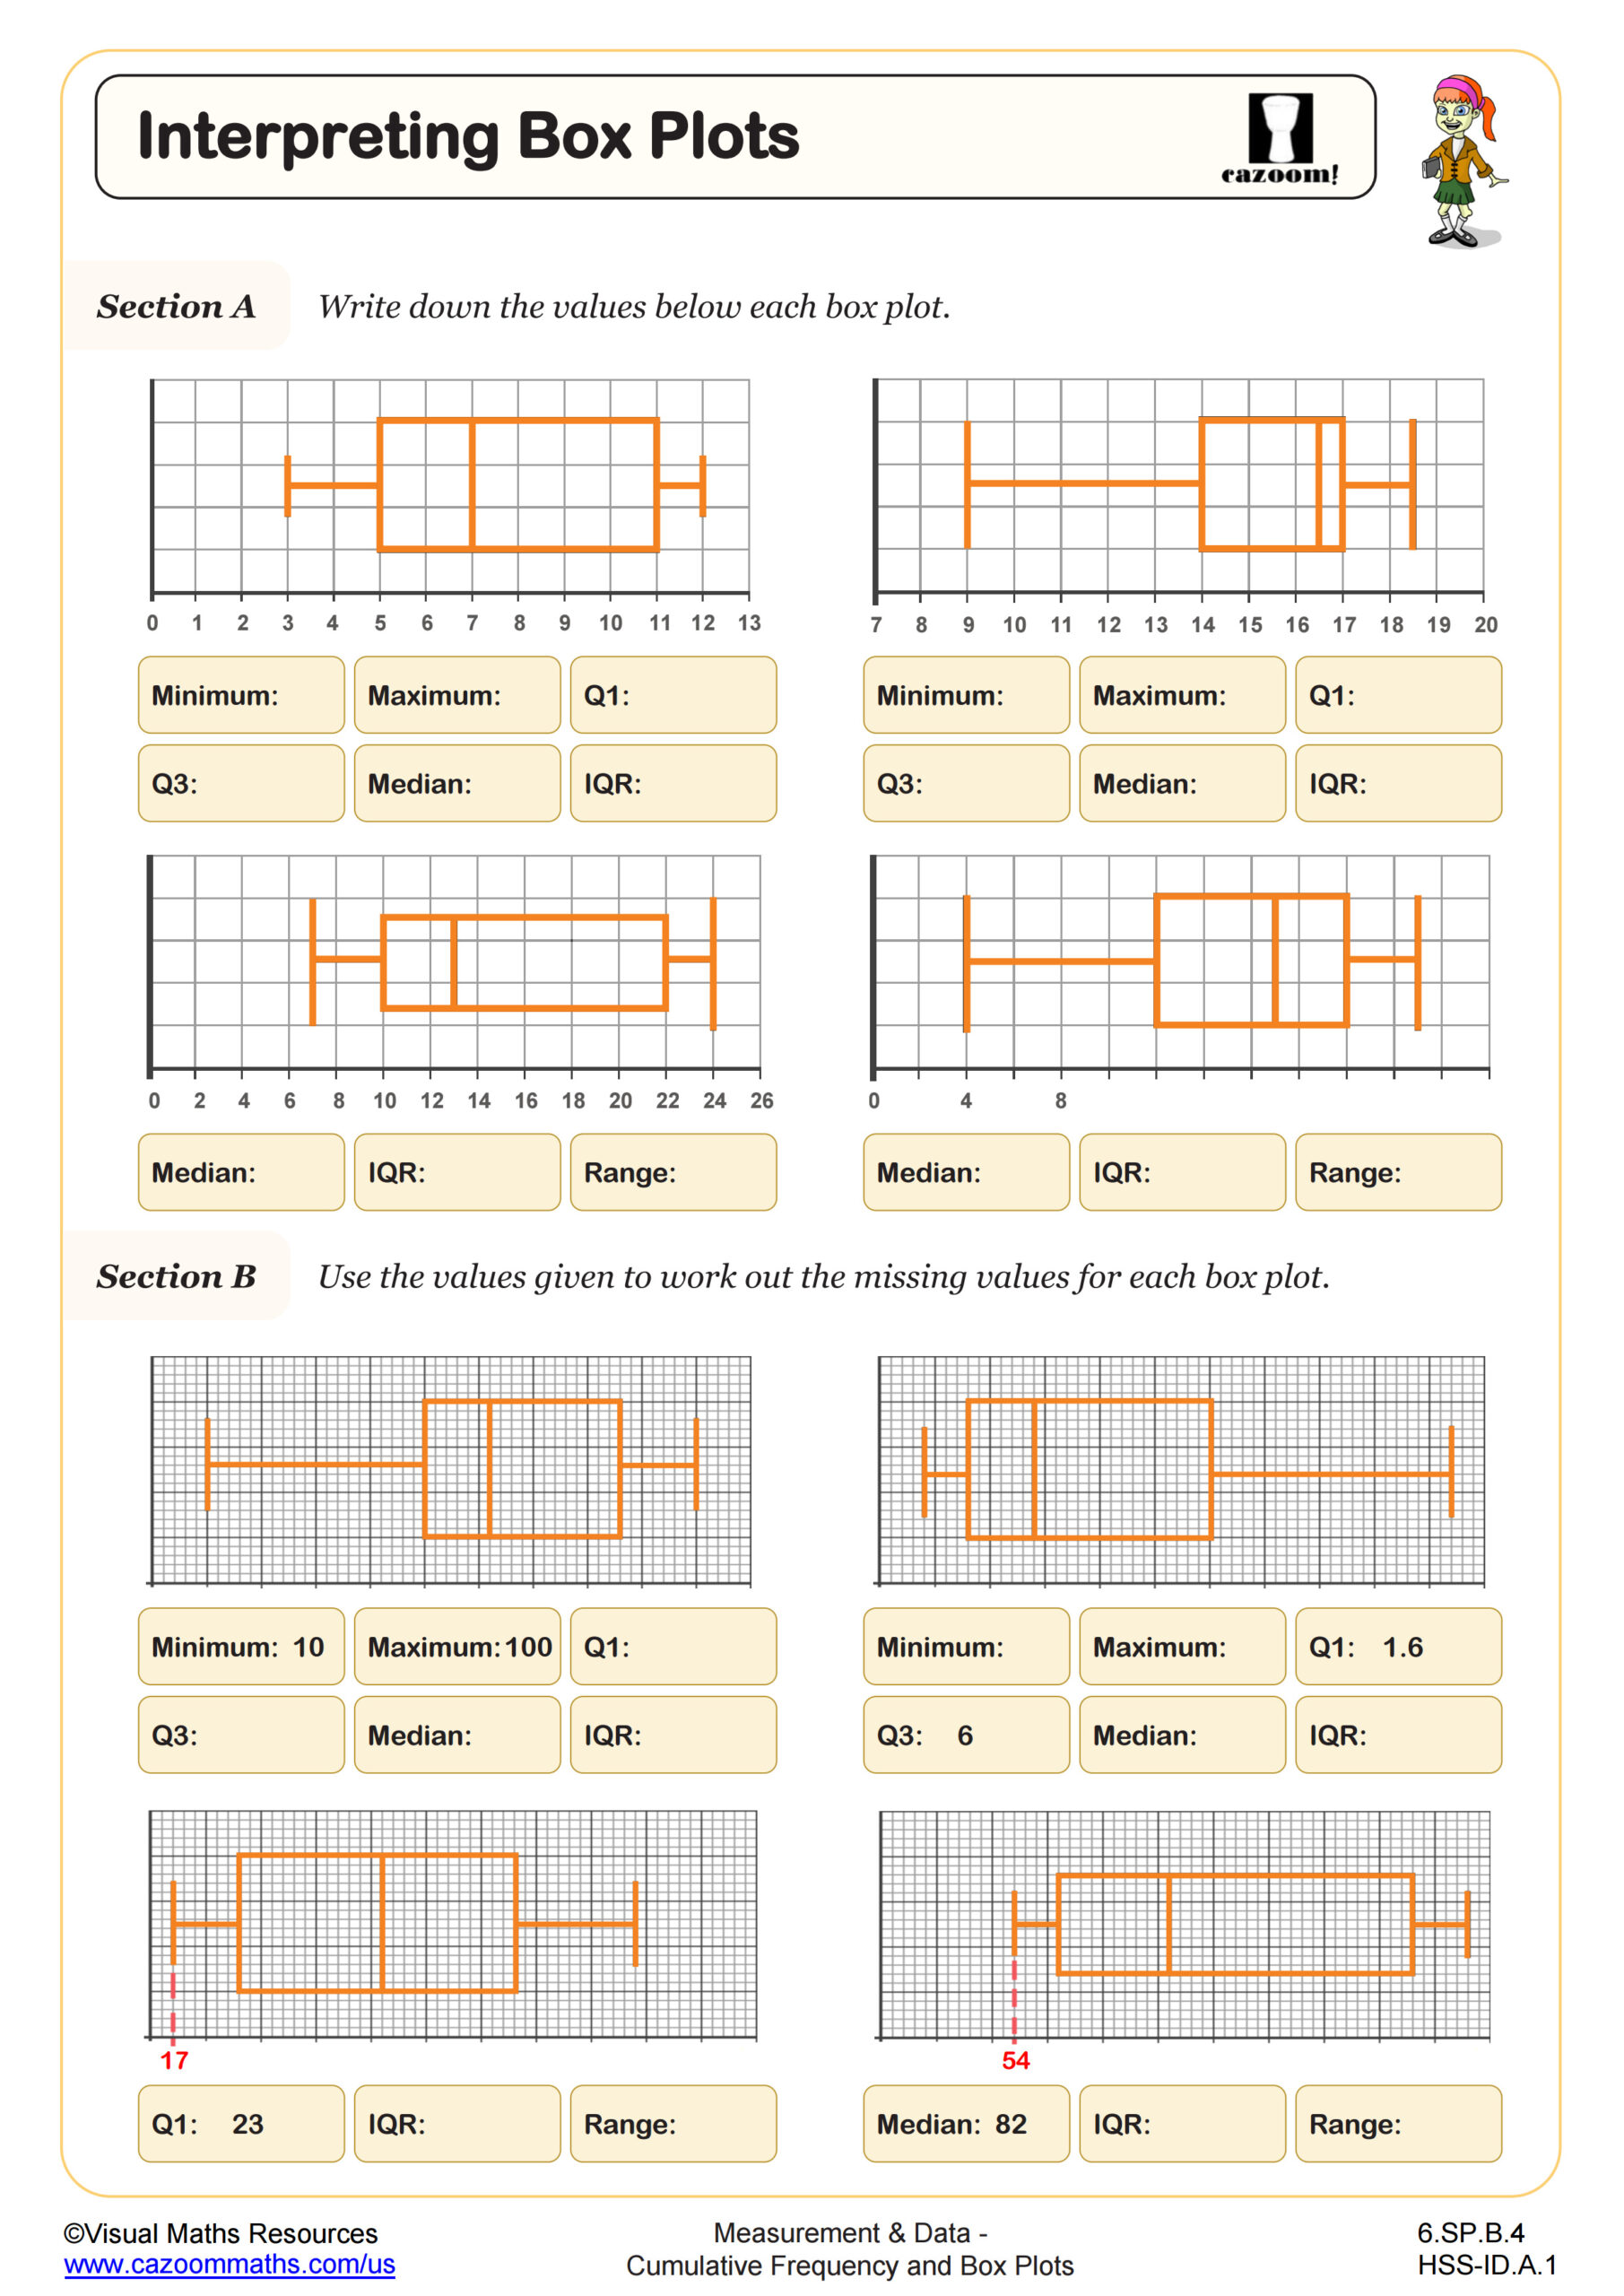
Interpreting Boxplots
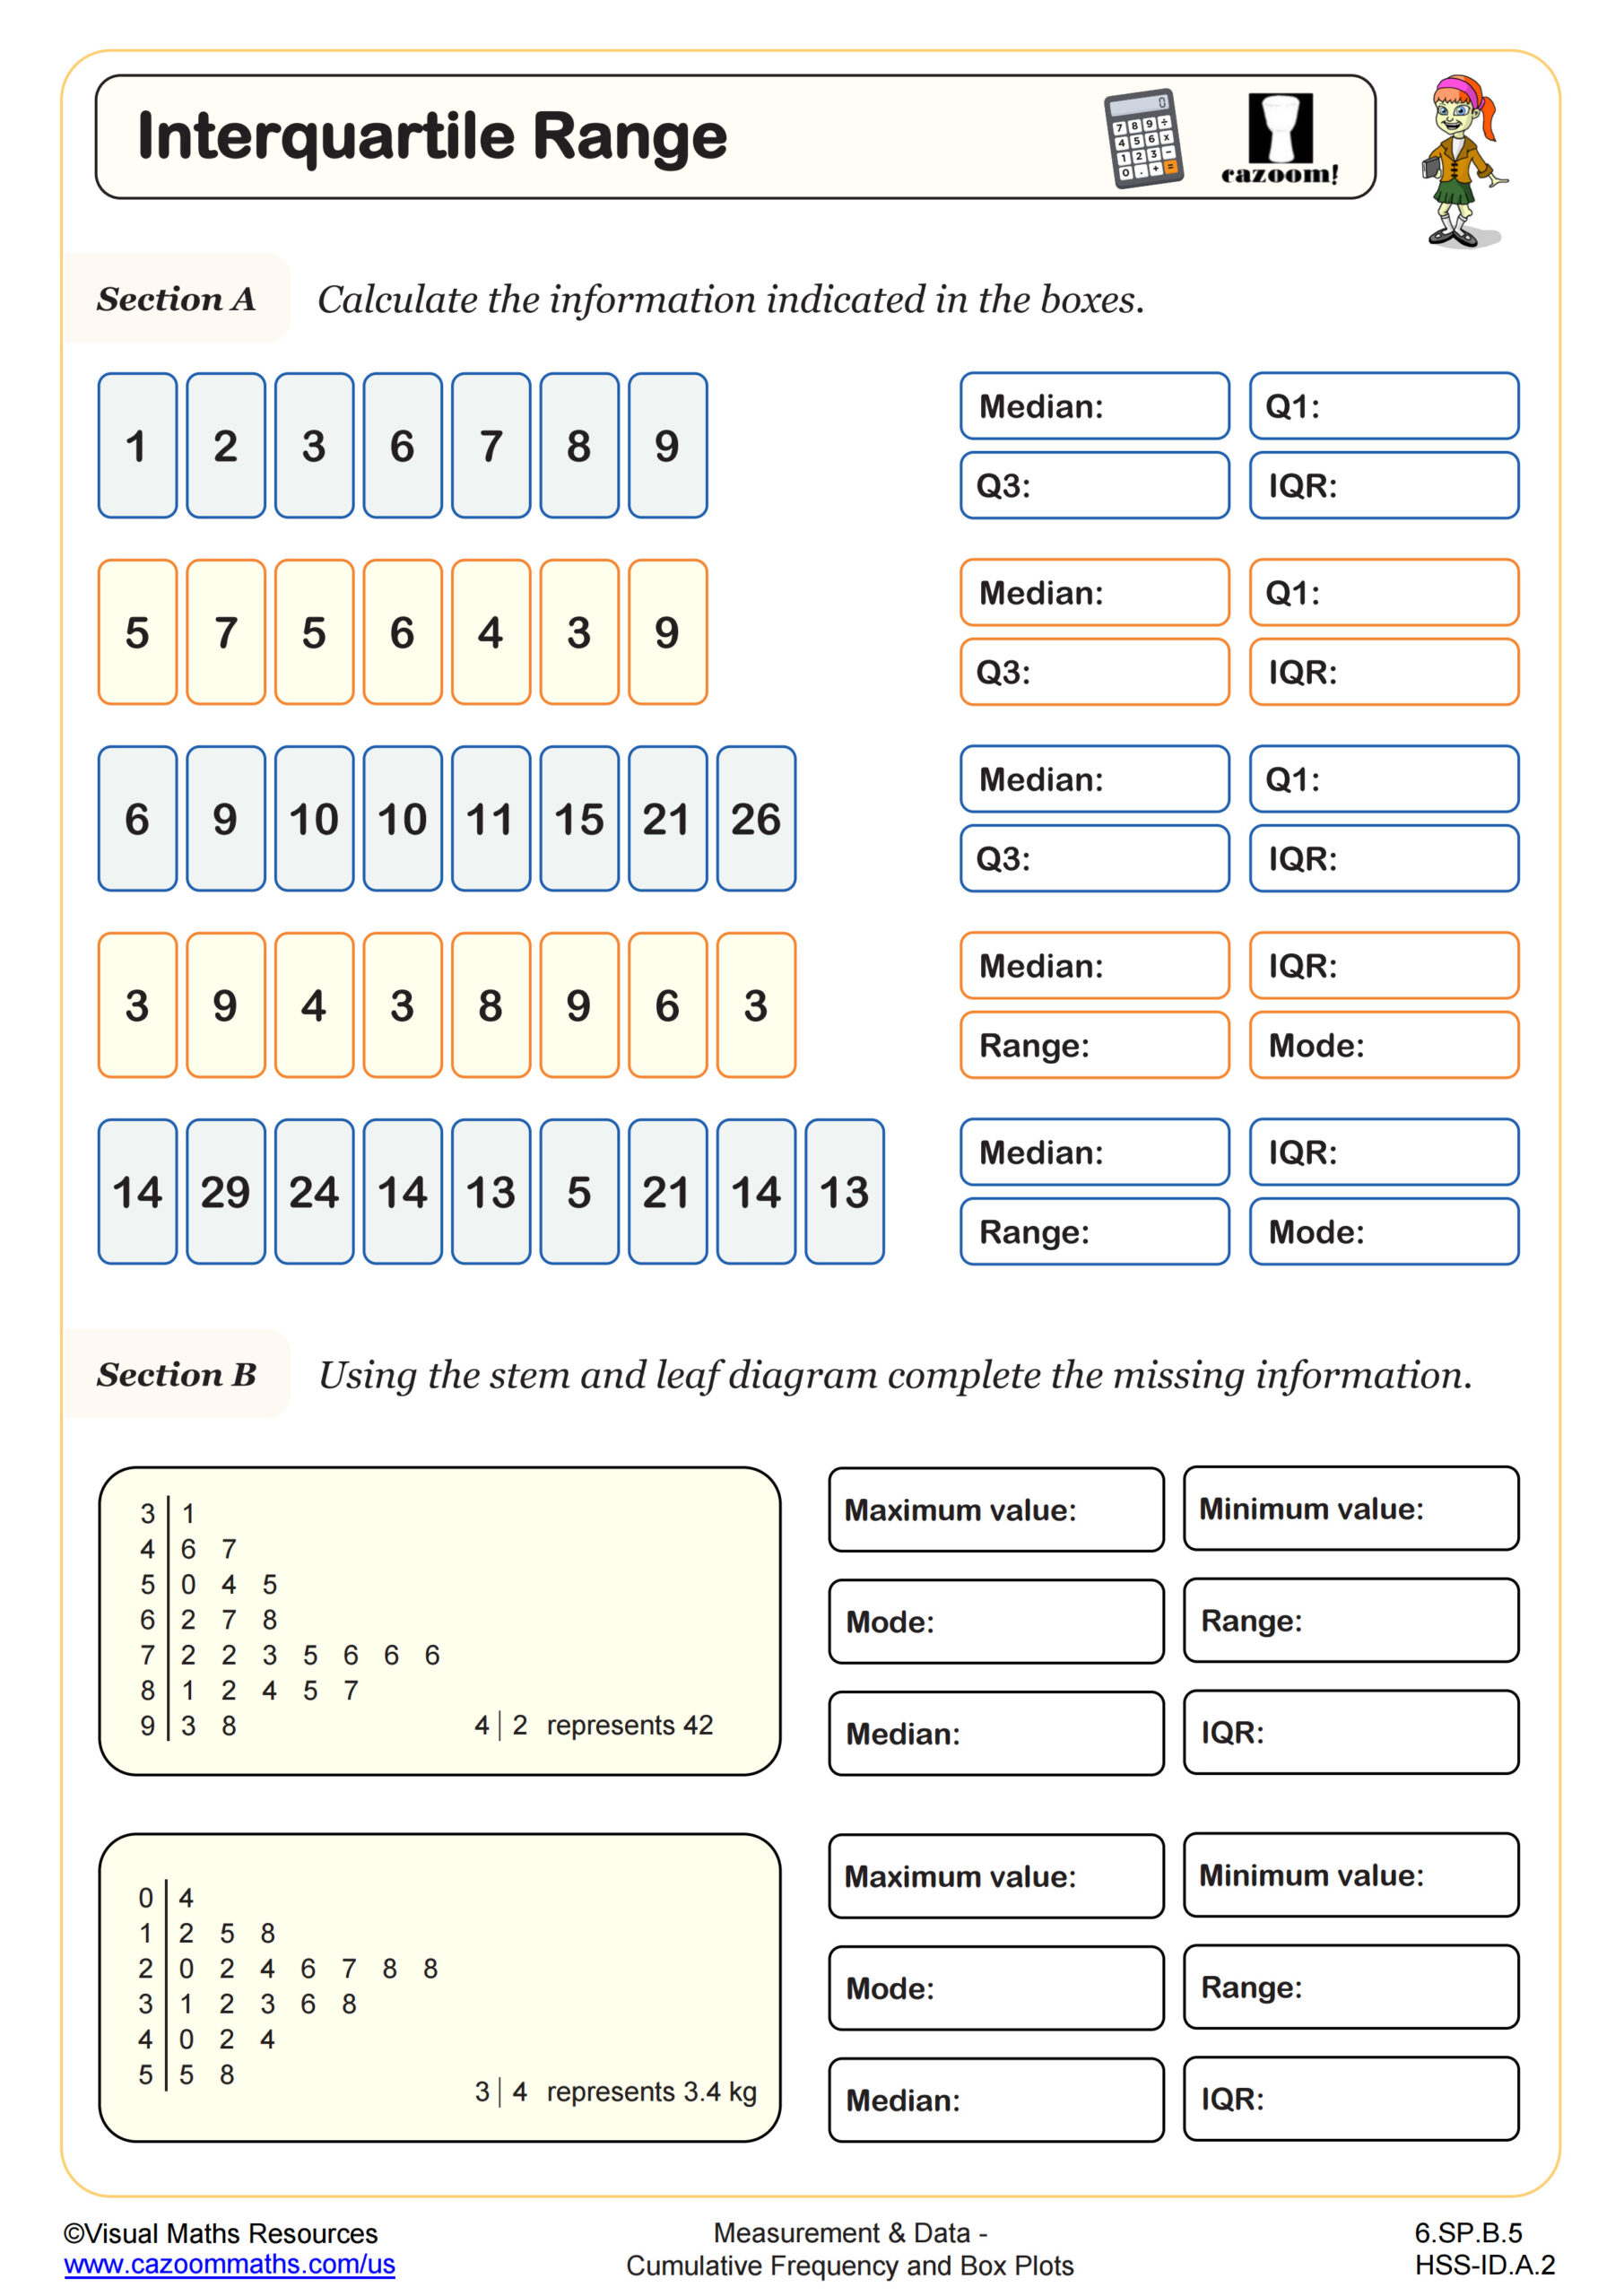
Interquartile Range
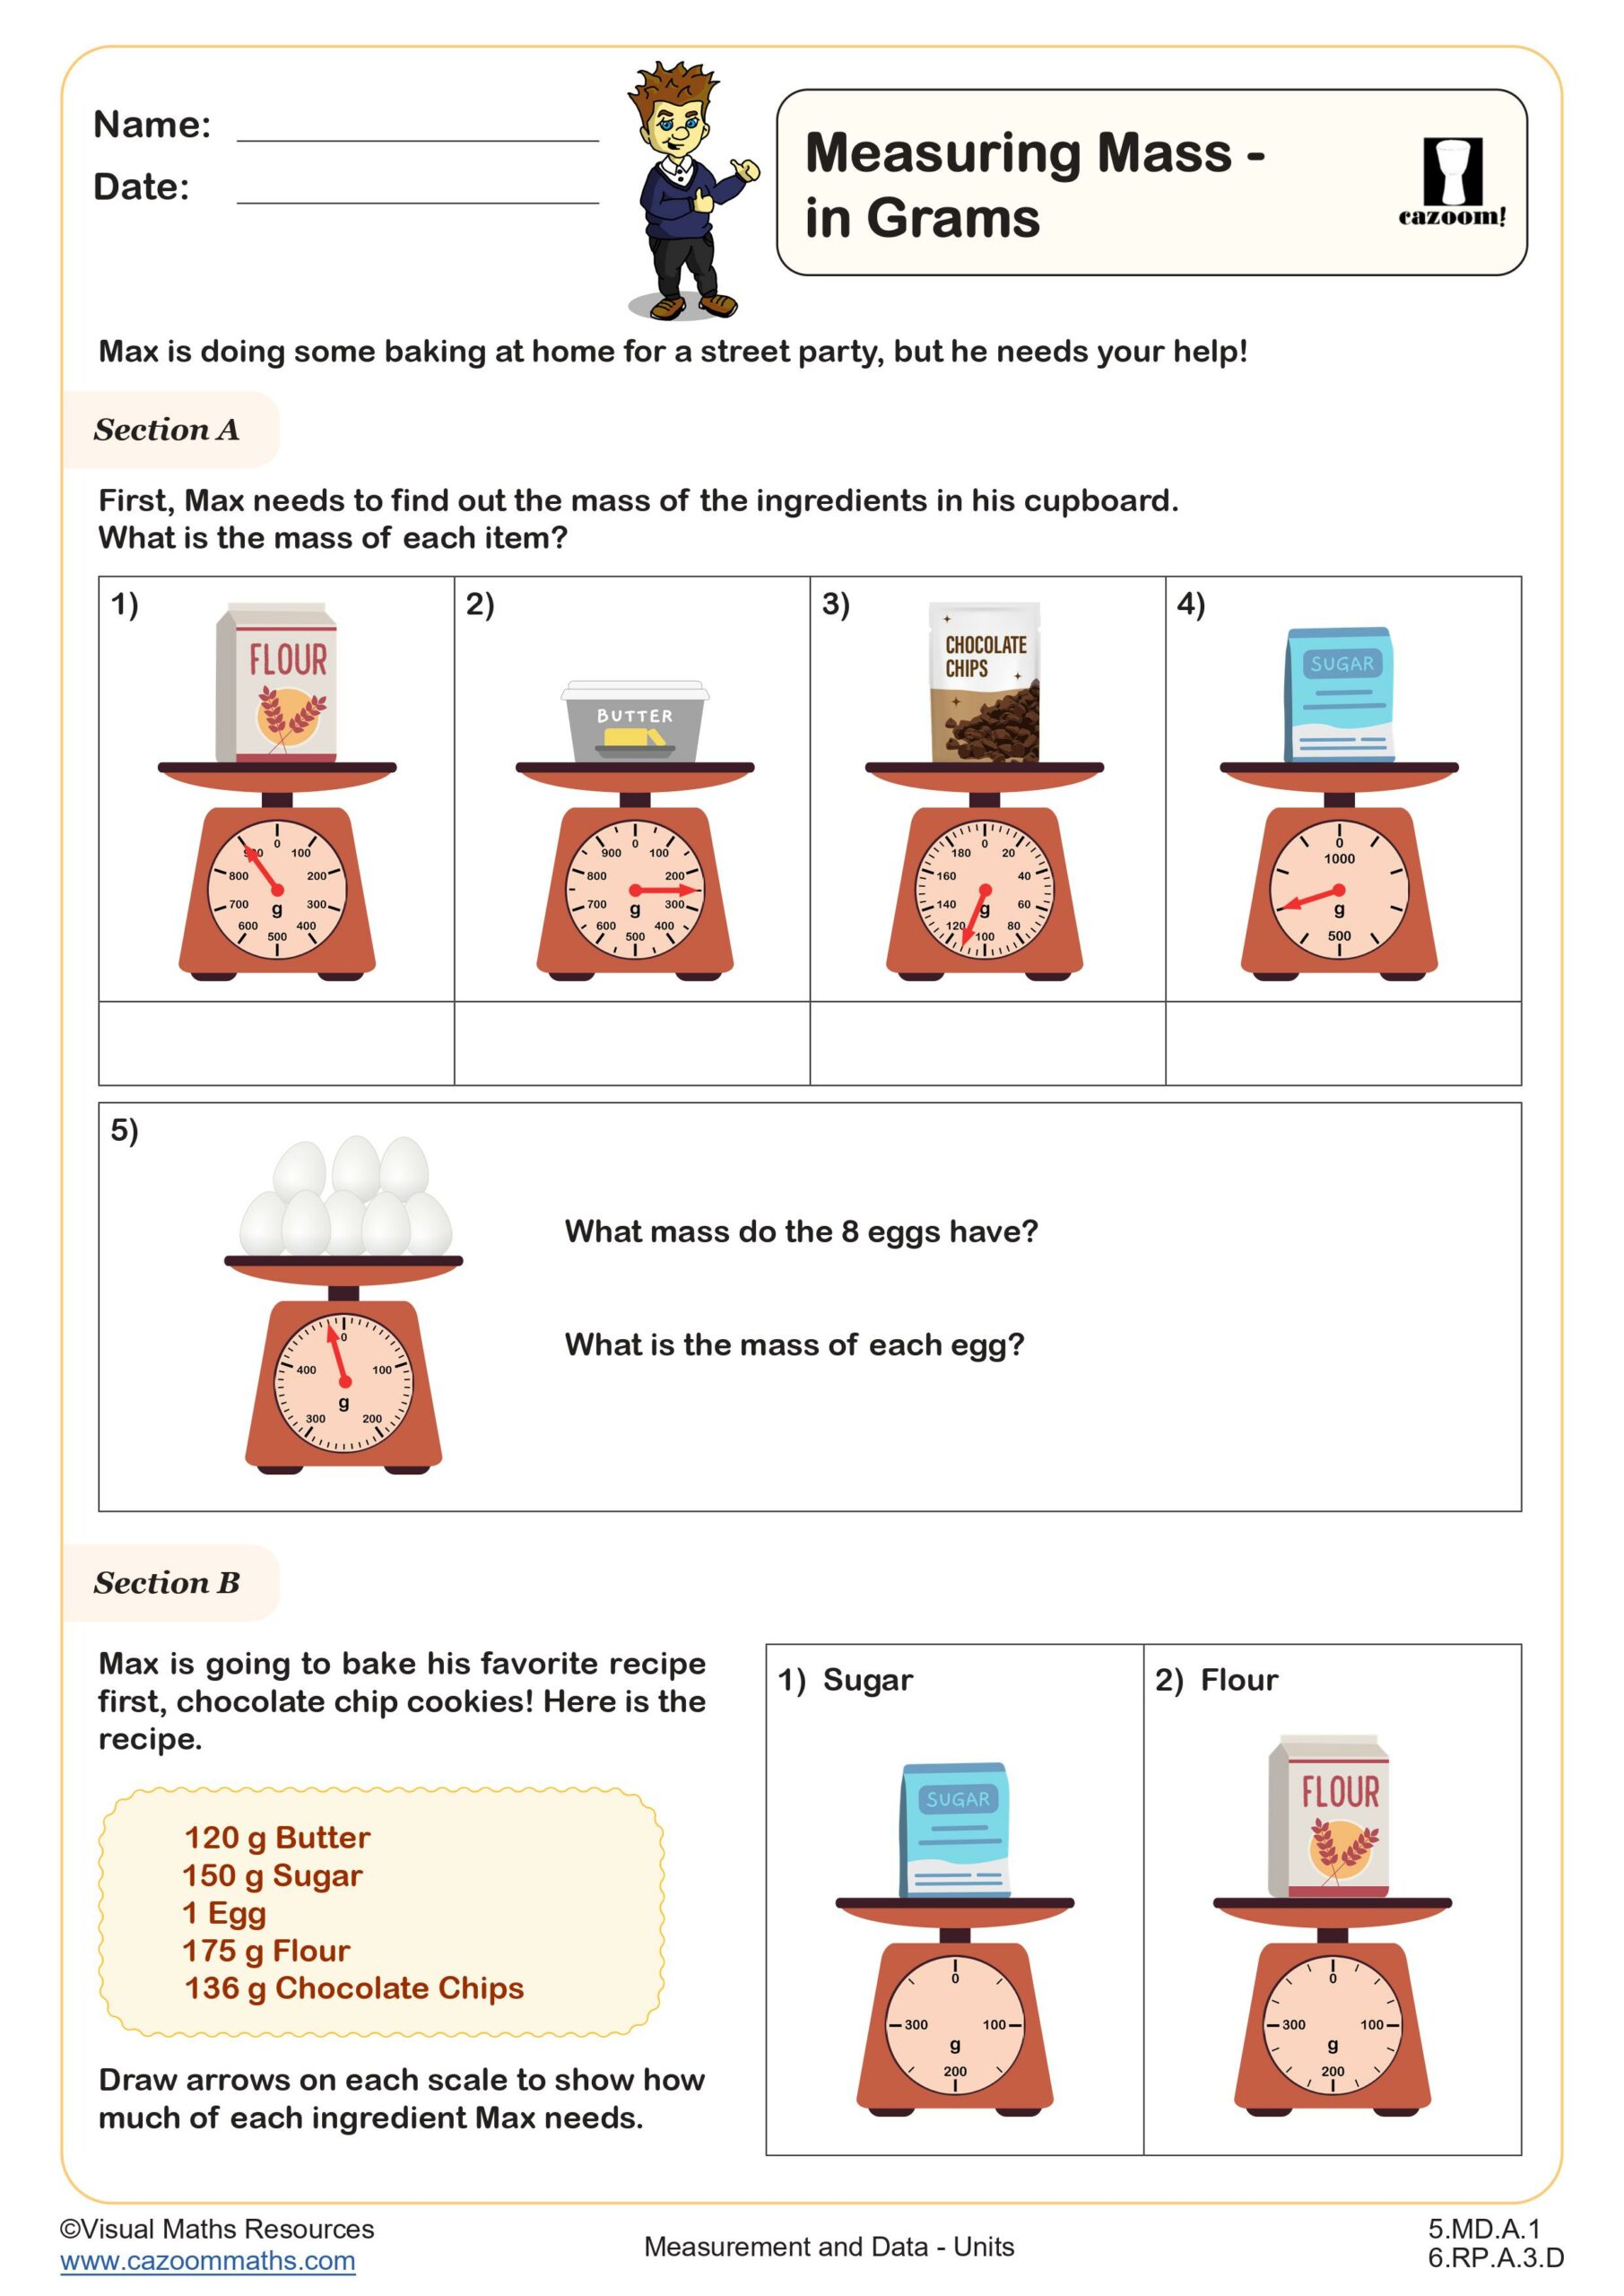
Measure Mass - in Grams
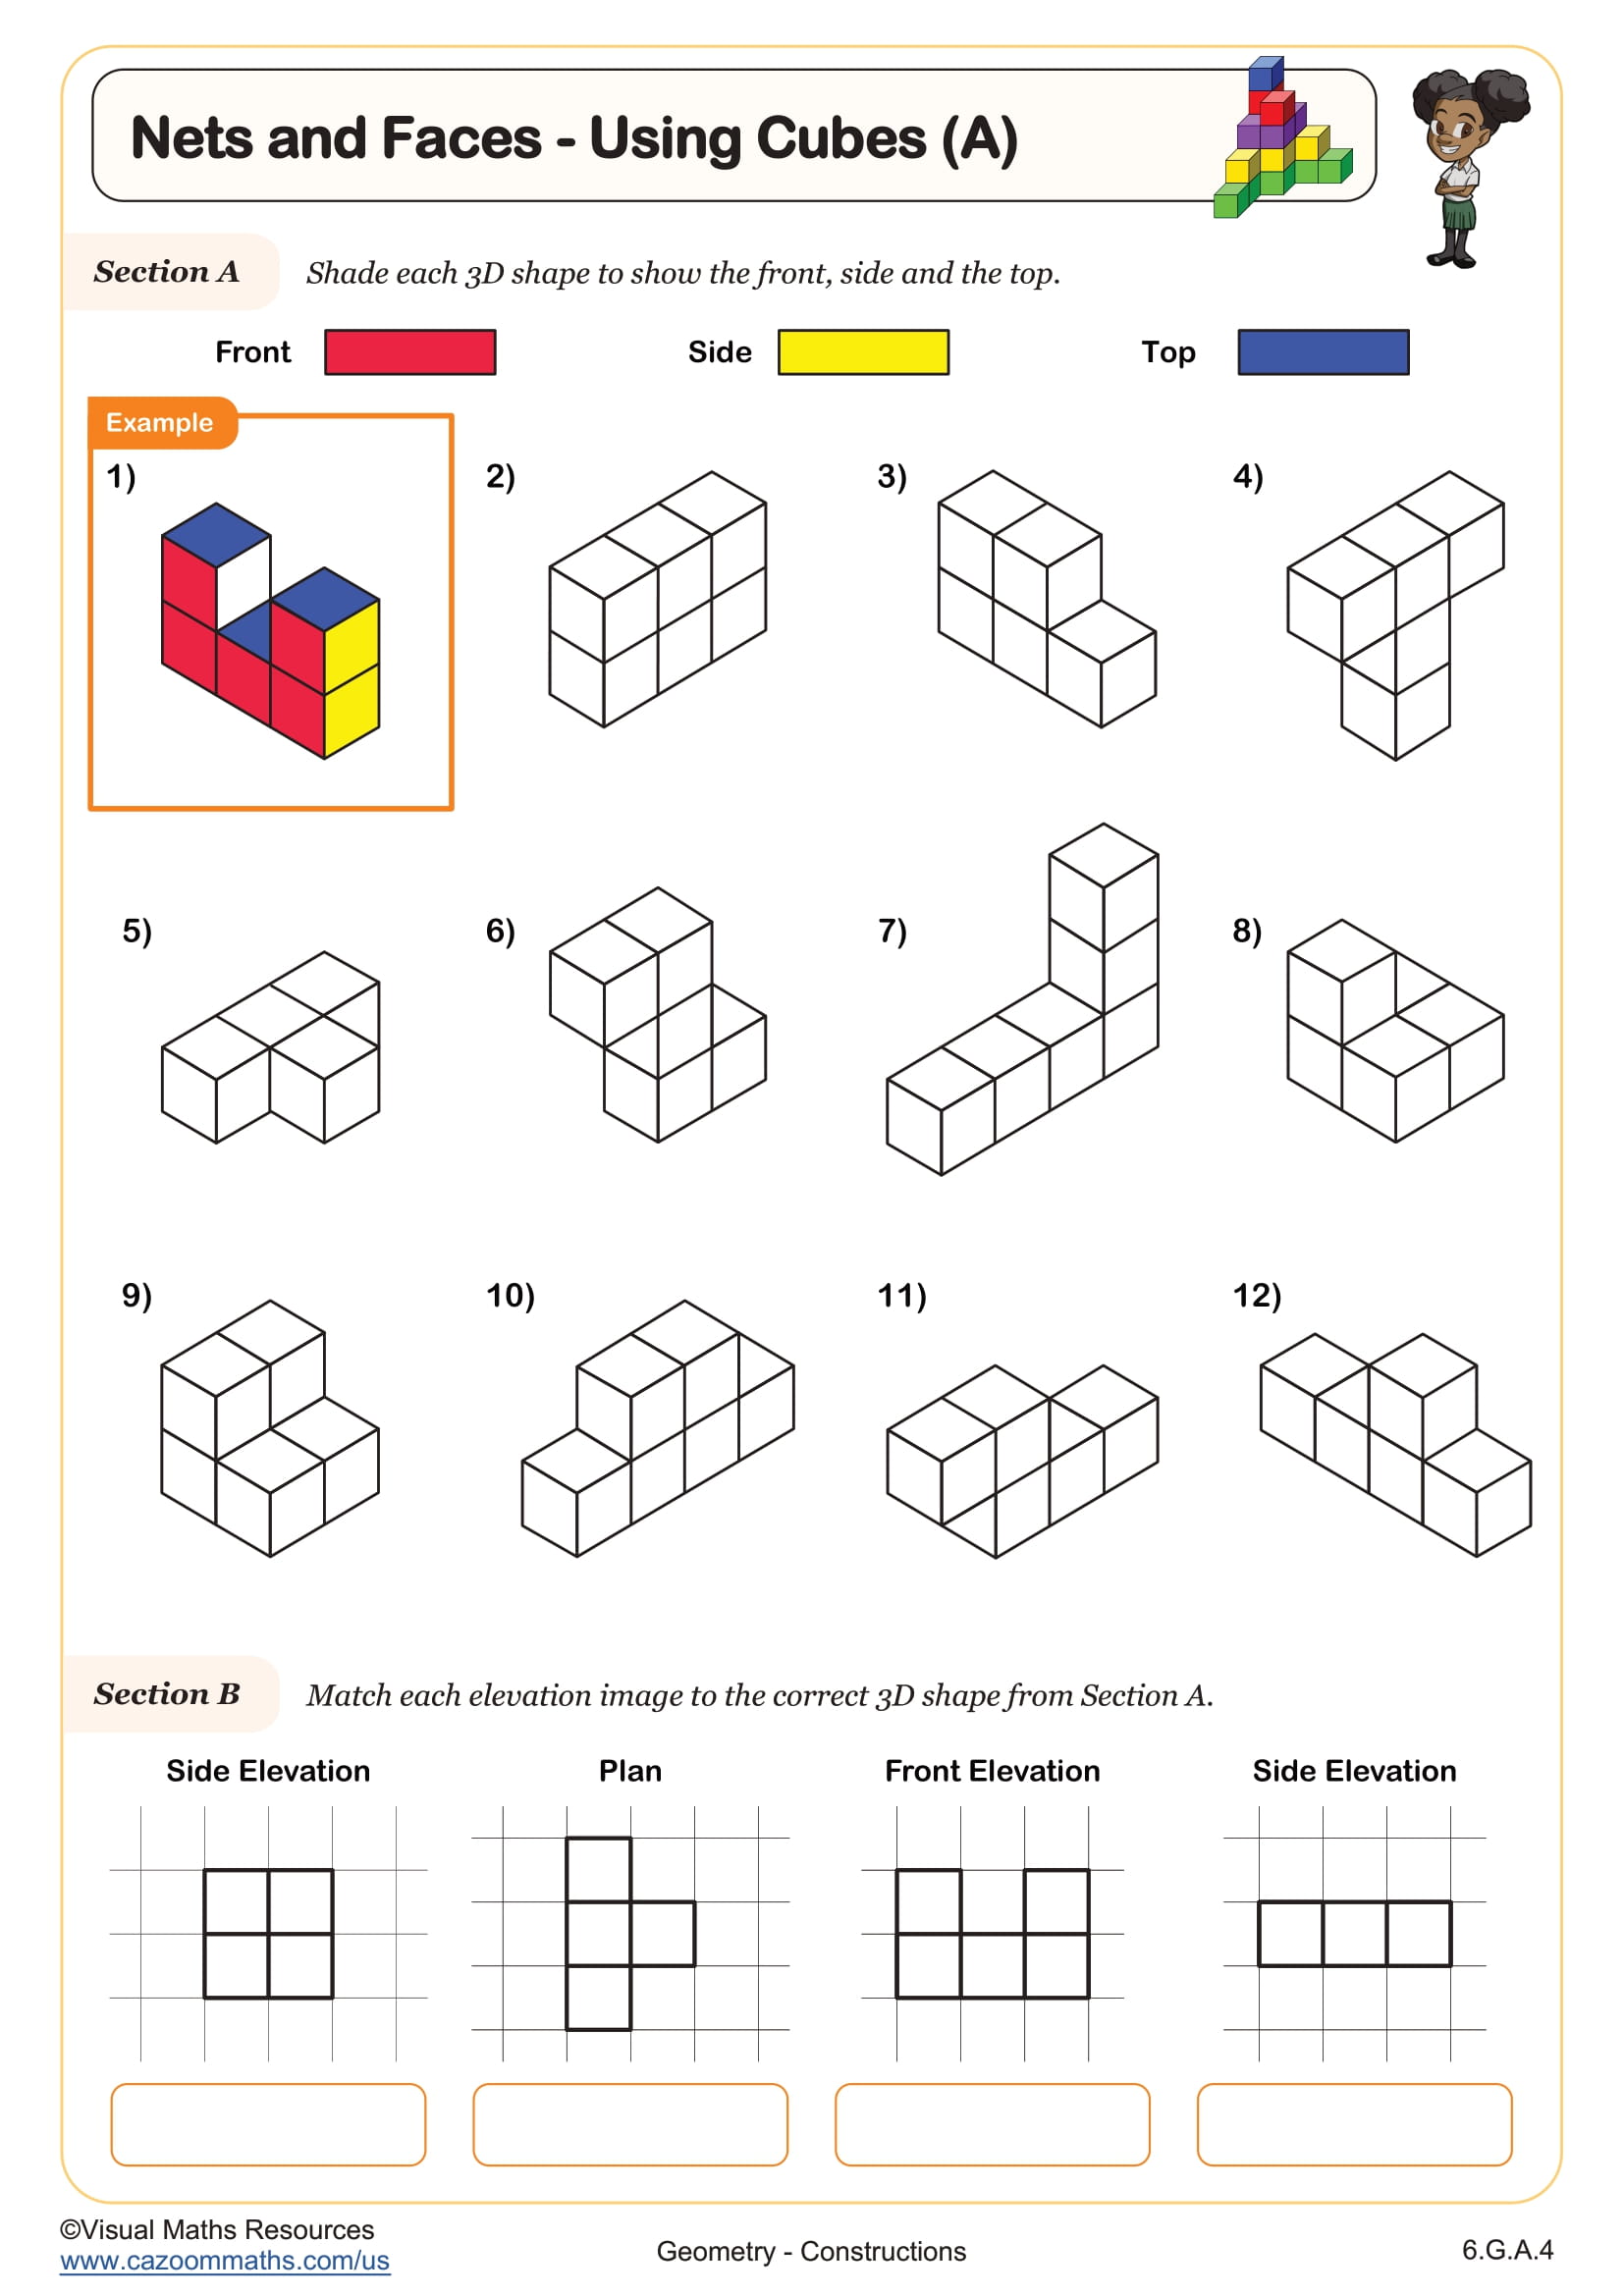
Nets and Faces - Using Cubes (A)
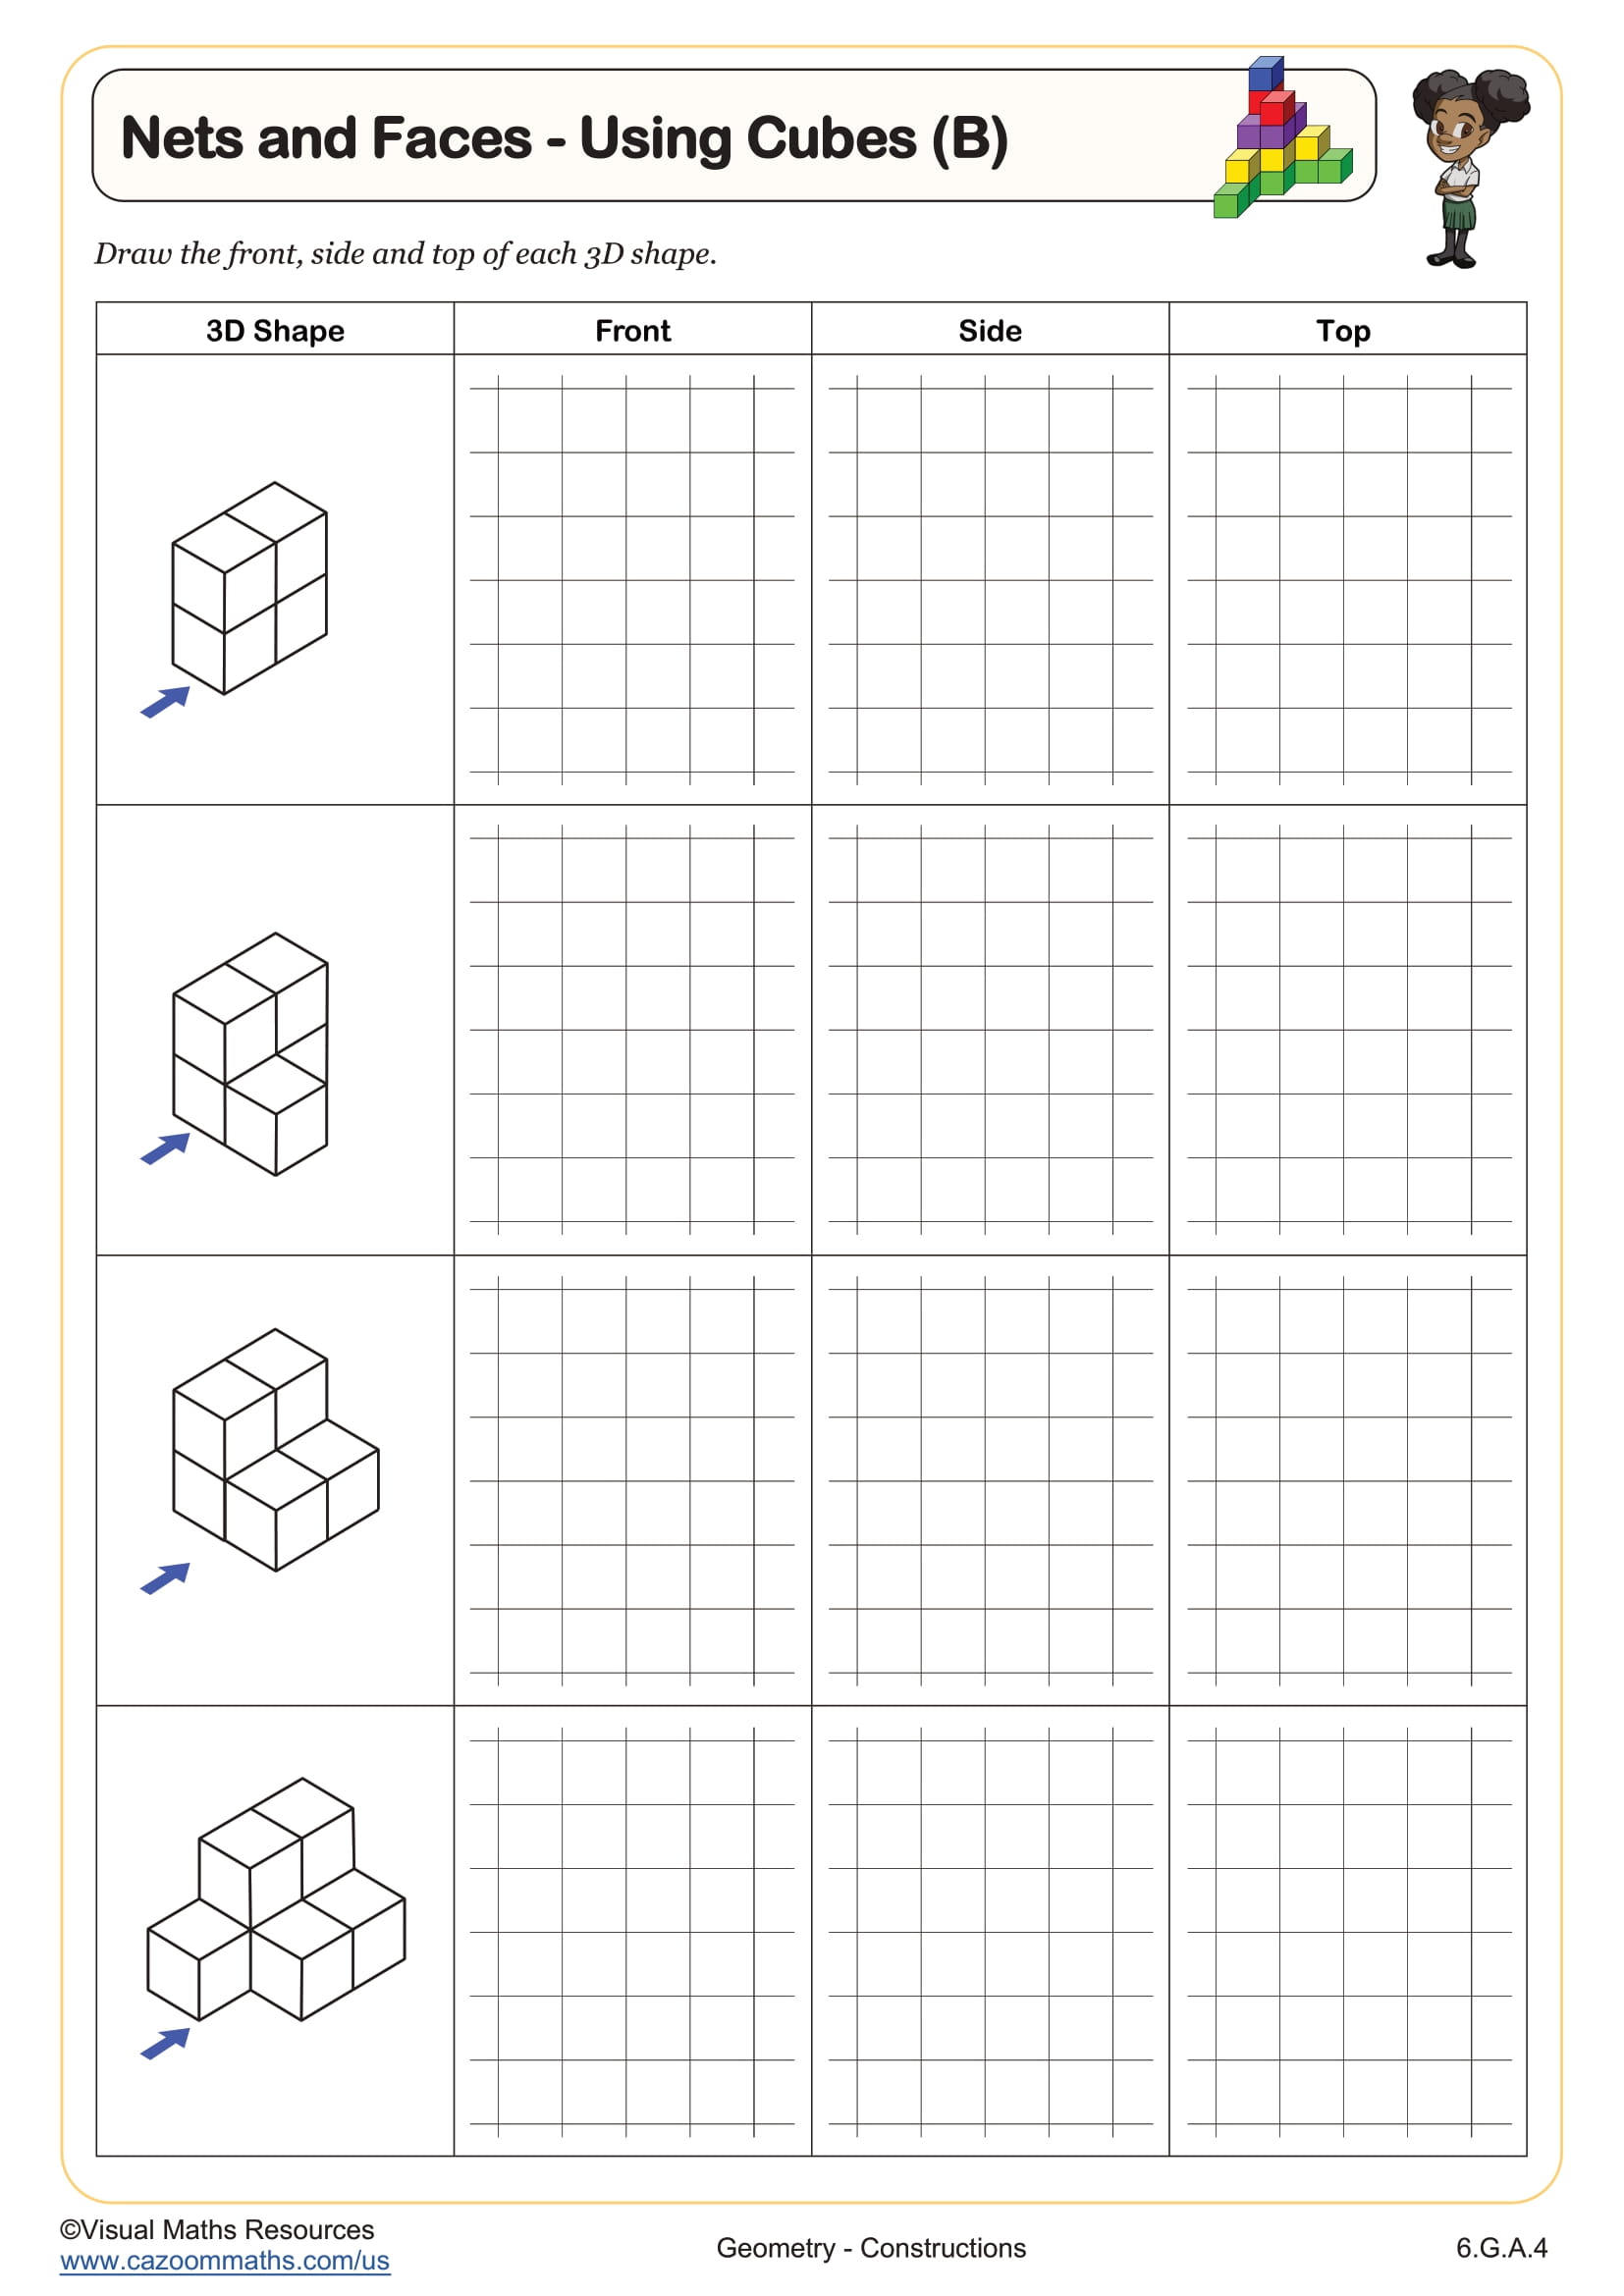
Nets and Faces - Using Cubes (B)
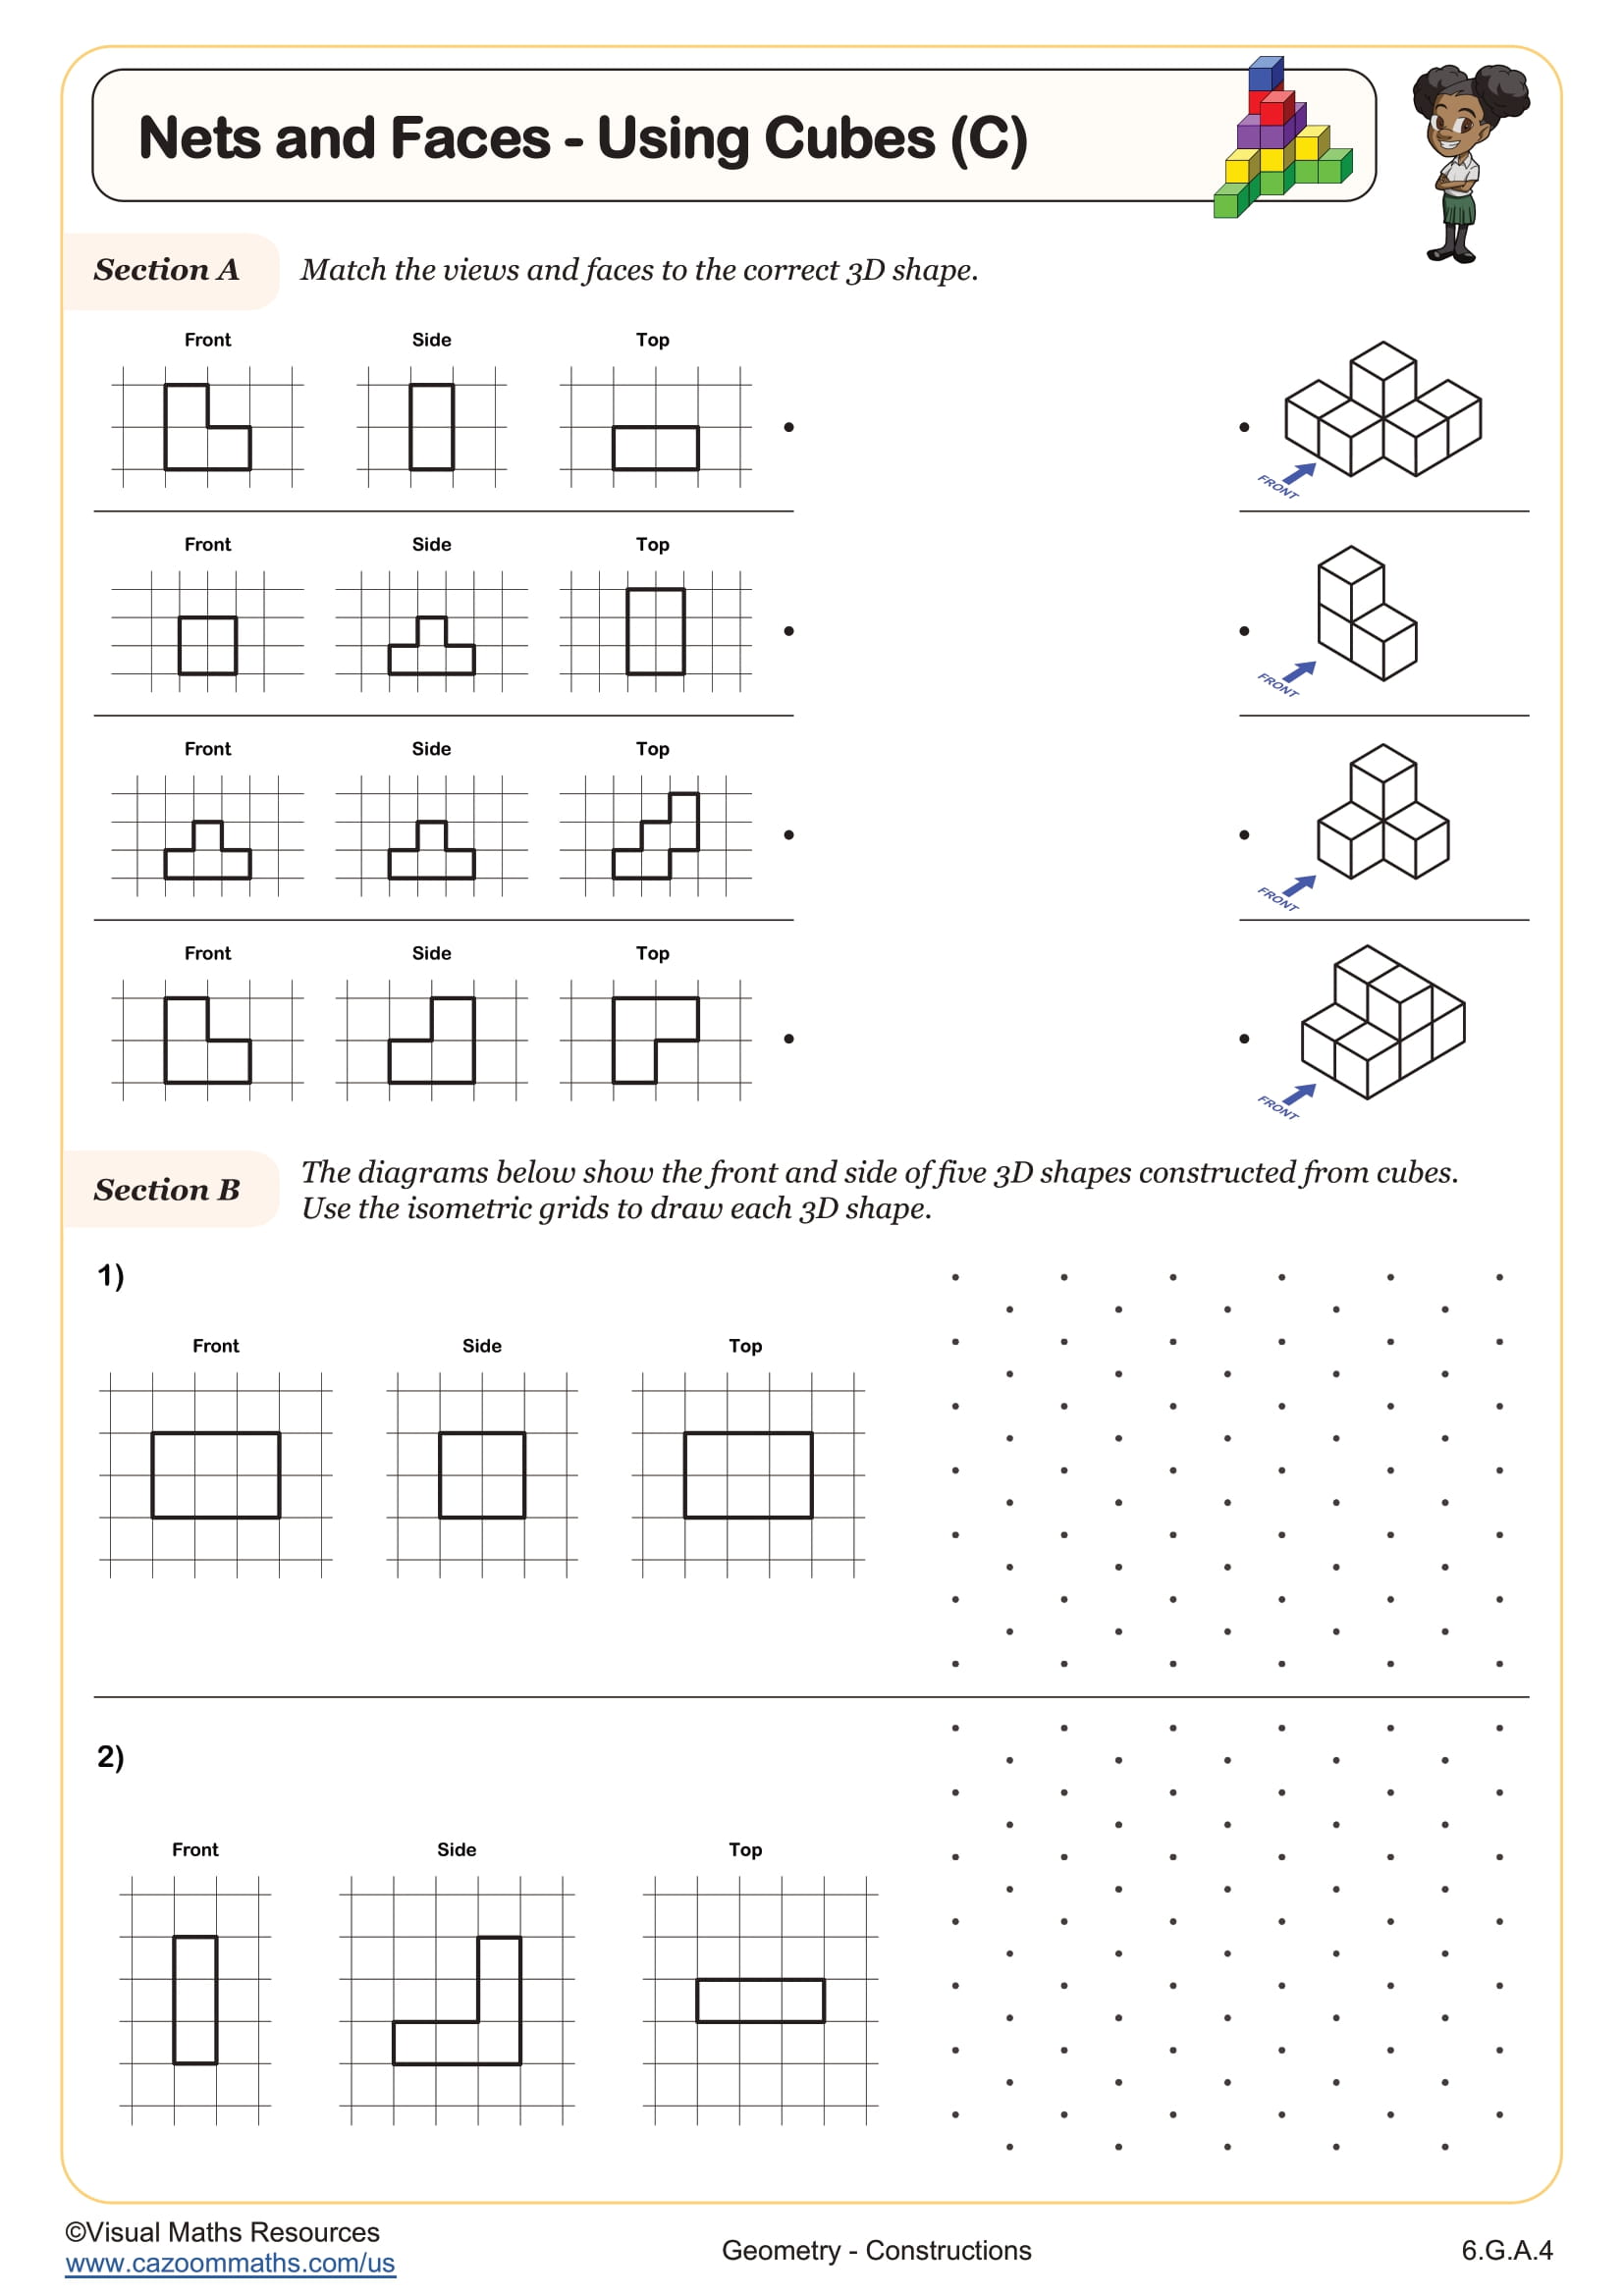
Nets and Faces - Using Cubes (C)
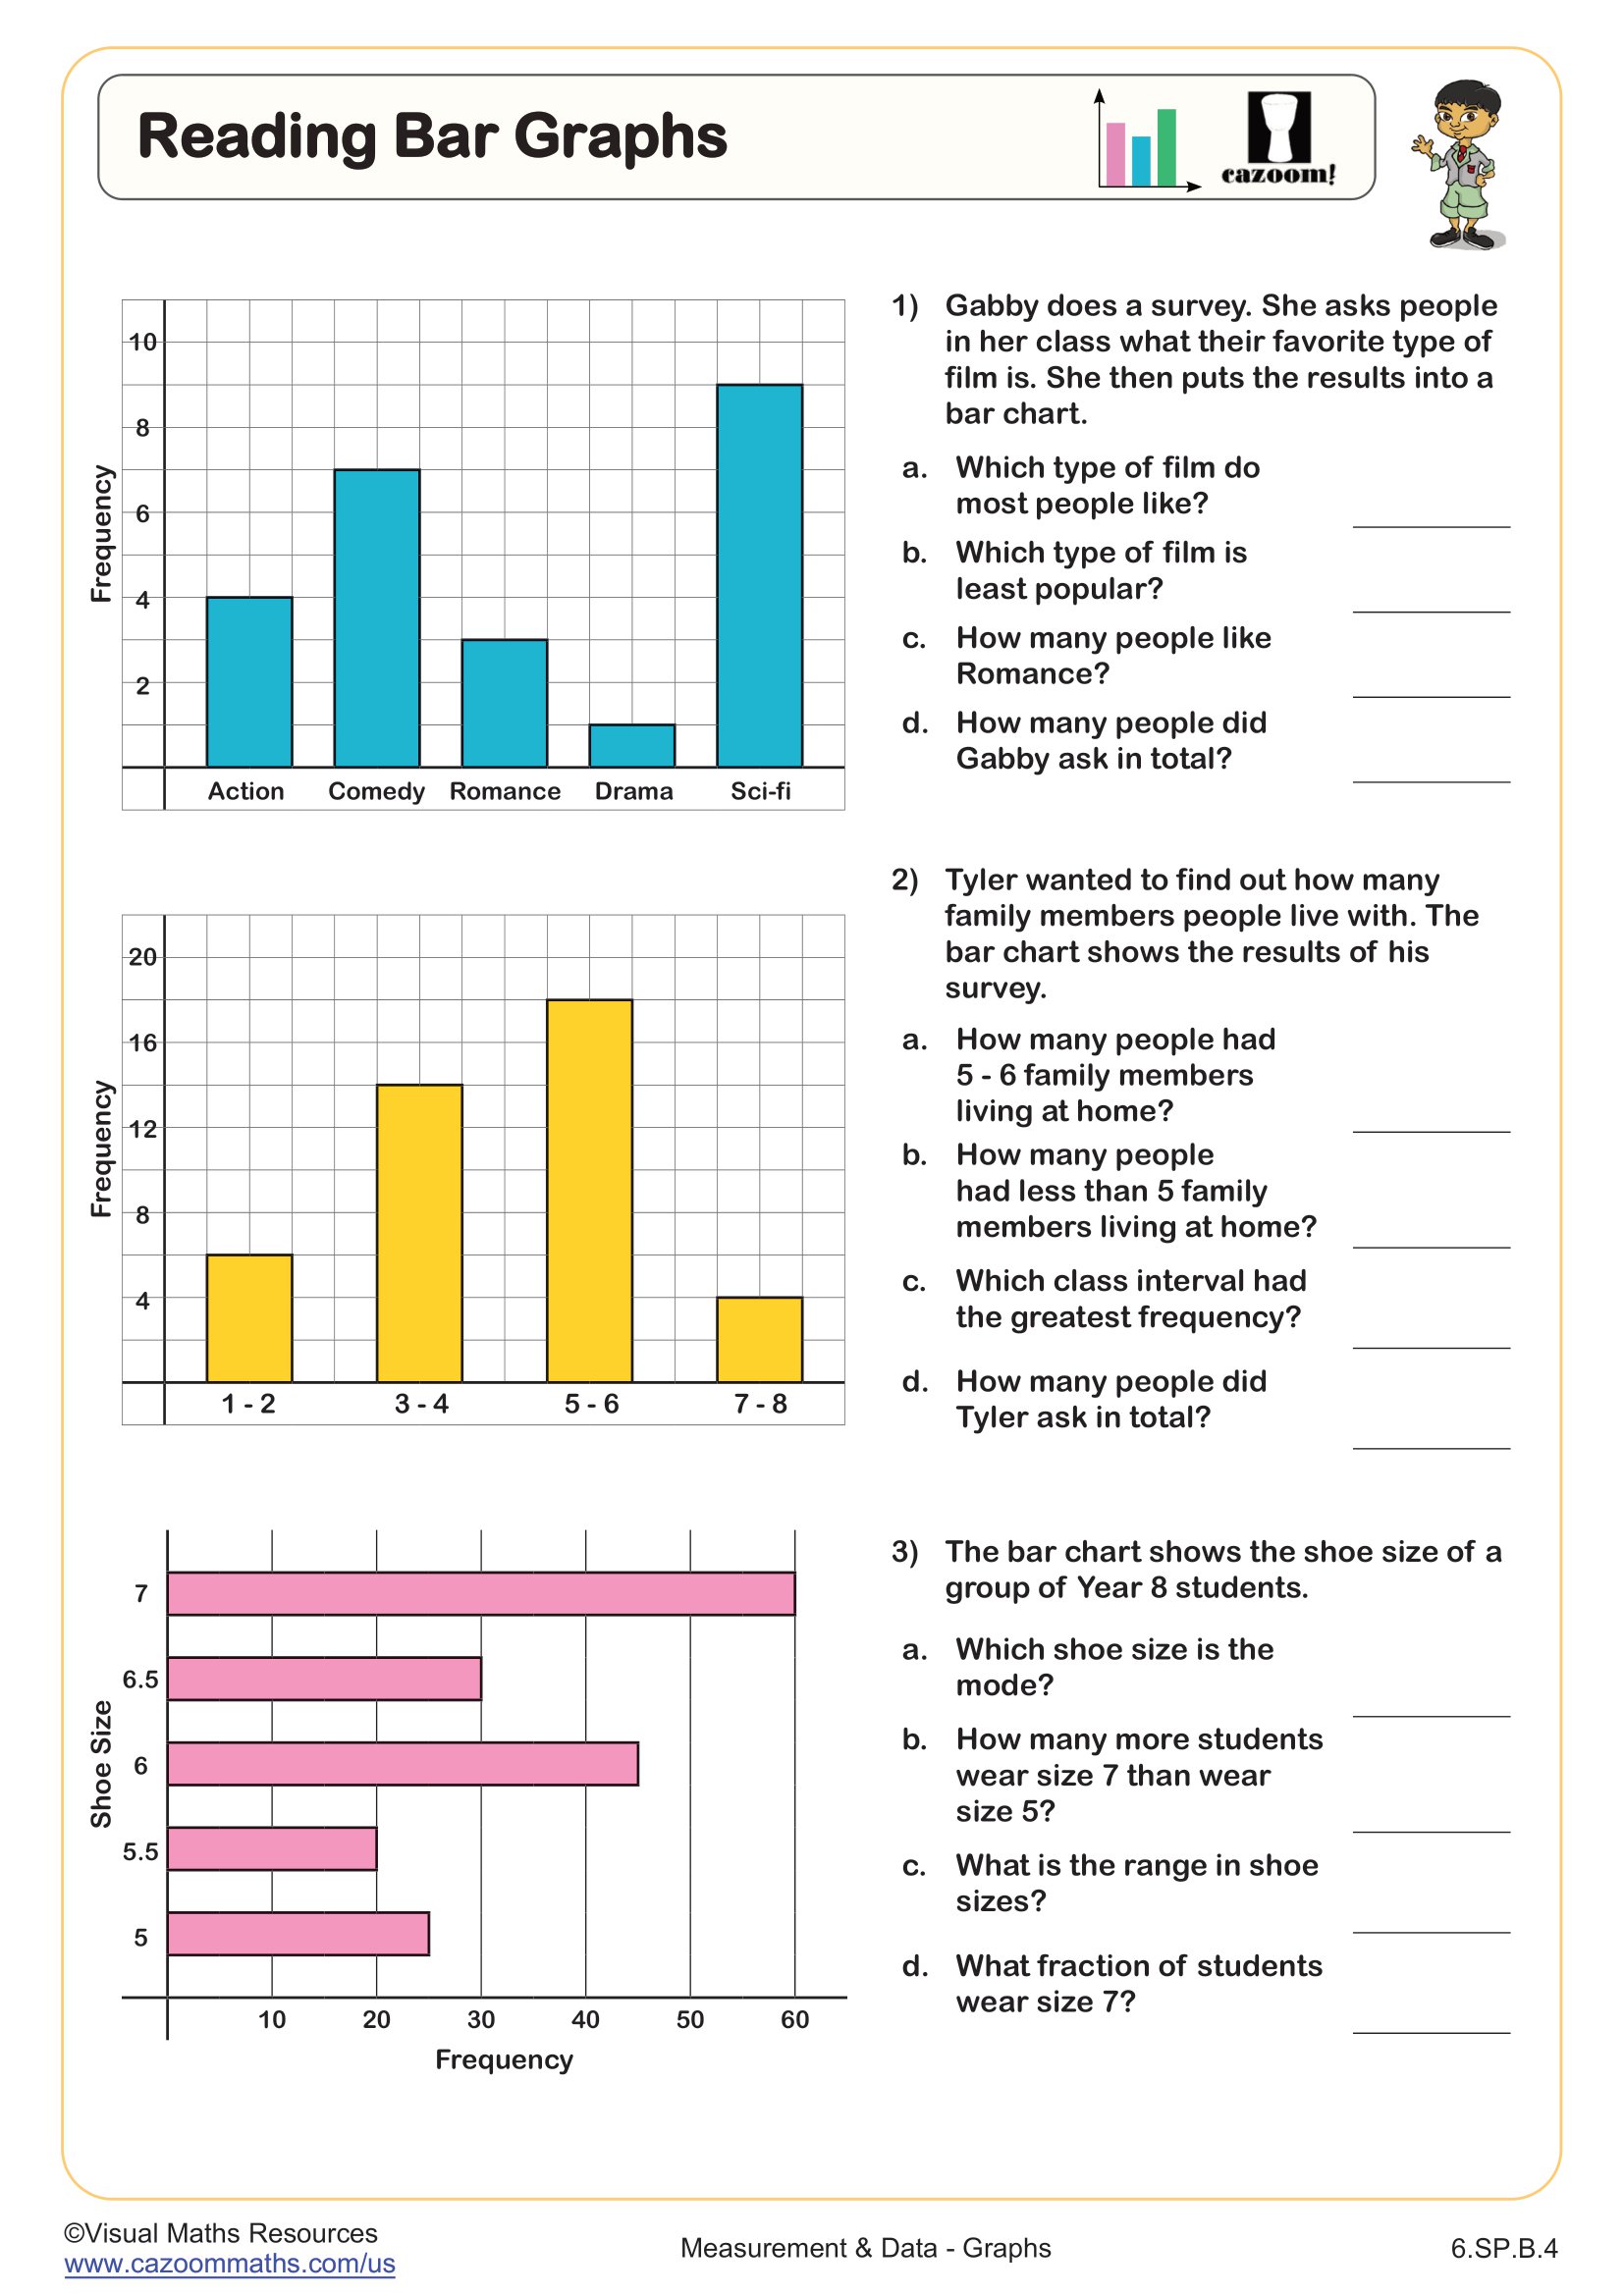
Reading Bar Graphs
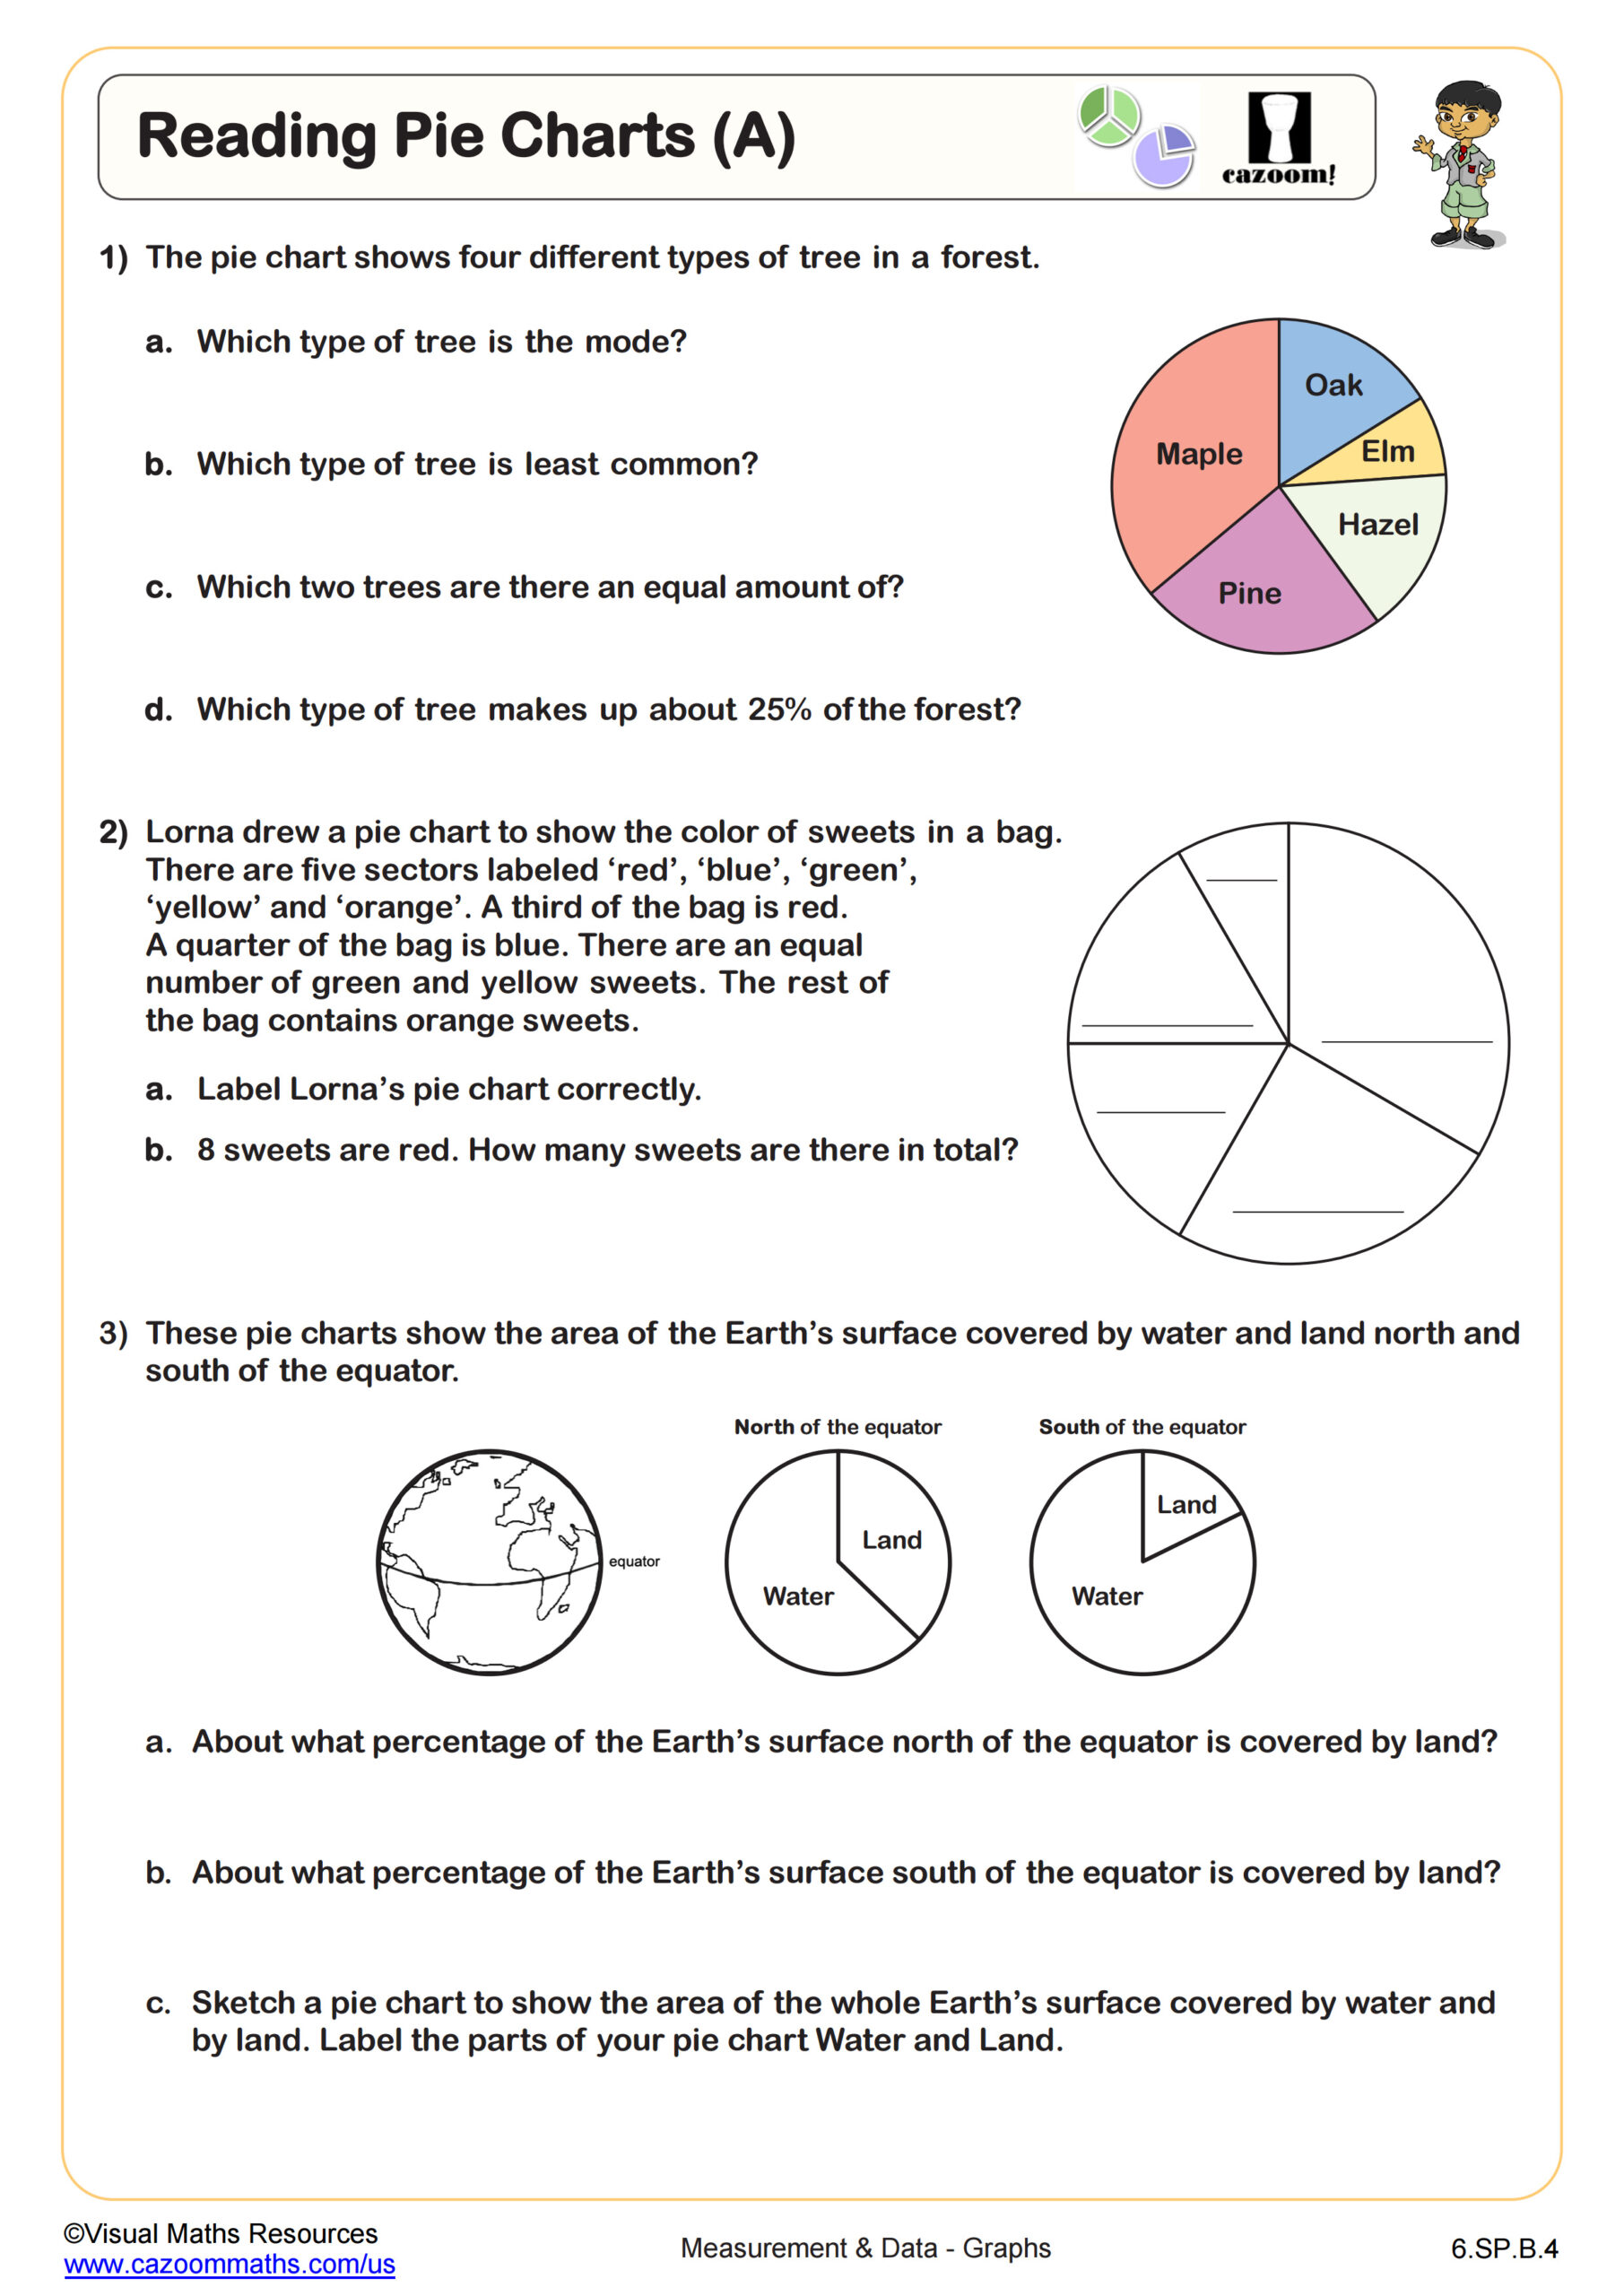
Reading Pie Charts (A)
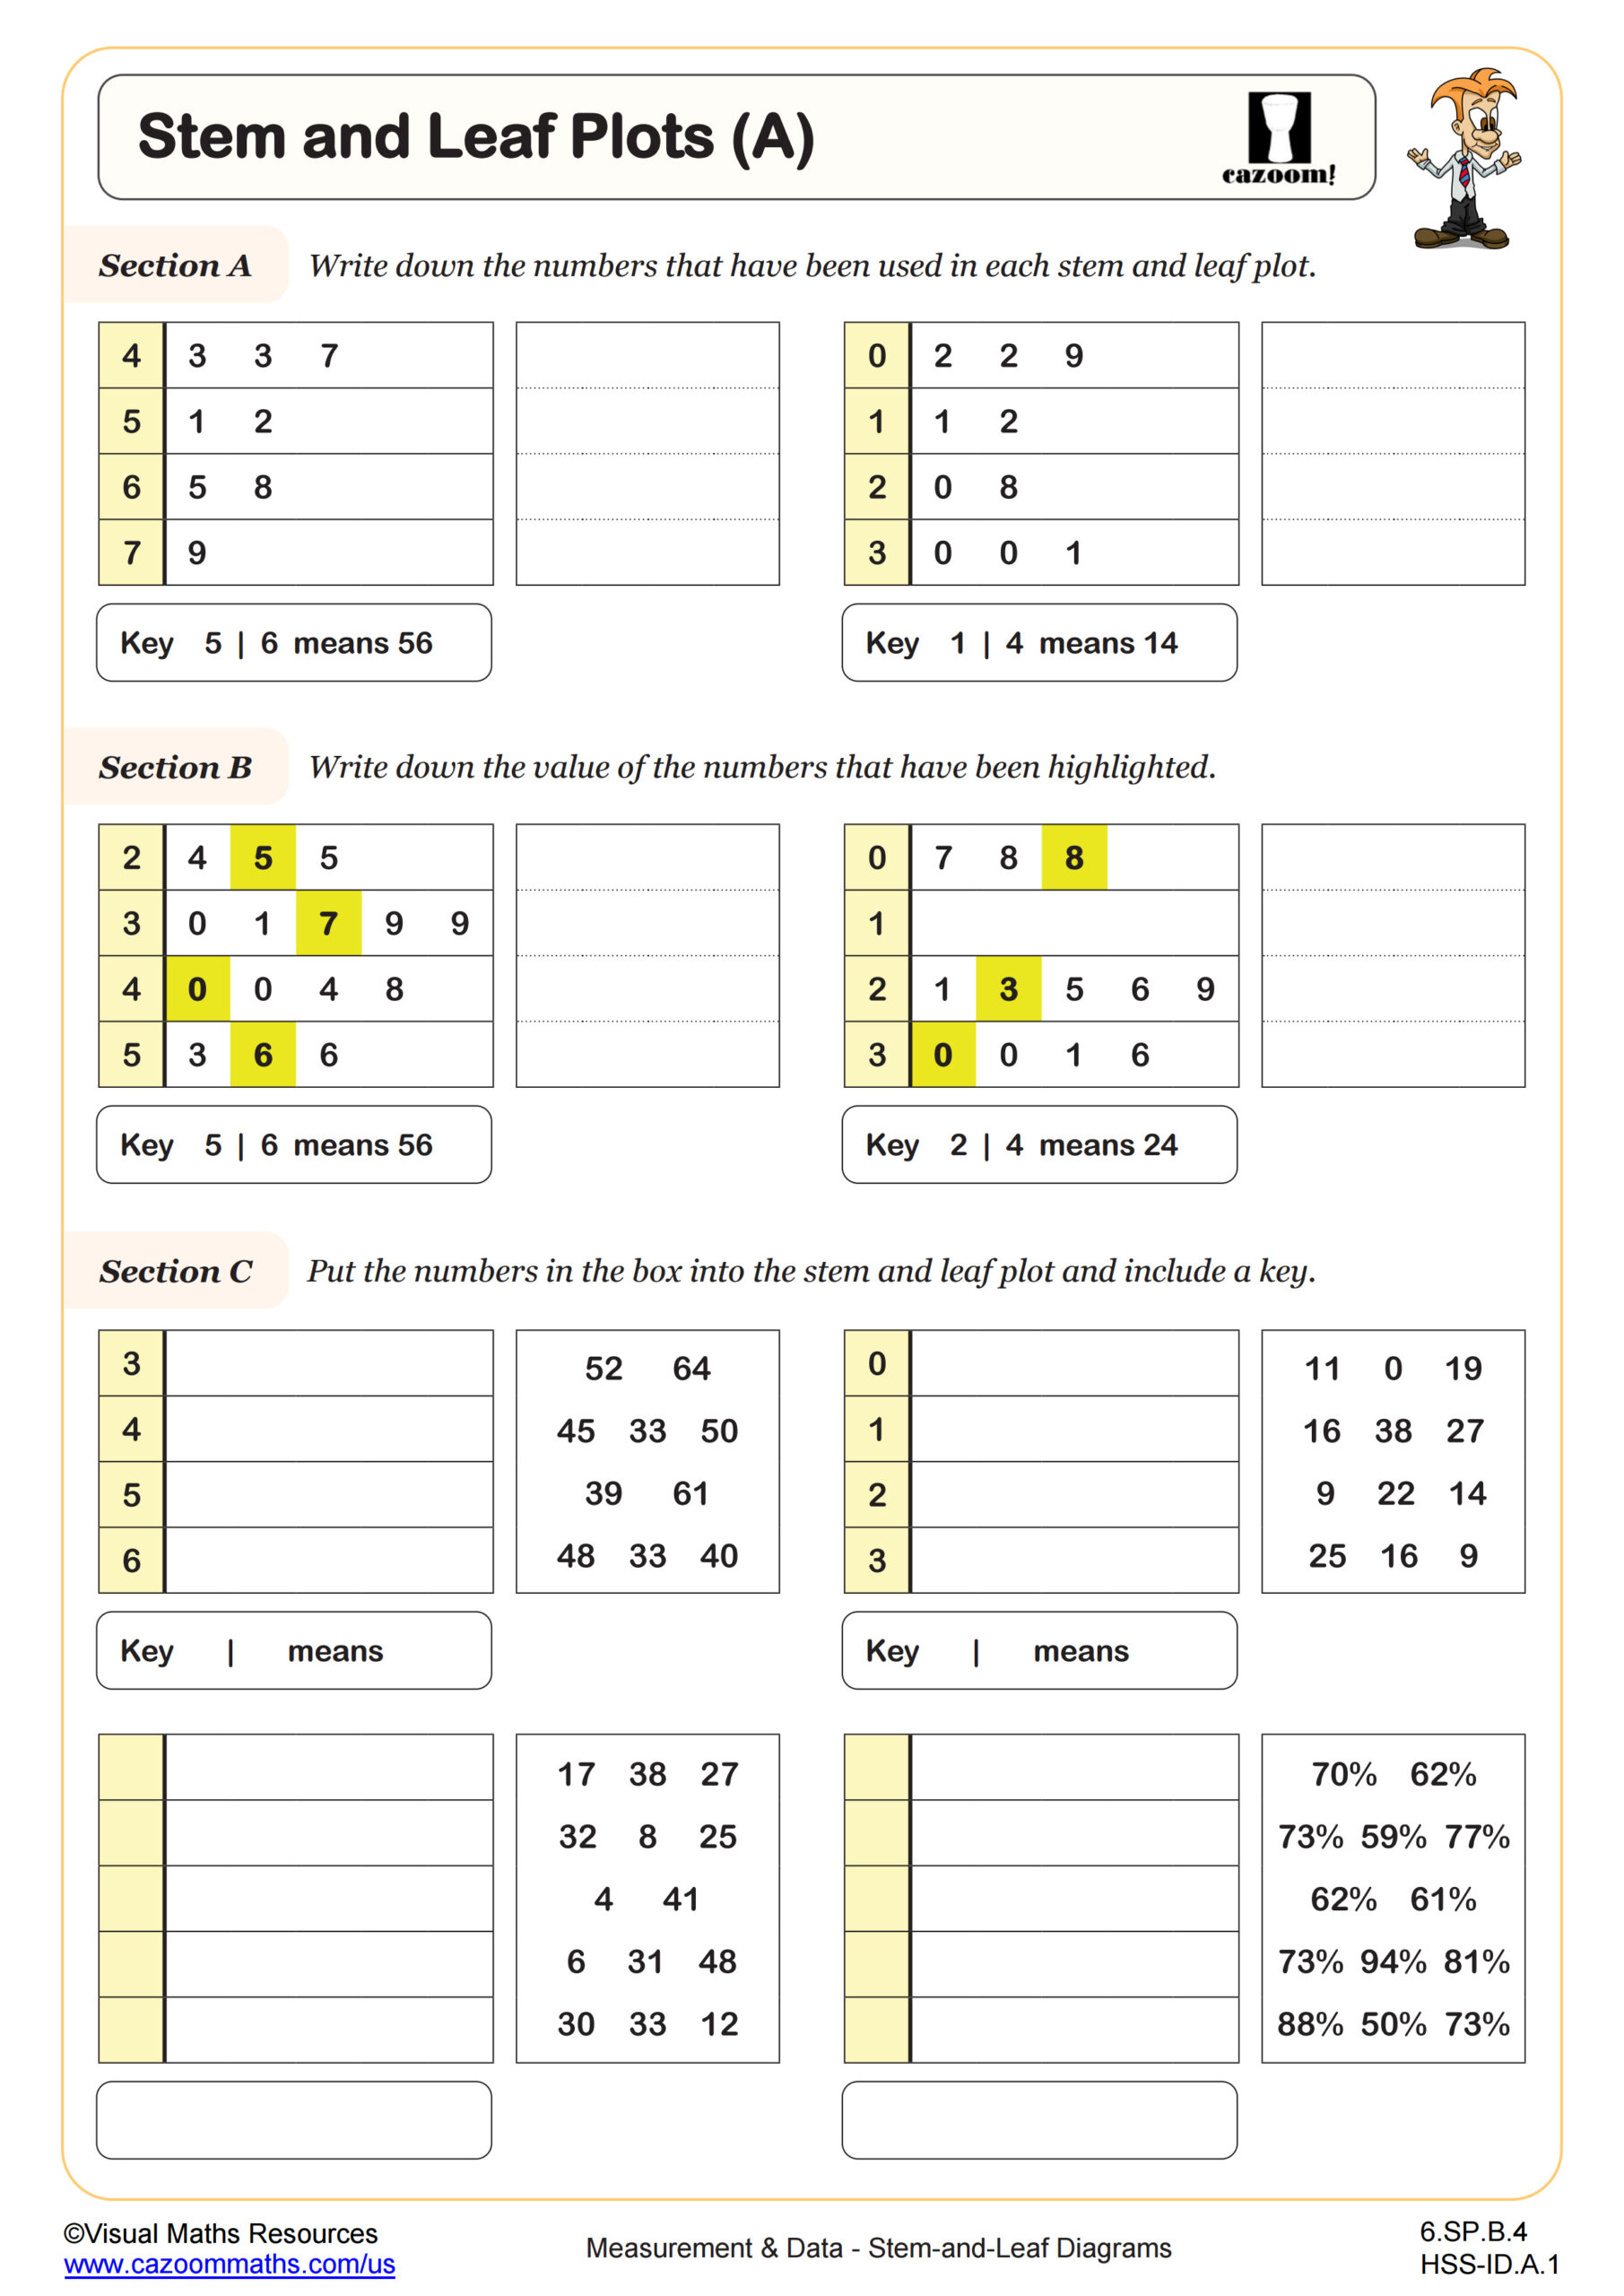
Stem and Leaf Plots (A)
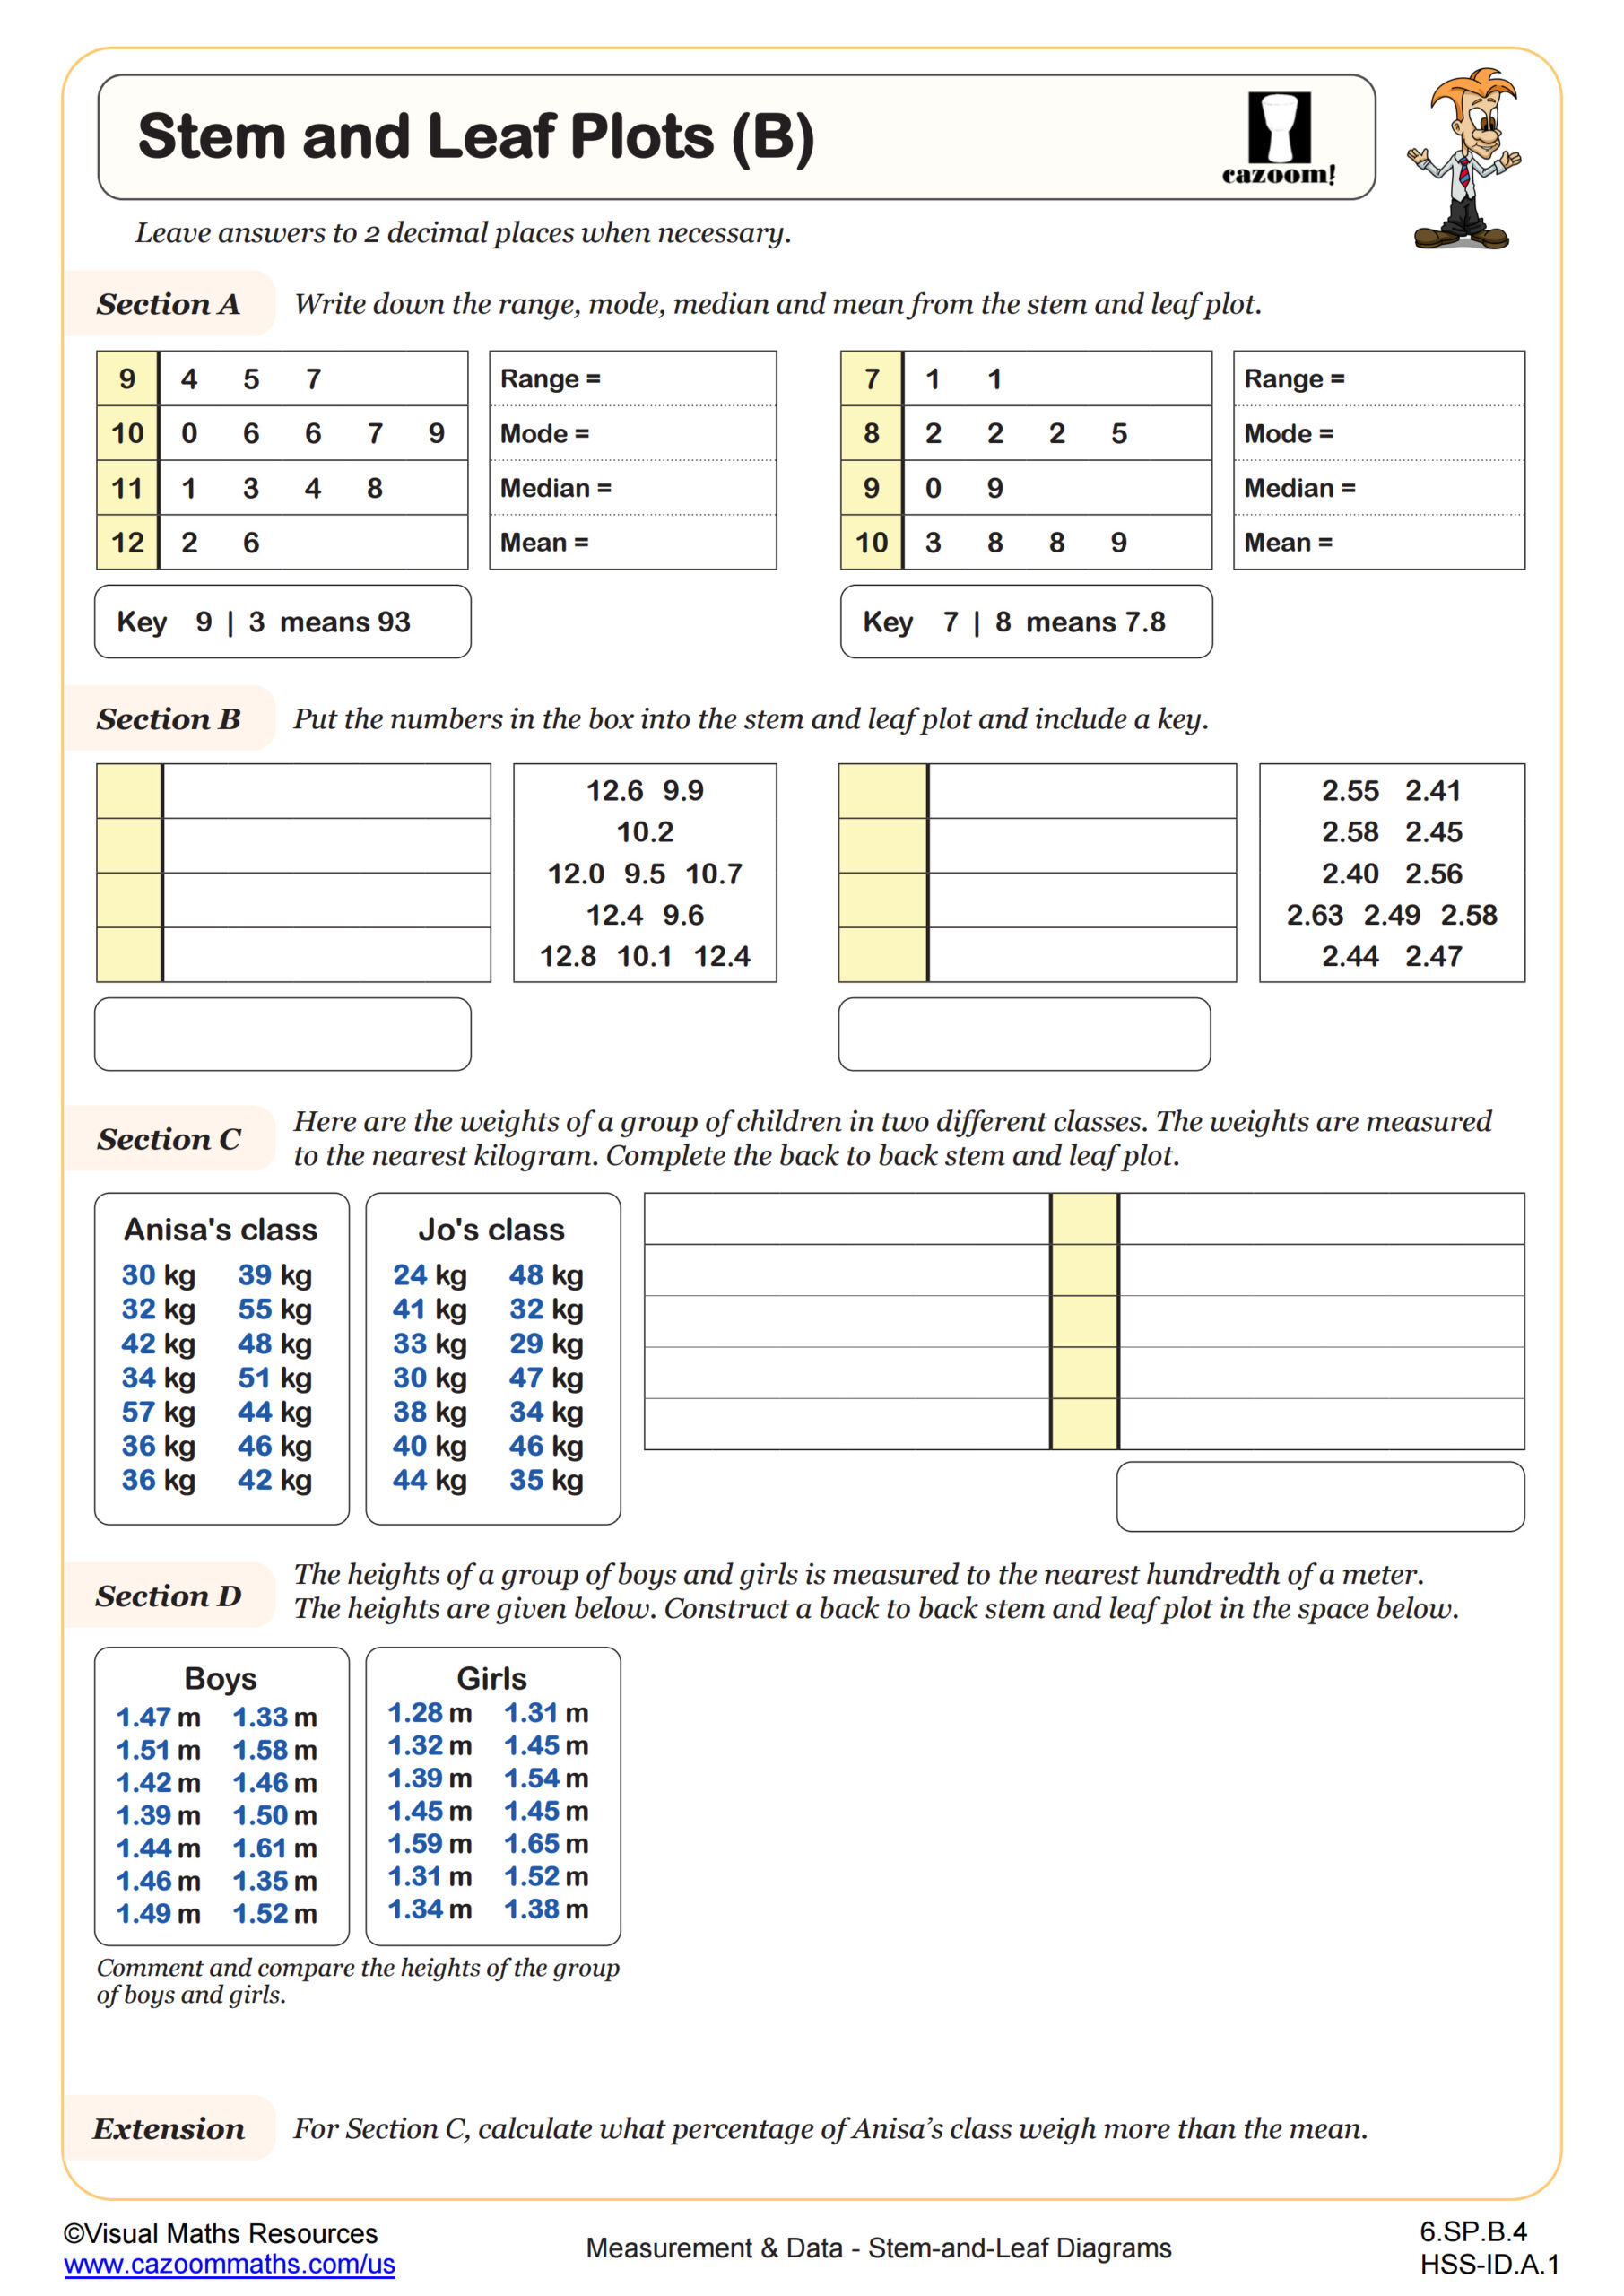
Stem and Leaf Plots (B)
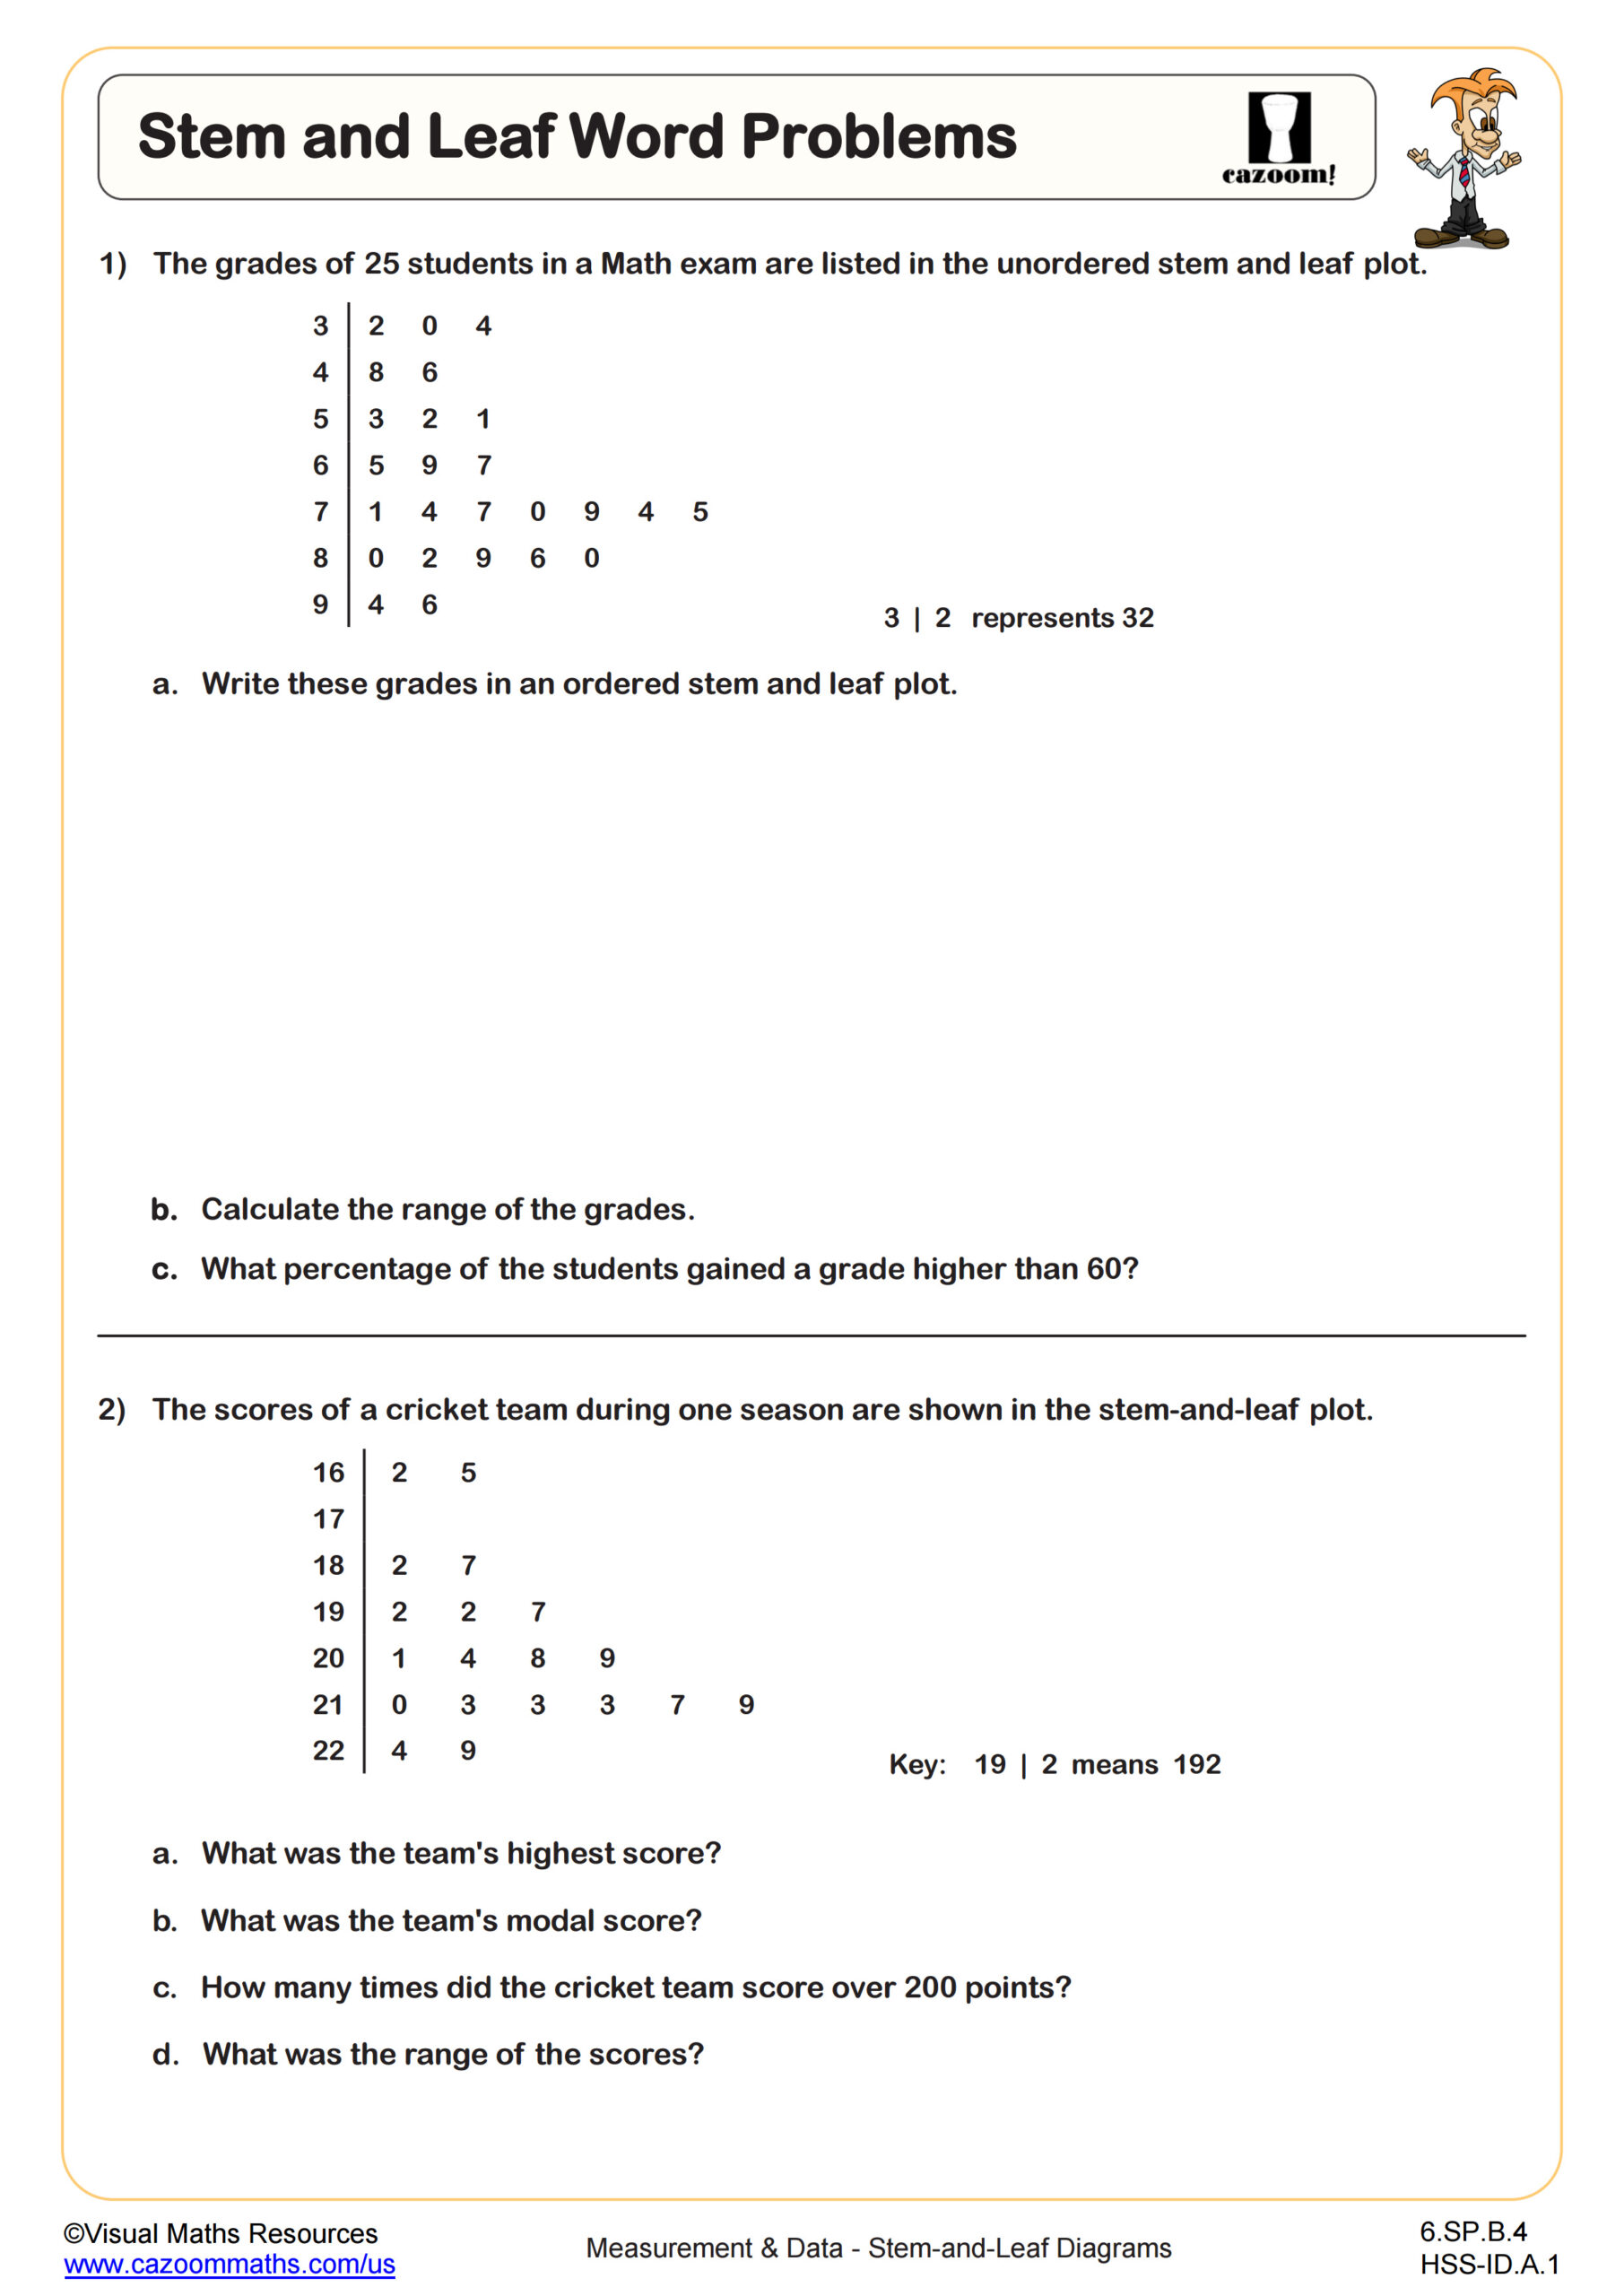
Stem and Leaf Word Problems
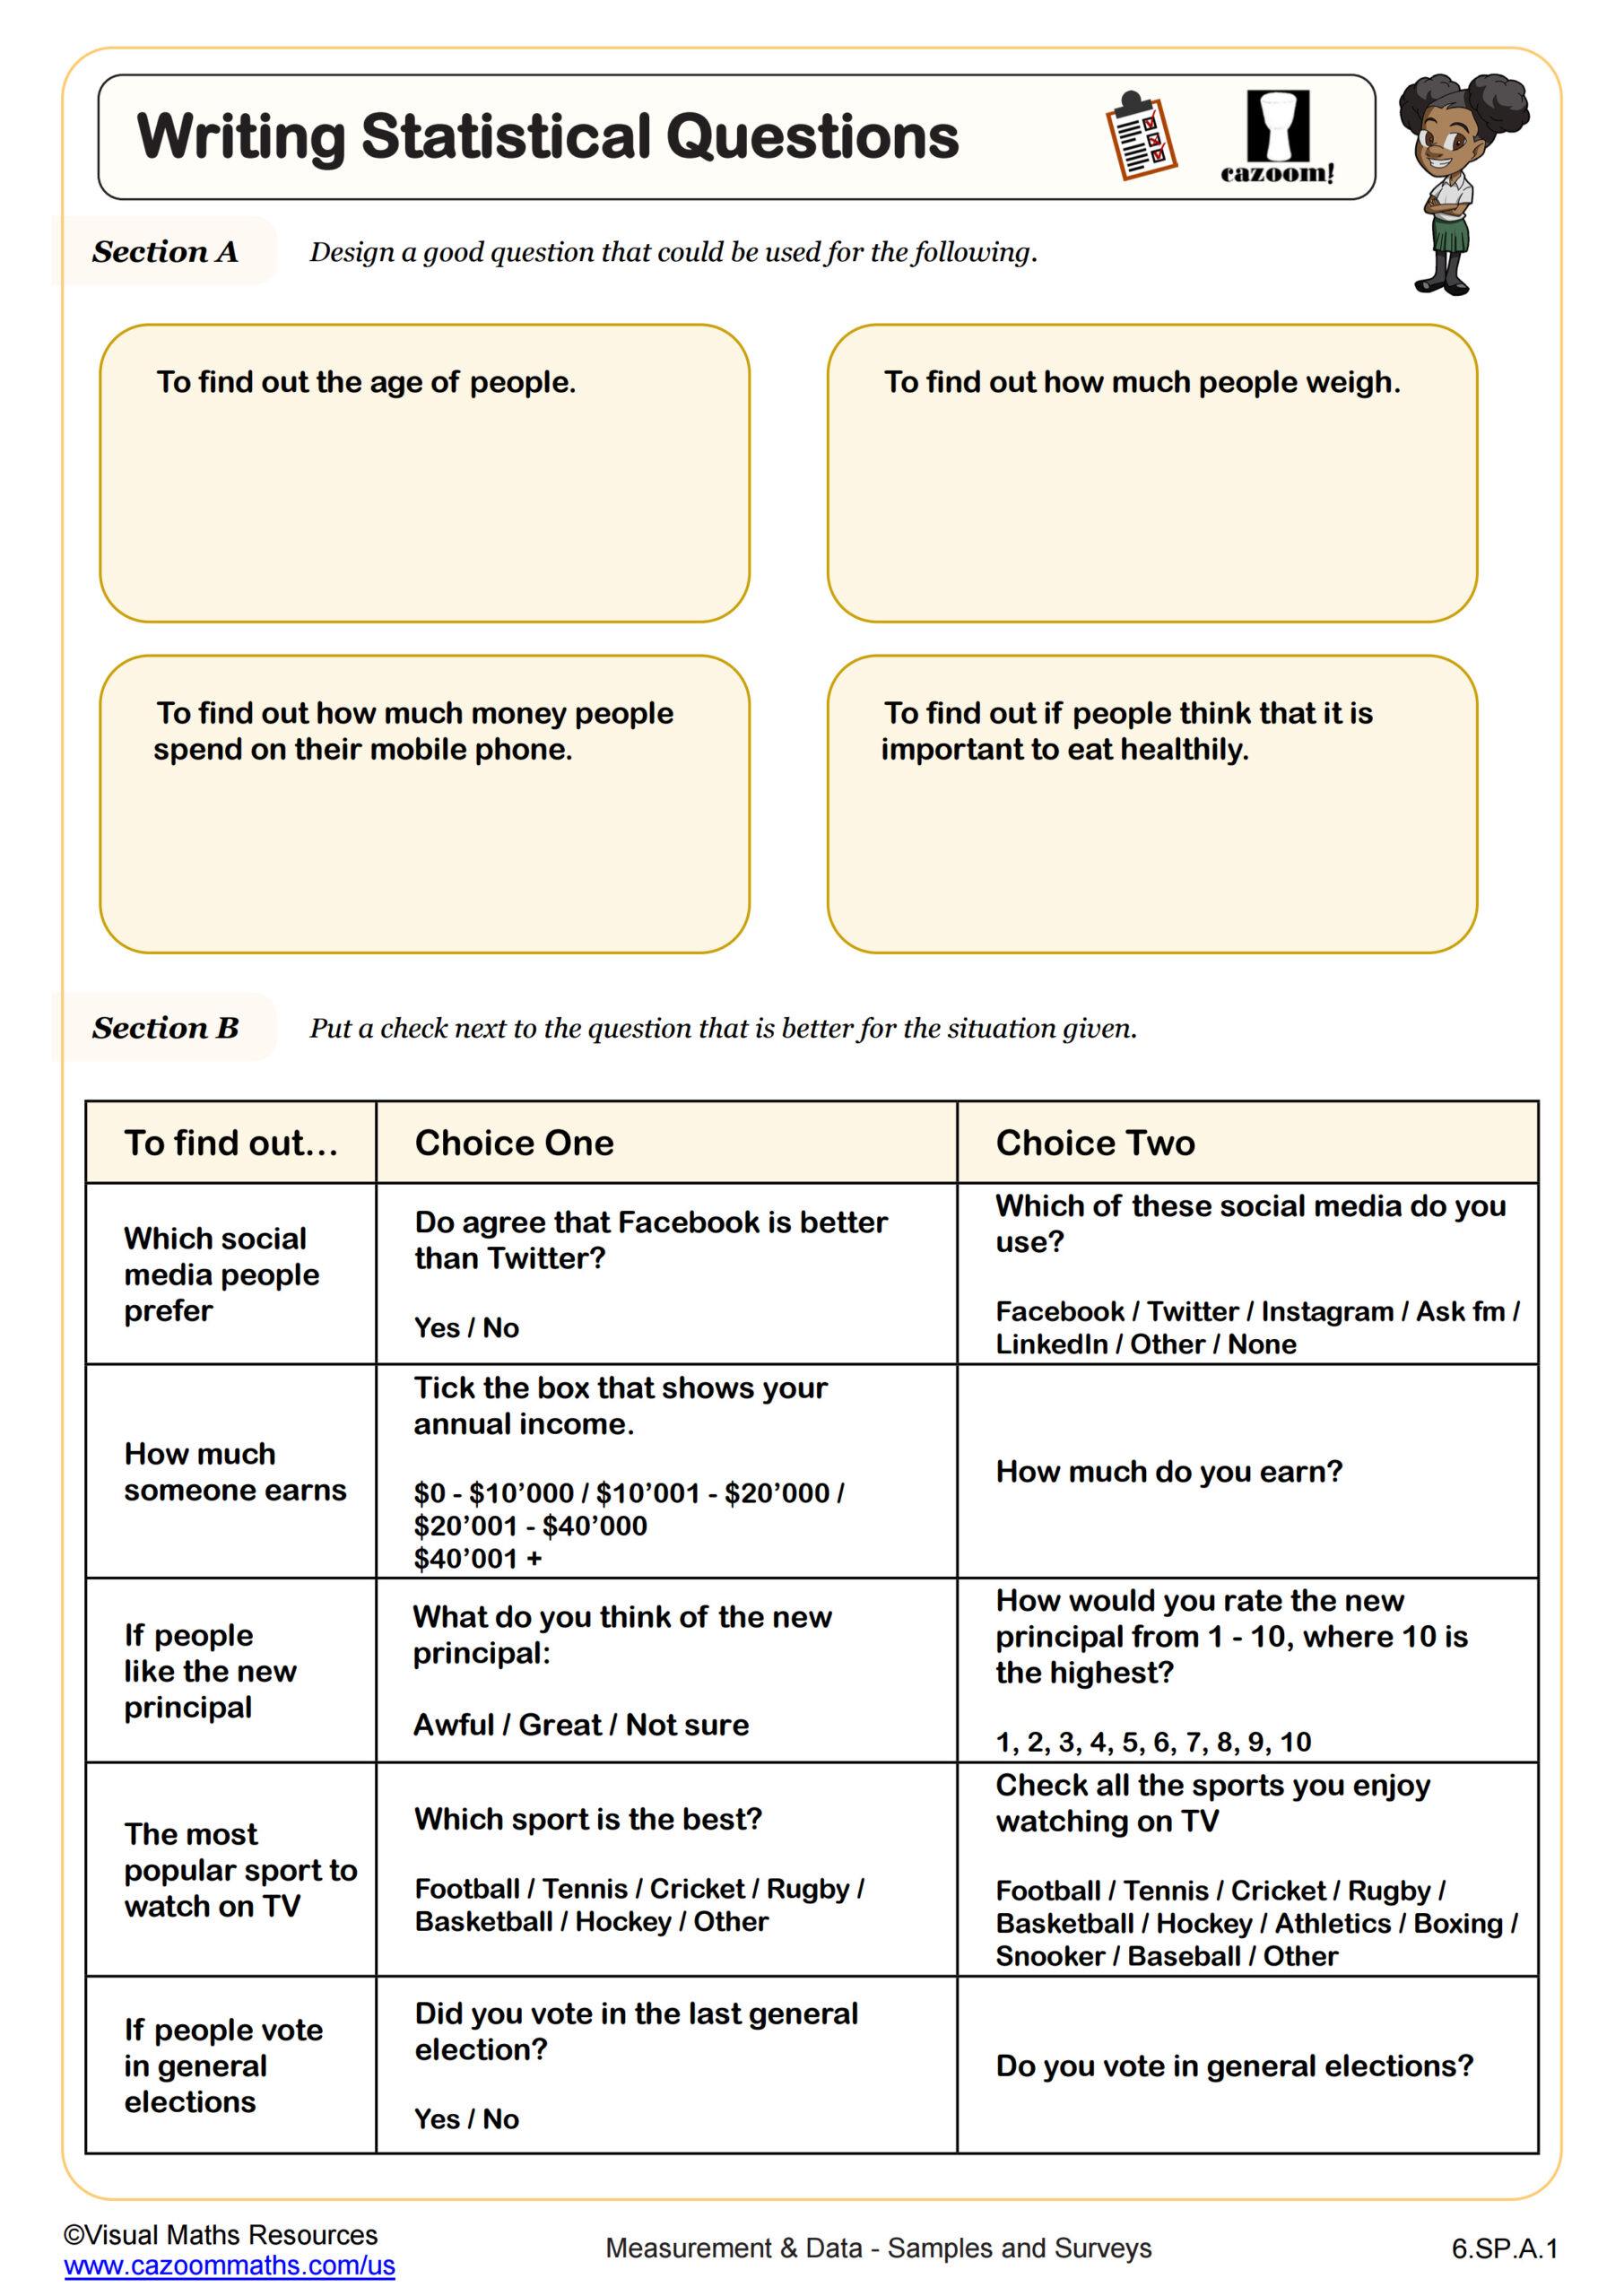
Writing Statistical Questions
All worksheets are created by the team of experienced teachers at Cazoom Math.
What measurement and data concepts do sixth graders learn?
Sixth grade measurement and data instruction centers on statistical variability and data distribution, aligning with Common Core standards 6.SP.A and 6.SP.B. Students learn to calculate and interpret mean, median, mode, and range, develop statistical questions, and represent data using dot plots, histograms, and box plots. The curriculum also includes understanding interquartile range and mean absolute deviation as measures of variability.
A common misconception surfaces when students attempt to find the median of an even-numbered data set. Many students simply choose one of the two middle numbers rather than calculating their average, which leads to incorrect answers on state assessments. Teachers find that color-coding the two middle values and explicitly practicing the averaging step helps students remember this crucial detail when working with real datasets.
Which grade levels use measurement and data worksheets?
These measurement and data worksheets specifically target sixth grade students in middle school. At this level, students build upon the measurement skills and basic graphing concepts learned in elementary grades while developing more sophisticated statistical reasoning abilities that prepare them for pre-algebra and algebra coursework.
Sixth grade represents a pivotal year where students shift from simply collecting and displaying data to analyzing distributions and drawing inferences. Students begin recognizing patterns in variability, comparing data sets quantitatively, and understanding how different measures of center respond to outliers. This foundational work in statistical thinking becomes increasingly important as students advance to bivariate data analysis in seventh and eighth grades.
How do students interpret box plots and quartiles?
Box plots, also called box-and-whisker plots, provide a visual summary of data distribution by displaying the five-number summary: minimum, first quartile, median, third quartile, and maximum. Students learn to construct these plots by first ordering data, identifying quartiles that divide the dataset into four equal parts, and then representing this information graphically. Understanding quartiles helps students recognize where data clusters and where it spreads out.
This skill connects directly to real-world applications in sports analytics, where box plots compare player performance statistics across seasons or teams. Medical researchers use quartiles to establish normal ranges for health indicators like blood pressure or cholesterol levels. When students realize that the "box" in a box plot contains the middle 50% of all data points, they begin understanding how variability appears in everything from test scores to weather patterns to manufacturing quality control.
How do these worksheets support different learning needs?
The measurement and data worksheets provide scaffolded practice that progresses from guided examples to independent problem-solving. Many worksheets include worked examples at the top, allowing students to reference solution strategies as they tackle similar problems. The answer keys enable students to self-check their work during independent practice, helping them identify calculation errors or conceptual misunderstandings before they become ingrained habits.
Teachers use these worksheets flexibly across various classroom structures. They work well for differentiated math stations where students practice specific skills like calculating mean absolute deviation while other groups work on different objectives. The worksheets also serve as targeted intervention materials for students who need additional support with data interpretation before summative assessments. Many teachers assign selected problems for homework to reinforce classroom instruction, then use the answer keys for quick whole-class review the following day.