6th Grade Probability Worksheets
All worksheets are created by the team of experienced teachers at Cazoom Math.
What Are Grouped Frequency Tables in Probability?
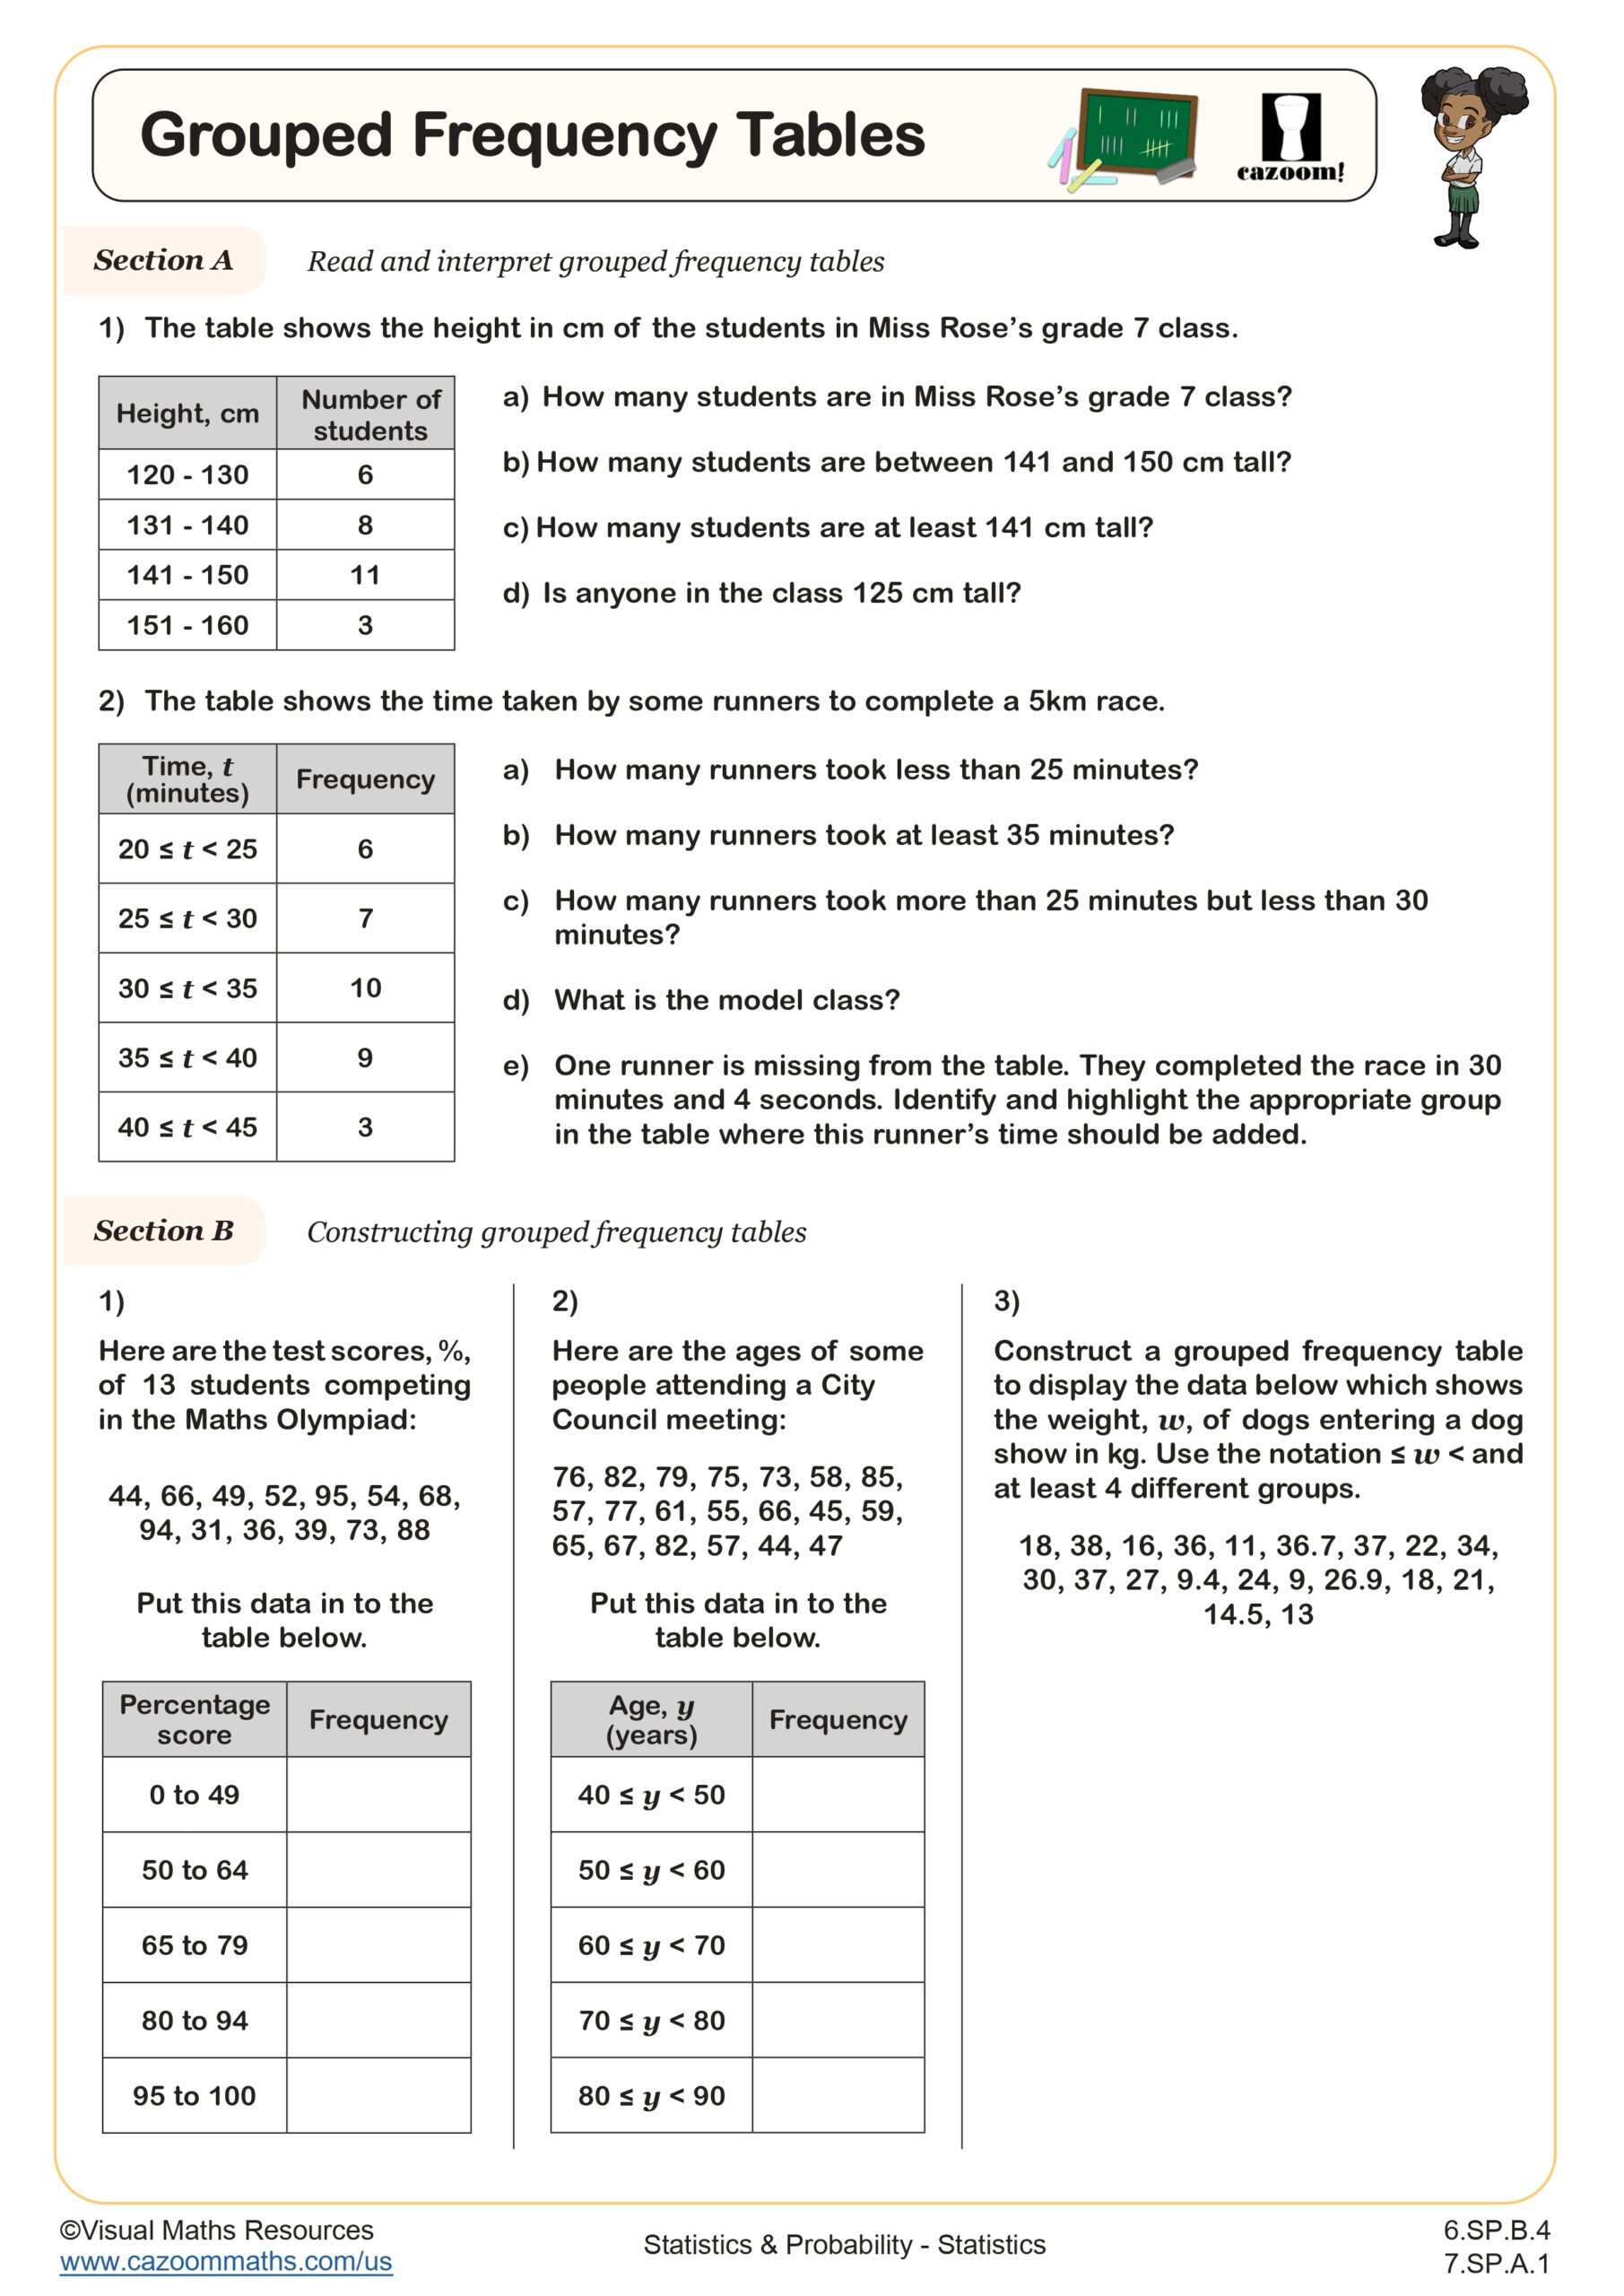
Grouped frequency tables organize data into intervals or categories and show how many data points fall into each group. In 6th grade, students use these tables to manage larger data sets where listing every individual value becomes impractical. The table structure includes columns for the data intervals, the frequency (count) of values in each interval, and often the relative frequency expressed as a fraction or decimal.
A common error students make involves overlapping intervals, such as creating groups like 0-5 and 5-10 where the value 5 appears in both categories. Teachers often see students struggle with determining appropriate interval sizes, either making groups too narrow (defeating the purpose of grouping) or too wide (losing meaningful data patterns). The answer keys help teachers identify whether students understand that intervals must be mutually exclusive and collectively exhaustive.
What Should 6th Graders Know About Probability and Data Tables?
According to Common Core standards (6.SP.B.4 and 6.SP.B.5), 6th grade students should display numerical data in plots on a number line and understand that data distributions can be described by their center, spread, and overall shape. They begin connecting organized data displays to probability concepts, recognizing that relative frequency approximates theoretical probability as sample sizes increase. Students at this level should comfortably create and interpret frequency tables as tools for summarizing data before making probability statements.
This work builds directly on 5th grade experiences with line plots and basic data collection, while preparing students for 7th grade probability models and random sampling. Teachers notice that students who master grouped frequency tables in 6th grade transition more smoothly to histograms and probability distributions in later grades. The organizational thinking required here becomes the foundation for statistical reasoning throughout middle and high school math courses.
How Do Students Calculate Relative Frequency from Grouped Data?
Relative frequency represents the proportion of data points in a specific group compared to the total number of data points. Students calculate it by dividing the frequency of one interval by the total number of observations, then expressing the result as a fraction, decimal, or percentage. For example, if 12 out of 50 students scored between 80-89 on a test, the relative frequency is 12/50 or 0.24 or 24%. This relative frequency can then inform probability predictions for future events.
Relative frequency connects directly to real-world applications in quality control, market research, and scientific experiments. Manufacturing companies use grouped frequency tables to track defect rates across production batches, while meteorologists organize temperature ranges to predict weather patterns. Students often make the connection that relative frequency from collected data becomes their best estimate for probability when theoretical probability is difficult to determine, a concept that appears on state assessments and standardized tests.
How Can Teachers Use These Probability Worksheets in Class?
These worksheets provide structured practice that guides students through the complete process of creating grouped frequency tables from raw data sets, then using those tables to answer probability questions. The progression typically moves from simple categorization tasks to more complex scenarios requiring students to choose appropriate intervals and justify their grouping decisions. Answer keys allow teachers to quickly identify whether errors stem from miscounting, incorrect interval creation, or faulty probability reasoning based on the completed tables.
Many teachers use these worksheets during small group instruction when introducing probability concepts, as the visual organization helps students see patterns they might miss in ungrouped data. The materials work well for homework review after initial instruction, or as intervention resources for students who struggled with probability on formative assessments. Paired work particularly benefits this topic, as students can check each other's interval boundaries and frequency counts before attempting probability calculations, catching organizational errors early in the process.