6th Grade Real Life Graphs Worksheets
All worksheets are created by the team of experienced teachers at Cazoom Math.
What Are Real Life Graphs in 6th Grade Math?
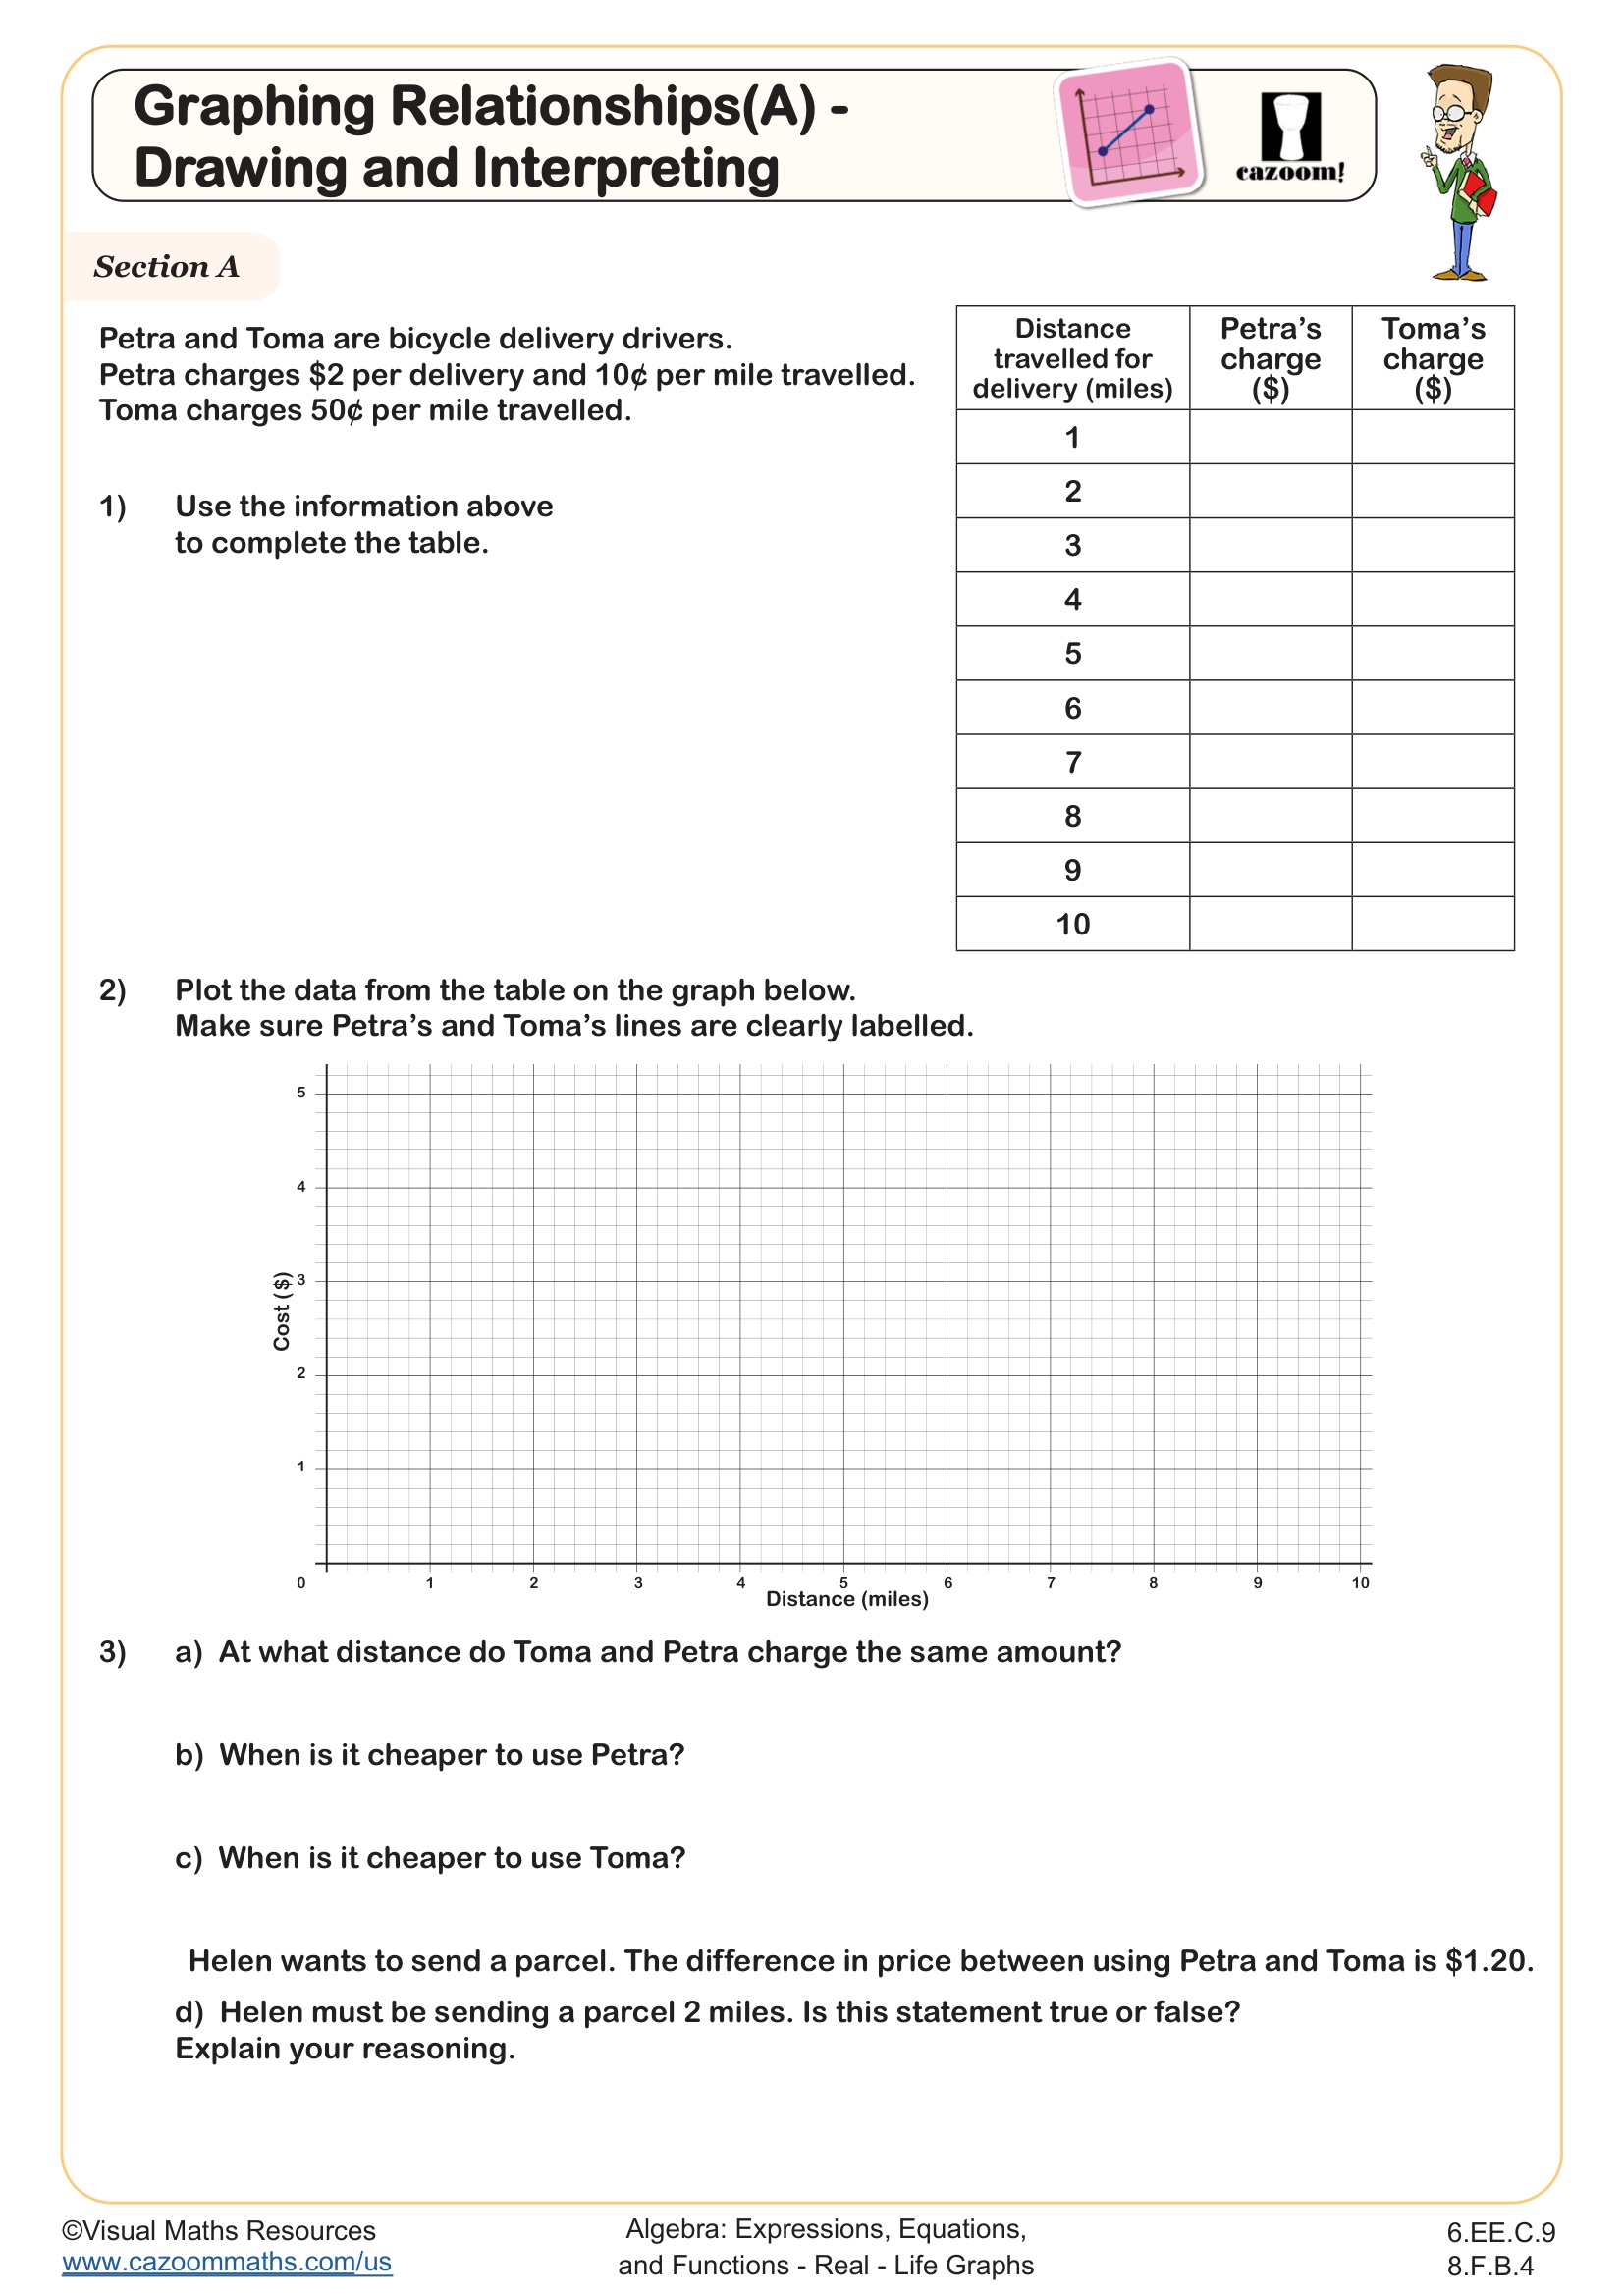
Real life graphs represent relationships between two quantities in everyday situations, such as distance traveled over time, water level in a filling bathtub, or temperature throughout a day. Unlike abstract coordinate plane work, these graphs tell a story that students can visualize and connect to their experiences. In 6th grade, students interpret existing graphs and create their own based on written descriptions or scenarios.
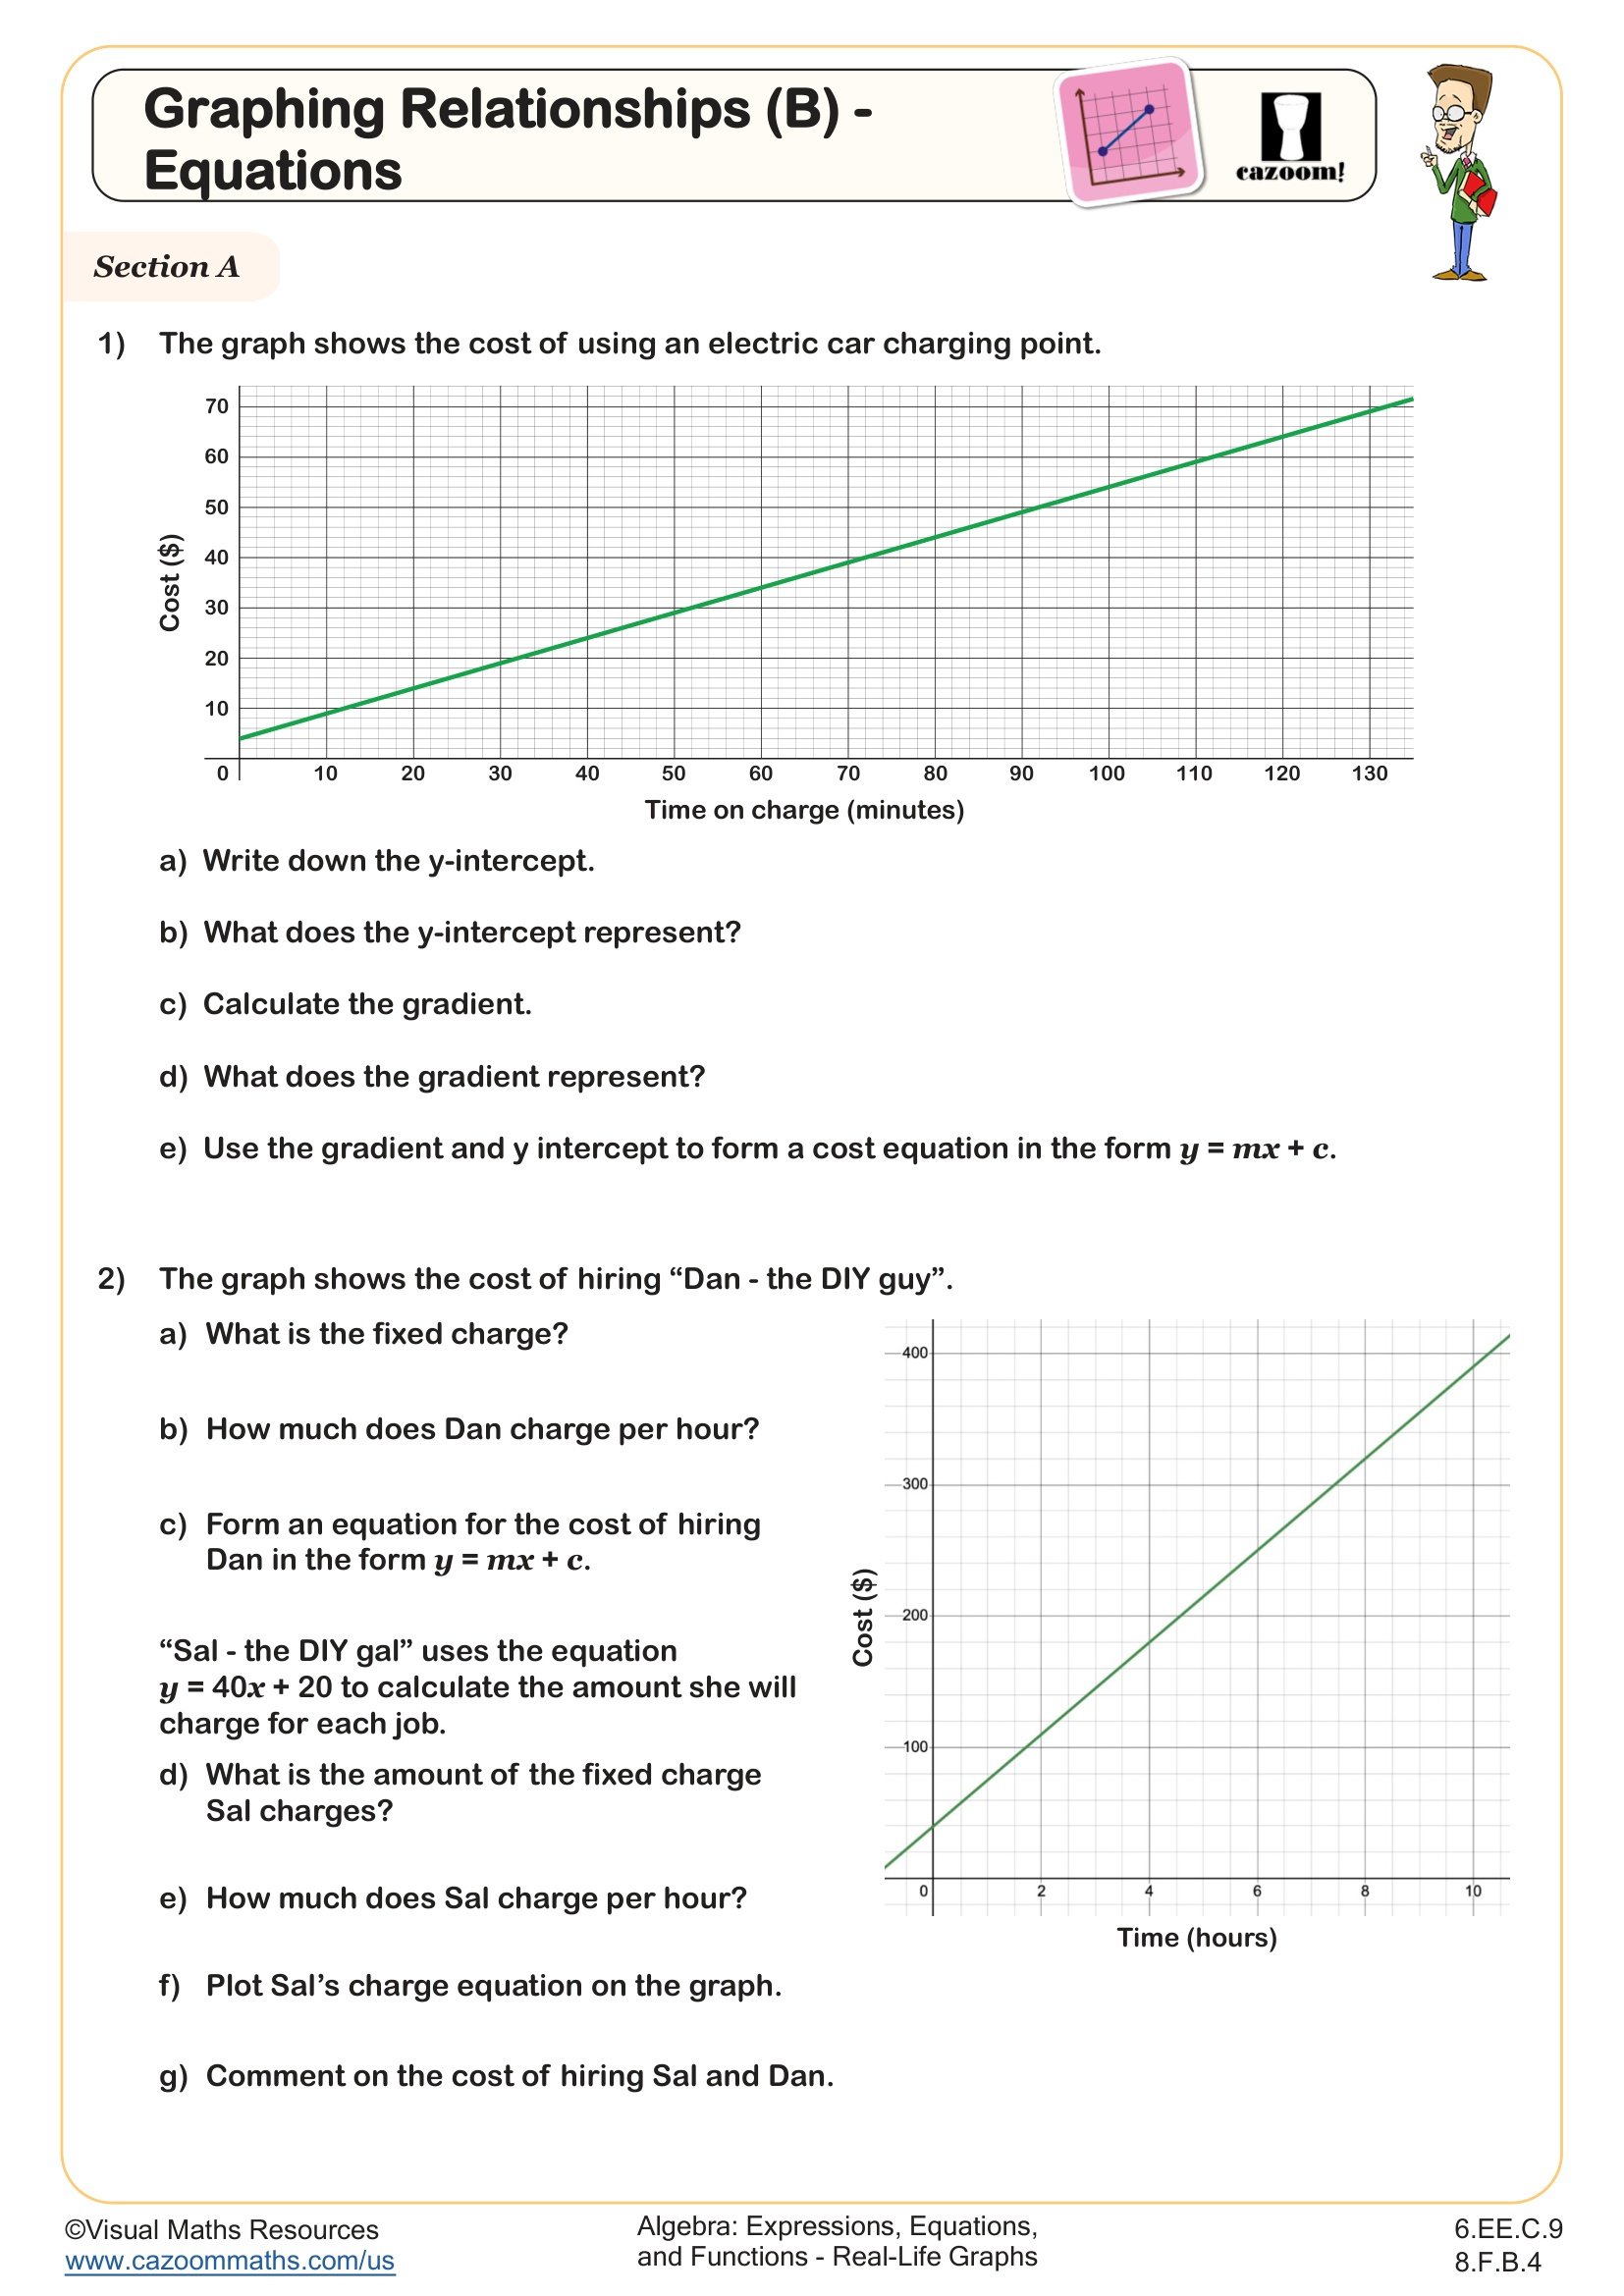
Students often lose points on assessments when they confuse the axes or misinterpret what a flat horizontal line means (no change in the y-variable, not that nothing is happening). Teachers notice that asking "What's happening at this moment?" while pointing to specific graph sections helps students move beyond mechanical point-plotting to genuine interpretation. The connection between slope and real-world rate becomes clearer when students describe graphs in complete sentences before attempting to draw them.
What Should 6th Graders Know About Graphing Real Life Situations?
By 6th grade, students should recognize that graphs can represent continuous relationships, not just discrete data points. They need to interpret features like increasing or decreasing sections, flat segments that show constant values, and what the steepness of a line reveals about how quickly something changes. Common Core Standard 6.EE.C.9 specifically addresses representing and analyzing quantitative relationships between dependent and independent variables using graphs.
This work builds directly on 5th grade coordinate plane foundations where students plotted individual points. The progression continues into 7th and 8th grade with proportional relationships, slope, and linear equations. Students who master real life graph interpretation in 6th grade find it easier to understand rate of change concepts later. Many teachers notice that students make significant progress when they start identifying independent variables (usually time or input) versus dependent variables (the changing quantity) before even looking at the graph axes.
How Do Students Draw Graphs from Written Descriptions?
Drawing graphs from scenarios requires students to translate words into visual representations of change. They must identify key events (starting point, changes in rate, stops, reversals), determine which variable belongs on each axis, and sketch segments that match the described relationship. Students need to consider whether change is gradual (sloped line) or instantaneous (vertical jump), and whether values remain constant (horizontal line) during parts of the scenario.
This skill connects directly to STEM fields where scientists and engineers interpret experimental data or design specifications. A biologist tracking plant growth over weeks, an engineer monitoring bridge stress during traffic loads, or a meteorologist analyzing temperature patterns all rely on graph interpretation. Students often experience a breakthrough when they physically act out scenarios (walking toward or away from a wall while a motion detector graphs their movement), making the abstract relationship between their actions and the resulting graph line concrete and memorable.
How Can Teachers Use These Real Life Graphs Worksheets Effectively?
These worksheets provide structured practice moving between verbal descriptions, graphical representations, and written interpretations. The answer keys allow students to check their understanding immediately, which is particularly valuable since graph interpretation involves judgment about whether a representation makes sense rather than arriving at a single numerical answer. The progression from guided examples to independent practice helps students develop the analytical thinking required for this topic.
Many teachers use these worksheets during small group instruction where students can discuss their reasoning before committing answers to paper. The materials work well for homework review where students compare their graphs to the answer key and identify where their thinking diverged. Some teachers assign one problem as a warm-up, then use student responses to address common misconceptions before releasing the full worksheet. Pairing students to create scenarios for each other to graph, then checking against these worksheets, extends the learning and builds deeper understanding of the relationship between situations and their graphical representations.